
Intro
Attention checks are a common method researchers use to catch unmotivated respondents who may harm data quality by not reading questions carefully, speeding through surveys, skipping questions, answering randomly, or providing nonsense responses to open-ended questions.
All researchers want high quality data, so it’s reasonable to want to remove respondents who don’t seem to be paying attention. But wouldn’t it be better if we could encourage respondents to pay more attention and answer questions more thoughtfully?
At Qualtrics, we found that asking respondents to commit to providing thoughtful responses decreased the rate of quality issues by over half compared to our control group. The commitment request was even more effective than using other standard types of attention checks.
Methods
We surveyed approximately 4,000 respondents using 5 different online panel providers. Respondents were randomly assigned to one of five treatment groups:
Here is a summary of each of the attention checks we tested.
1. Commitment
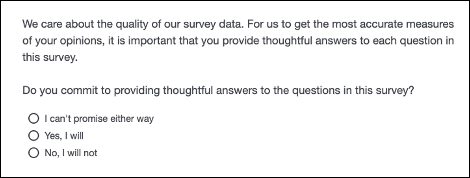
Respondents assigned to the first treatment group received a request to provide thoughtful answers to the survey; the request was preceded by an explanation that we care about the quality of our data. Only respondents who answered “Yes, I will” passed the attention check.
2. Factual
The next attention check was a factual question asking respondents to indicate which of the response options was a vegetable. The purpose of the factual type of attention checks is not to test respondents’ IQ, but to make sure that they were actually reading the question.
3. Textual
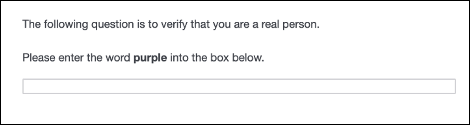
The third attention check required respondents to type their response. Even with 6 response options, it’s still possible that someone could pass the factual attention check just by chance. The typed attention check gets around this; it’s unlikely that bots could complete this. We were not sticklers on spelling. Any variation of response that looked close to the word “purple” was accepted.
4. Speed
The fourth attention check was a speed check. Respondents who sped through the first part of the survey received the warning above. Those who did not speed did not receive a warning. In this way, only those who exhibited undesirable behavior (i.e., speeding) received the attention check.To determine “speeding,” we conducted a soft launch of about 100 responses, and used half of the median soft launch time to determine a speeding threshold.
Results
Overall, rates of failing the attention checks were pretty low with 1 to 5 percent of respondents failing depending on the attention check. Surprisingly, the Commitment request had the most fails and the Textual attention check had the fewest.
Of those who failed, we examined what percent failed at least 2 other quality indicators. We looked at a battery of 11 other quality indicators including things like straightlining, inconsistent answers, and providing bad open-ended responses.
The percent of respondents failing the attention checks who also failed 2 or more other quality indicators ranged from 24% for the speed check to 86% for the textual attention check. However, the number of people failing each attention check is too small to tell meaningful differences.
Of Those who Failed Attention Checks, What Percent Failed 2+ Other Quality Indicators?
Next we looked at the opposite - of the respondents who passed the attention checks, what percent of those failed two or more quality indicators?
Of Those who Passed Attention Checks, What Percent Failed 2+ Other Quality Indicators?
* Treatment different from control at significance p<0.05
We found that respondents who received either the Commit, Textual, or Factual attention check failed fewer other quality indicators than respondents who did not receive any treatment condition.
Respondents who received the commitment request had the fewest quality issues. The rate of failing 2 or more quality issues dropped to less than 5% for those who received the commitment (compared with 11% for control). This difference was statistically significant at the p <0.05 level.
There was no statistically significant difference between the Speed treatment group and the Control. This is very telling because with the speed attention check, only those who sped saw the attention check. Thus, respondents in that treatment group who did not speed are very similar to the control condition because they did not see an attention check. With the other 3 treatment groups, everyone saw the attention check.
Qualtrics recommendation is to use the commitment request as that performed the best. However, the textual and factual attention checks also performed better than the control.
Attention check best practices
As you consider adding attention checks to your survey, there are some things to consider.
Explain why you’re including attention checks
Recent research from the Leibniz Institute for Social Sciences suggests it can be helpful to explain to respondents why attention checks are being used (Silber, Rossman, & Gilber, 2021). For example, because you care about data quality or to verify that they are a real person.
Avoid tricky questions
We recommend avoiding attention checks that are intentionally “tricky.” For example, we know that respondents tend to skim lengthy intros and jump right to the question. Therefore, do not bury an attention check in a lengthy introduction. In this case, high rates of incorrect response don’t indicate fraud, they indicate a bad question.
We also know that instructions should be placed where they are needed rather than all instructions being placed at the start of the survey. Therefore, don’t provide an instruction at the start of a questionnaire and expect people to remember it several questions later. This is not testing whether someone is answering honestly but how good their short term memory is.
Avoid attention checks at the end of a long boring grid
Grids should be used sparingly and they should be a reasonable size (6 or fewer rows/columns) to avoid burden. If you have 10 long grid questions in a row, then it is expected that respondents will become increasingly unmotivated and may not read as carefully as desired. Rather than burying attention checks in your grid, consider how to make your questions more engaging and easy for respondents to answer.
Attention checks should not be intelligence tests
Don’t make attention checks too hard for your audience. They are intended to check that the respondent is paying attention, not test their IQ. “Test-like” questions like "In which direction does the sun set?" can be off-putting as people think you're trying to measure their intelligence. Plus, just because someone mixes up which direction the sun rises and sets does not mean that they cannot give valid answers to the rest of the questionnaire.
You’ll notice that with the (Which of these is a vegetable?) Factual attention check shown earlier, we deliberately did not include any fruits. We only included options that were obviously wrong.We were not trying to see if respondents could correctly differentiate between common fruits and vegetables, but to make sure they are actually reading the questions.
Another option, along the same lines as a factual attention check, is to tell the respondents to pick a specific answer. For example, “To ensure you are paying attention, please select agree.” or “To ensure you are a real person, please select the color red.”
What about falsification checks?
If you have a specialized audience (e.g., IT decision makers) and your survey has a large incentive, you may be concerned about falsification (e.g., people claiming to work in IT when they do not so that they can receive the survey incentive). In these instances, it may be reasonable to add a factual attention check that can be used to verify that the respondents completing the survey are who they say they are. However, we consider this a falsification check, rather than an attention check.
Alternatively, you may include a fake brand in a question that asks which brands the respondent has recently purchased. When fake brands are used, take care that the brand does not sound similar to a real brand (even for a different industry). We recommend using made up words (e.g., VivaKix or Stryxx) rather than using real words in the brand name (e.g., Top Notch Shoes) as this will reduce misattribution.
People who fail falsification checks are likely paying attention to your questions, but they may be answering dishonestly in order to qualify for the survey and earn an incentive. Usually, falsification checks are only needed on studies with higher incentives. One question during the screening section should be sufficient.
How many attention checks do I need?
For most surveys, just one attention check towards the beginning of your survey is sufficient. Putting the attention check in the beginning is useful for a few reasons. First, we found that the commitment check style of attention check reduced other quality issues later in the survey. Second, if your survey has any randomization in it, you’ll want to remove poor quality responses prior to the randomization to ensure an equal number of final responses are allocated to each group.
Additional attention checks toward the end of a survey are often not useful in identifying or preventing fraudulent responses, and are typically more indicative of survey fatigue. Too many attention checks can cause break offs or frustrate respondents leading to worse data quality on the rest of your survey. Often a better approach is to reduce the length of your survey.
One exception would if you need to verify that respondents saw a specific stimulus embedded in the survey. For example, if you asked respondents to watch a video of a new product, it would be reasonable to include an attention check aimed at verifying whether they actually watched the video as that will be critical for your analysis.
Will attention checks will harm my data?
In our study, we found that people in certain demographic groups were disproportionately more likely to fail attention checks (even when “tricky” attention checks were avoided). However, keeping respondents who fail attention checks in your survey will not make your data more representative than removing them.
Instead, you will need to take additional steps to ensure representativeness of your sample. For surveys that use quota sampling (common with online panels), we recommend removing those who fail attention checks in real-time so that your quotas will not be incremented. This will allow you to fill your quotas as designed and ensure representativeness across all demographic groups.
For surveys that don’t use quotas, you may need to oversample certain demographic groups or weight your data so that it is representative of the population once the poor responses have been scrubbed.
The results documented in this blog post were presented at the 2022 annual conference of the American Association for Public Opinion Research (AAPOR).