
When essential business decisions are being made using survey data, you need to know if that data is accurate and reliable. But can any market research – or any research in general – truly reflect a whole population?
The answer is typically no – it’s almost impossible to find a sample that 100% matches the characteristics of an entire population. Which is why it’s so important to build margin of error into your research and data.
But what exactly is margin of error? How much can or should it impact the level of confidence you have in your survey results? And most importantly, how do you calculate it?
Free eBook: This Year’s Global Market Research Trends Report
Margin of error calculator
Input your survey data into our easy-to-use calculator, or experiment with the numbers to see how they impact margin of error.
What is margin of error?
Margin of error is used in research to determine the precision of a result, such as a poll, survey, or a scientific study.
Expressed as +/- percentage points, margin of error tells you to what degree your research results may differ from the real-world results, revealing how different – more and less – the stated percentage may be from reality. A smaller margin of error is better as it suggests the survey’s results are more precise.
Putting this into practice, if researchers estimate that 52% of people prefer a certain product with a +/-3 percentage point margin of error at a desired confidence level of 95%, the actual percentage of people in the overall population who prefer the product is between 49% and 55% 95 times out of 100.
In this specific example, the margin of error calculation is especially valuable because it shows us that the people who prefer this product may not actually be in the majority.
Margin of error is calculated from a number of variables: your desired precision (which is known as the confidence level and is typically 95%), your sample proportion, and your sample size. These statistics are all explained in further detail when we look at how to calculate margin of error
What is a confidence interval?
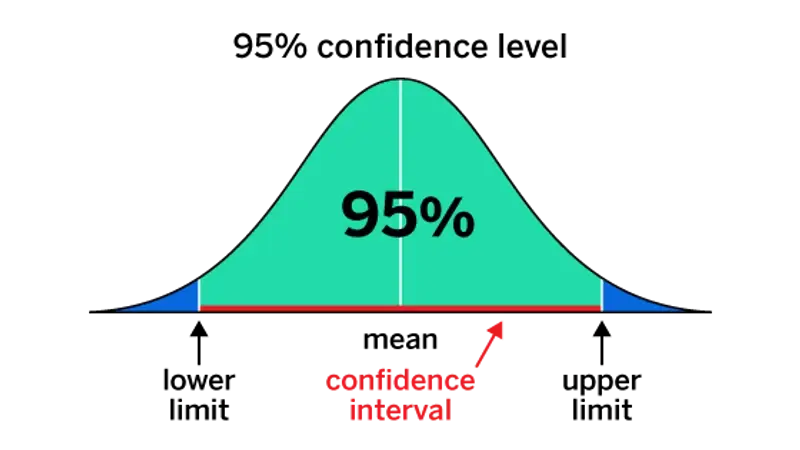
A confidence interval is a range that we think contains the true value of something we’re measuring in a population. We apply margin of error to it to help us understand how precise our estimate is.
A confidence interval comprises a lower and upper limit that the true value of a population parameter is deemed to fall between, with a specified level of confidence that’s usually 95%. For example, a 95% confidence interval for the proportion of people who prefer a certain product might be between 49% and 55%, which means you’re 95% confident that the true mean value for the total population lies within that range.
When is margin of error used?
Margin of error is used when you have a random or probability sample. That means the survey respondents have been selected at random from your total population.
However, it won’t be relevant to your market research data if your sample has been selected in a non-random way, like if you’ve used an opt-in research panel. Your participants may have been selected because they have particular characteristics, or have volunteered for the panel in return for benefits, and therefore aren’t randomly selected from the population size at large.
How to calculate margin of error
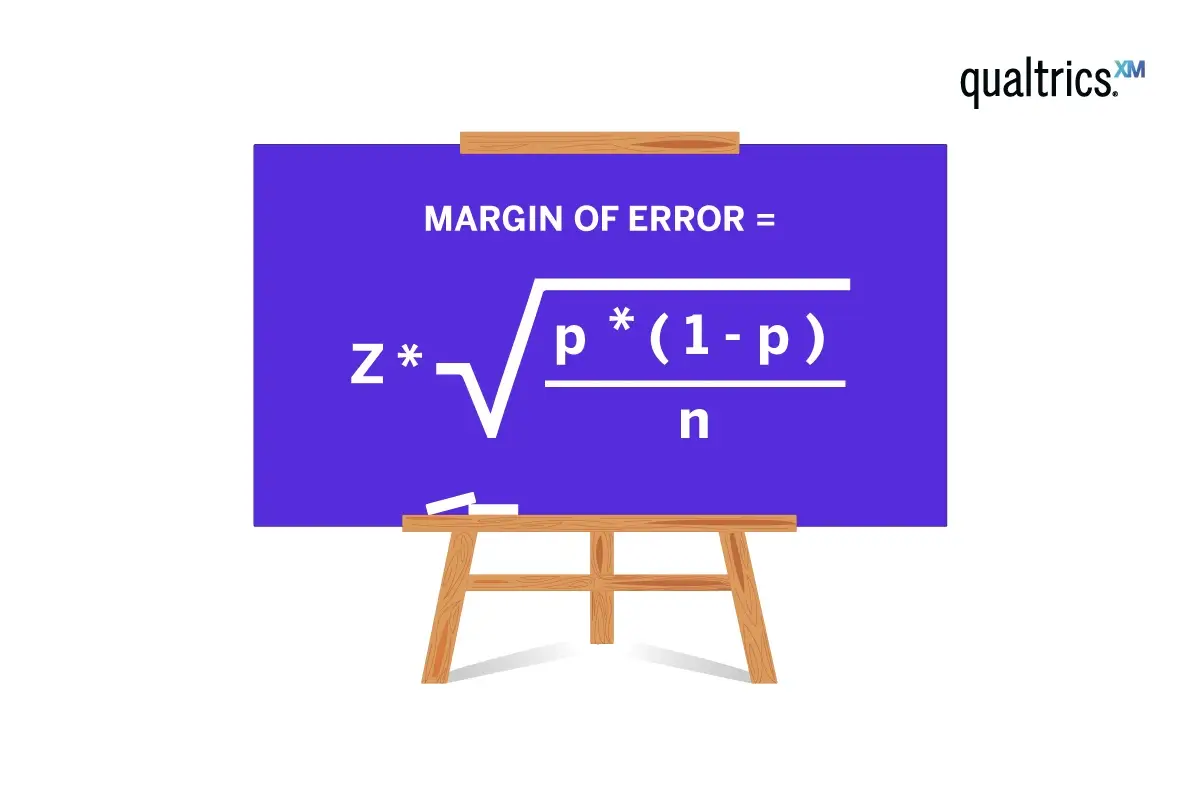
Margin of error for a proportion is calculated using the following formula:
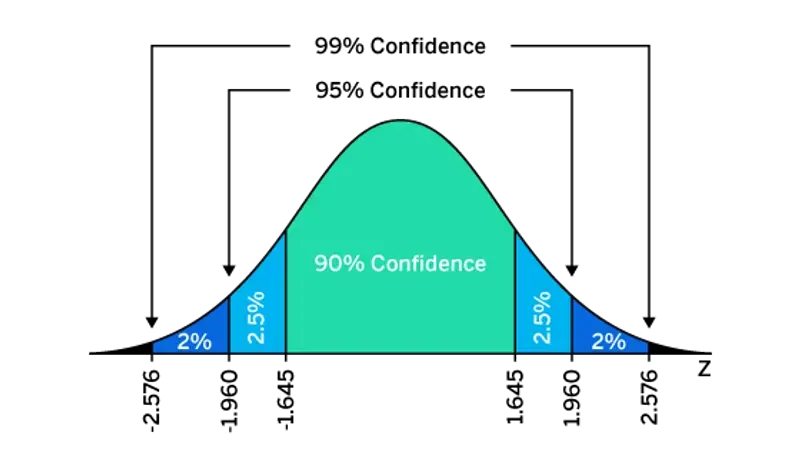
Confidence level indicates how certain you are that your sample reflects the total population. The most commonly used confidence level is 95%. A 95% confidence level means that if you took a random sample of this population 100 times, you would expect the value you’ve got to be within the confidence interval 95% of the time. The z-score for a 95% confidence level is 1.96. Confidence levels of 90% and 99% are also used, with respective z-scores of 1.65 and 2.58.
The sample proportion is the percentage of the sample that has the characteristic you’re interested in, such as the percentage of respondents who were very satisfied with your product. It’s a decimal number representing a percentage, so while you’re doing the calculation it’s expressed in hundredths: if our proportion is 5% of respondents, it would be 0.05.
Finally, the sample size is the total number of people you’re surveying, or your number of completed responses.
How to calculate margin of error: Example question
Imagine you’re a business surveying your current customers. You’ve run a survey with a randomly selected sample of 1,000 people from your CRM that represents your target market.
The results tell you that of these 1,000 customers, 52% (520 people) are happy with their latest purchase, but 48% (480 people) are not – yikes. What is your survey’s margin of error?
The 520 customers who are happy with their latest purchase represent our sample proportion. To use this in the margin of error formula, we need to express it as a decimal representing a percentage of our total sample size. To do that we just need to divide 520 by 1,000, which gives us 0.52 – our p value.
We’ll assume a 95% level of confidence, so the z-score is 1.96.
How to calculate margin of error: Step-by-step guide
Here’s how to use the margin of error for a proportion formula, using the numbers from our previous section.
- Subtract p (0.52) from 1, which gives 0.48
- Multiply 0.48 by p, which equals 0.2496
- Divide 0.2496 by n (1,000), giving 0.0002496
- Calculate the square root of 0.0002496, which is 0.0157987
- Multiply 0.0157987 by the z-score (1.96), which equals 0.0309654
- Express that decimal as a percentage, which is 3.1% when rounded up
We can now report with 95% confidence that 52% of customers were happy with their latest purchase, with a margin of error of +/- 3.1%.
Considerations when using the margin of error for a proportion formula
There are a couple of conditions to note when using this formula to calculate margin of error:
- n x p must equal 10 or more
- n x (1-p) must equal 10 or more
But these won’t impact the majority of survey results. That’s because survey research usually involves high numbers of people in a sample. So, unless your sample is a smaller group, or the proportion within your sample is very small, there won’t be a problem. If you’re getting numbers below 10 for either of these checks, you may need to increase your sample size.
What affects margin of error?
Margin of error can be influenced by a range of different values.
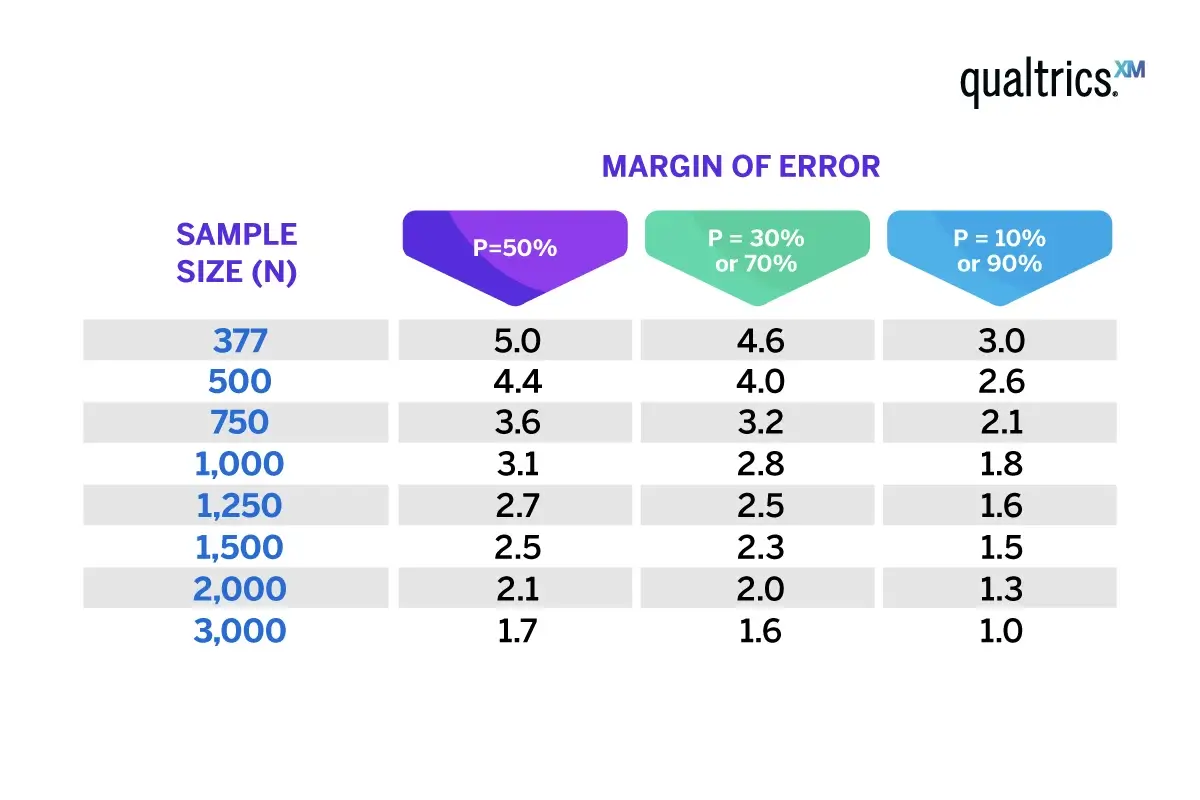
In the below table, we can see how margin of error shifts when sample size and sample proportion change. Here we’re assuming that a simple random sample is being surveyed, that the full population size is over 20,000, that power is 80% and a 95% confidence level.
How sample size affects margin of error
The general rule is that the larger the sample size, the smaller the margin of error, and vice versa.
When we take a larger sample size, we increase the representation of the population in the sample. This means that the sample proportion estimate is more likely to be closer to the true population proportion, which reduces the margin error.
A smaller sample size, on the other hand, is less representative of the population, which increases the margin error.
How sample proportion affects margin of error
With sample proportion, the margin of error increases as the proportion gets closer to 50%, and decreases when the proportion is closer to 0% or 100% – as we can see in the above table. This happens because the standard error is largest when the sample proportion is 50%.
However, the effect of sample size on margin of error is stronger than the effect of sample proportion, meaning that increasing the sample size will still decrease the margin of error, regardless of the sample proportion.
How population variability affects margin of error
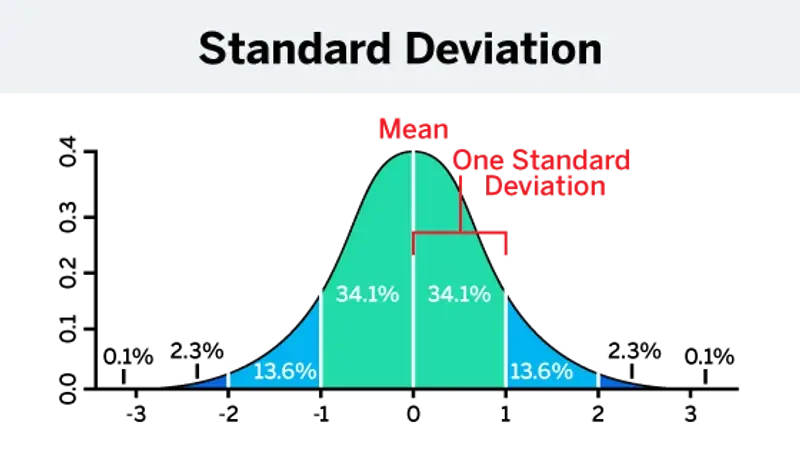
Population variability, or population standard deviation, is a measure of how spread out the data values are in a population. A larger standard deviation means that the data values are more spread out, and a smaller standard deviation means that the data values are more tightly clustered around the mean.
The larger the population variability, the larger the margin of error; the smaller the population variability, the smaller the margin of error. If the population is more variable, you need a larger sample size to achieve that smaller margin of error.
How Qualtrics can help
No matter the survey, research project or poll, Qualtrics XM for Strategy & Research has the tools and capabilities you need to derive insight from data — and go from insight to action.
Used by more than 13,000 customers, Qualtrics CoreXM brings your survey, research, and polls into one platform, rather than multiple tools, enabling you to scale your activities, improve data quality, and uncover new opportunities.
With CoreXM, get insights faster through automation, reduce project costs and admin by consolidating your tools, and increase project impact by leveraging best-in-class survey methodologies and tools.
From simple polling and internal feedback surveys for strategy to gleaning customer, product, brand, and market insights, Qualtrics XM for Strategy & Research empowers every department to carry out and benefit from research.
And if you want to get even more from your research, take advantage of Qualtrics’ Research Services and a network of experienced partners. Through trainer experts, unlock cost and time savings, while benefiting from flexible service options that let you choose how much or how little support you need.