-

Qualtrics Platform -

Customer Journey Optimizer -

XM Discover -

Qualtrics Social Connect
Paginated Table (Results)

About Paginated Tables
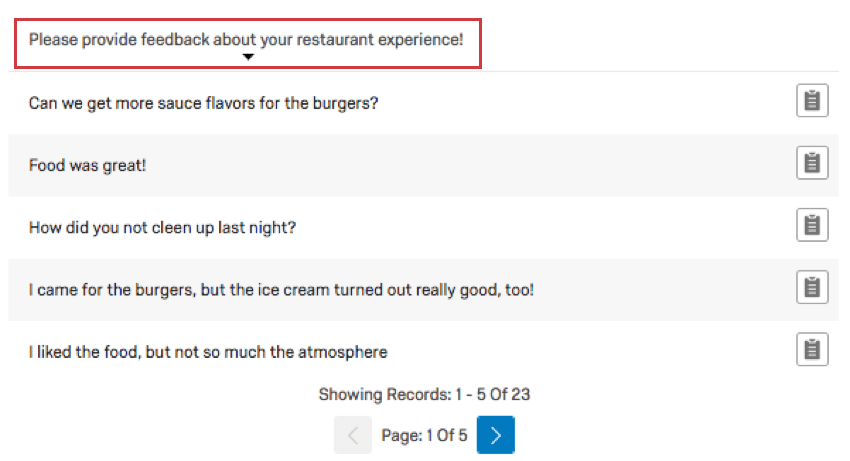
Paginated Tables allow you to view all your open response data from Text Entry questions. In this visualization, you can see the specific answer text of a response. The answers are broken up into different pages, and you can switch between pages using the arrows at the bottom of the visualization.
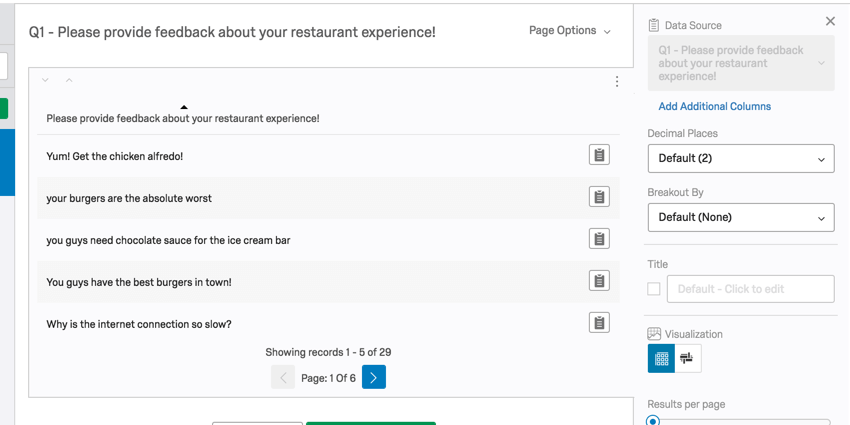
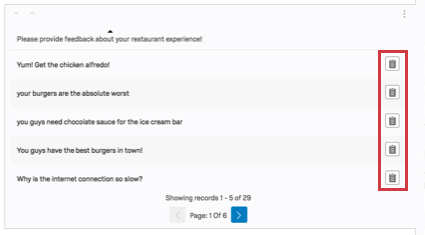
Qtip: When viewing this table in Qualtrics, you can click the icon on the far-right of each row to open the full survey response. However, if you share a public report with a Paginated Table in it, clicking the icons will not display any data. This is meant to protect your survey responses.
Customization Options
For general settings, see the Visualizations Overview support page. Read on for settings specific to the Paginated Table.
Add Field
Once your table is set up, you can add additional columns of information to it.
- Click on your visualization.
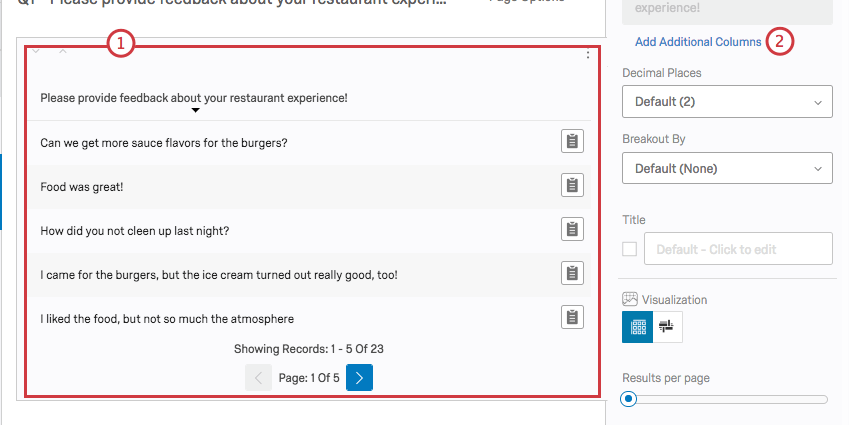
- Click Add Additional Columns.
- Click the dropdown arrow and select the additional field you want to include.
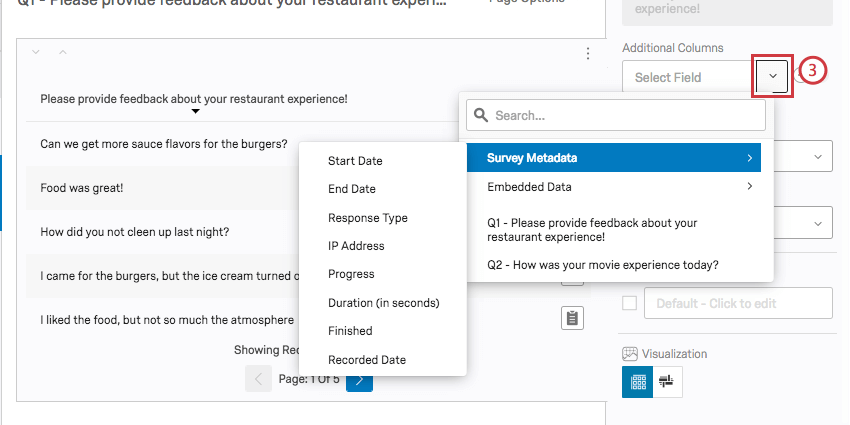
- Use the plus ( + ) and minus ( – ) signs to add and remove additional fields.
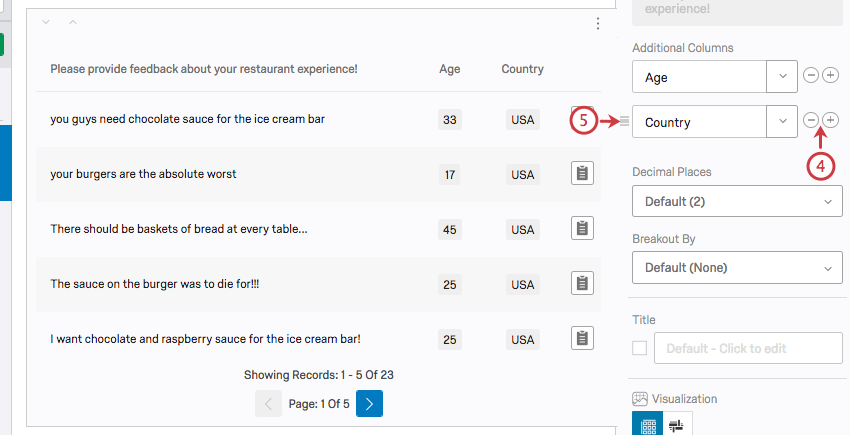
- Click the icon and drag it to change the order your fields appear in.
Results per Page
Within a Paginated Table visualization, you can customize Results per page. This setting controls how many text responses you will view on each page of the visualization. By default, this is set to 5 results per page, but you can set this to be as high as 100.
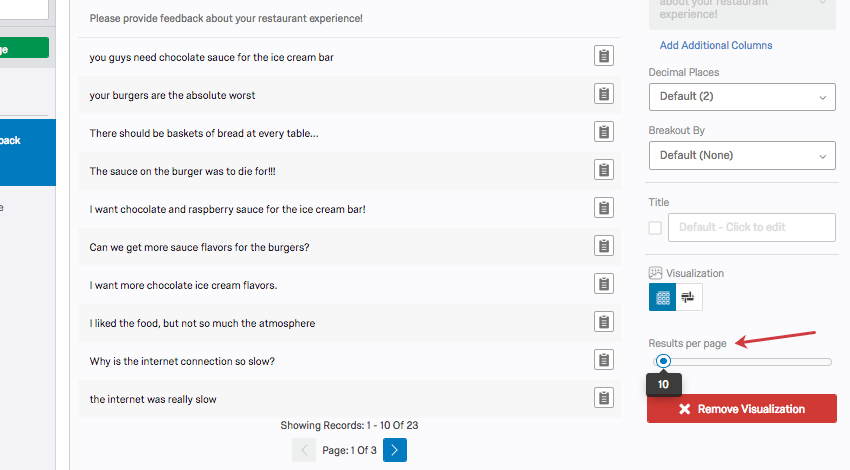
You can only change this setting by increments of 5.
Compatibility
Paginated Tables are compatible with all open-text fields that do not have numeric validation on them. This includes:
- Text Entry questions
- Form field questions
- Open text fields on other questions, such as Text Entry Matrix Tables, text entry columns on Side by Sides, and “Other” text boxes
- Text type Embedded Data
- Text type manual variables
Paginated tables are also the default visualizations for File Upload and Signature questions.
When adding additional fields to the Paginated Table, all questions and data sources are compatible.