
Applying Filters to BX Dashboards
What's on this page
About Applying Filters to BX Dashboards
Adding filters to your dashboards lets you narrow down your data and bring more insight to your analyses. However, because each filter automatically tries to apply itself to the dashboard, trying to edit multiple filters can slow down dashboard performance. To prevent this impact, BX Dashboards now give you the option to add an “Apply Filters” button to your dashboard. That way you can wait to apply multiple filter changes until you are finished creating your filter.
Qtip: This page covers how to get “Apply Filters” added to a BX dashboard. If you want to learn more about building dashboard filters, see Filtering CX Dashboards. Although this support page is for CX Dashboards, the functionality is the same in BX.
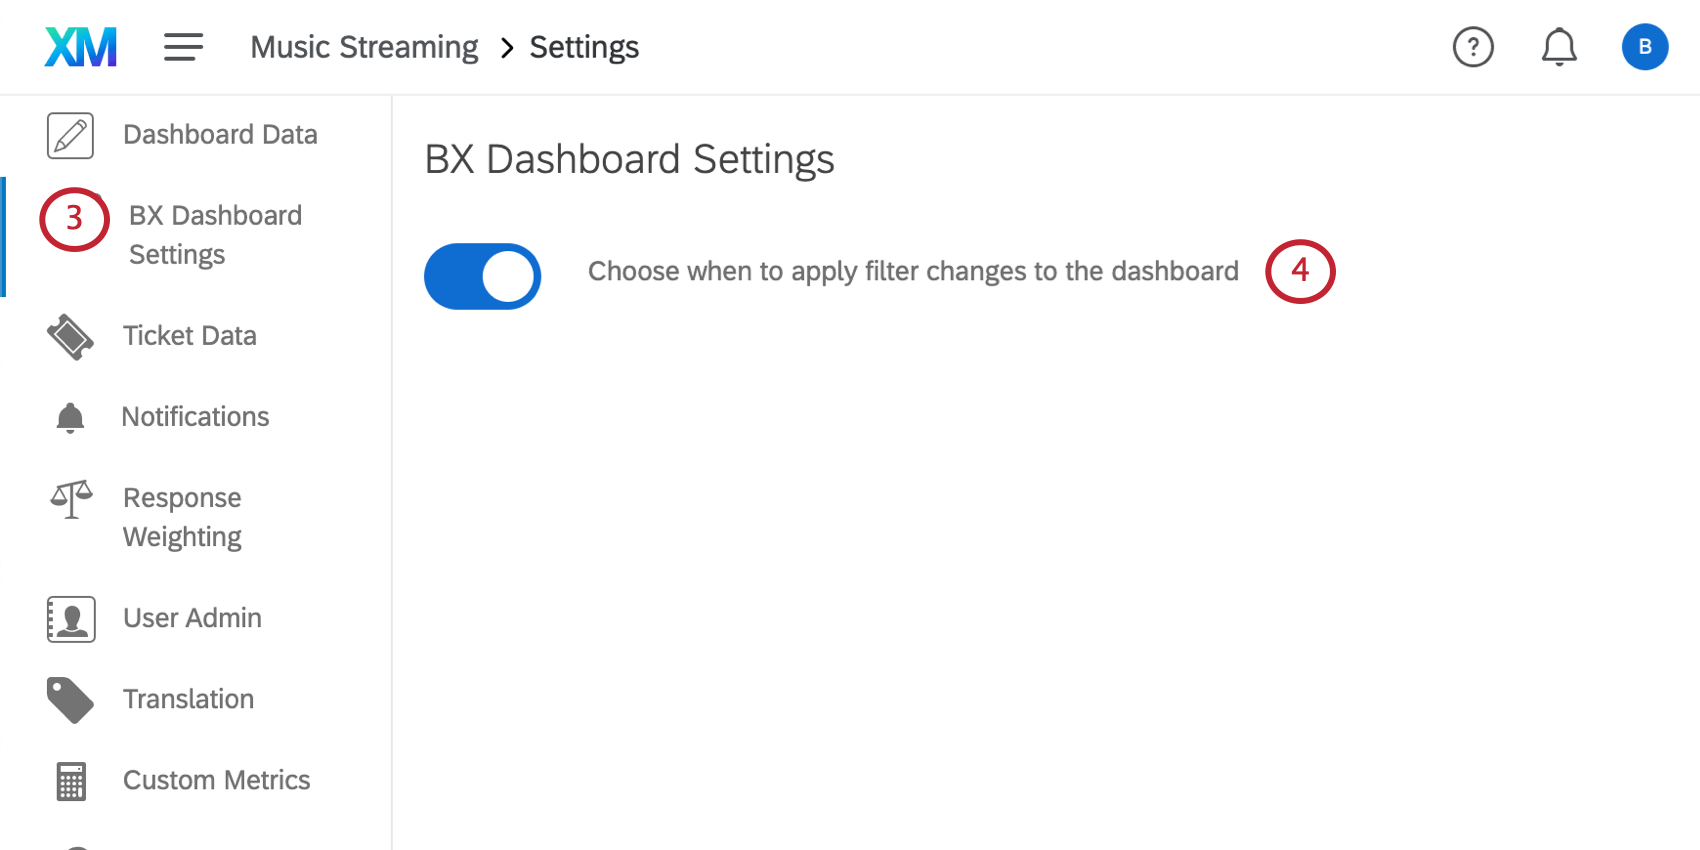
Enabling the BX Dashboards Settings
First, you need to enable this feature on your dashboard. It will be disabled by default.
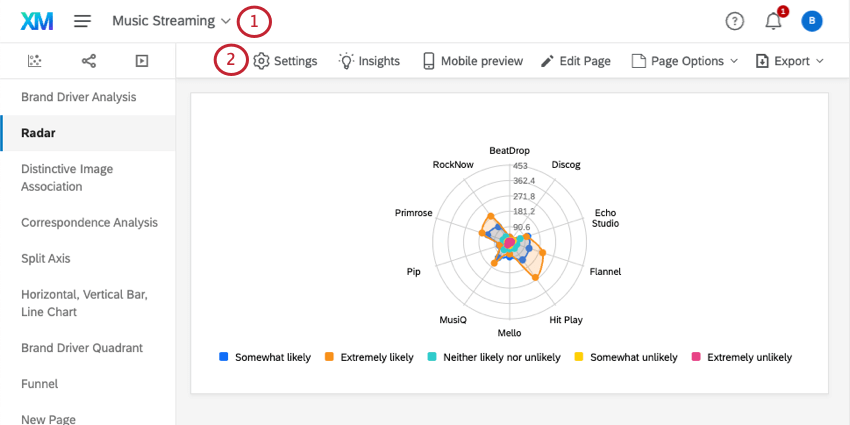
Applying Filters to BX Dashboards
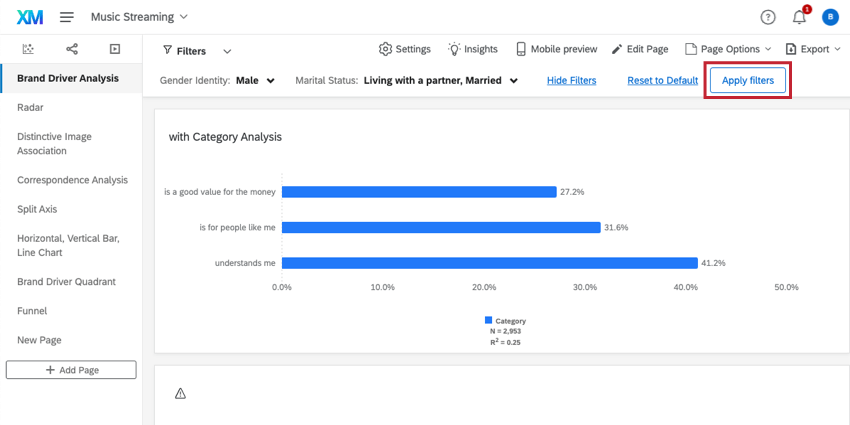
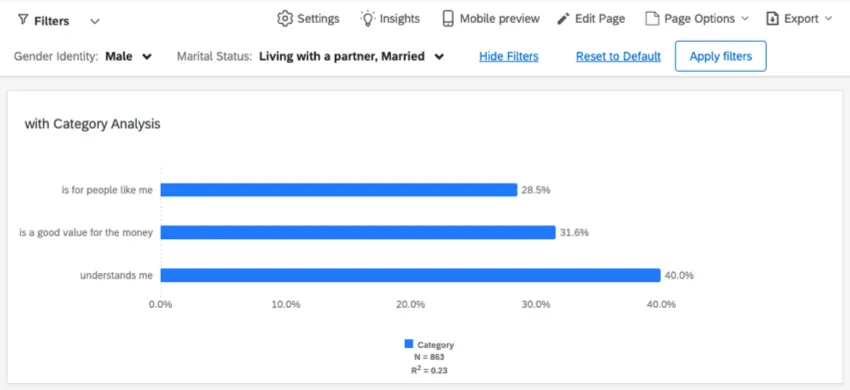
Once you’ve enabled BX Dashboards Settings, you can apply filters to your dashboard. As you build and adjust filters, you’ll notice that the data in the dashboard is not changing. In order to apply filter changes, you need to click Apply filters.
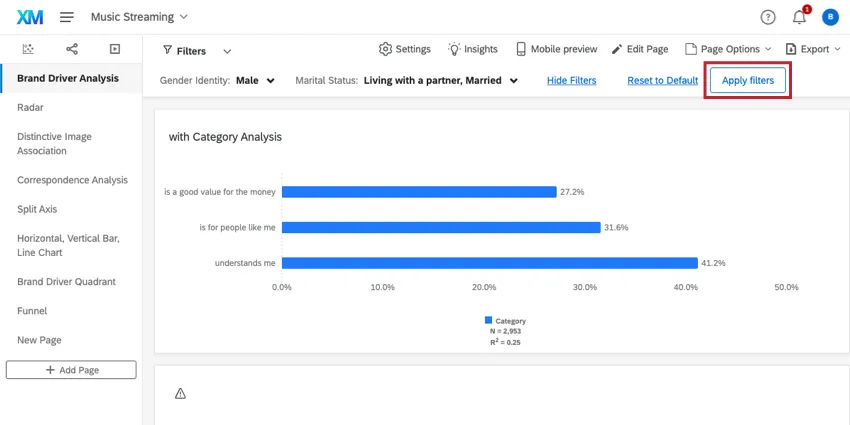
Example: Notice how the numbers in the widget change once the filter is applied.
That's great! Thank you for your feedback!
Thank you for your feedback!