
Conjoint Clustering
What's on this page
About Conjoint Clustering
Within populations of survey respondents are groups of like-minded people. These groups, or “clusters,” can be determined by how similar each respondent’s optimal package is. By clustering each respondent based on their individual utility for each attribute, we can determine subpopulations and what demographics make up these subpopulations.
Qtip: This feature is incredibly useful when you are looking to define segments.
Preparing a Survey for Clustering
Before you can use conjoint clustering, you have to make sure that the survey of your conjoint project is asking the right questions. This means you need to set up certain features before you collect data.
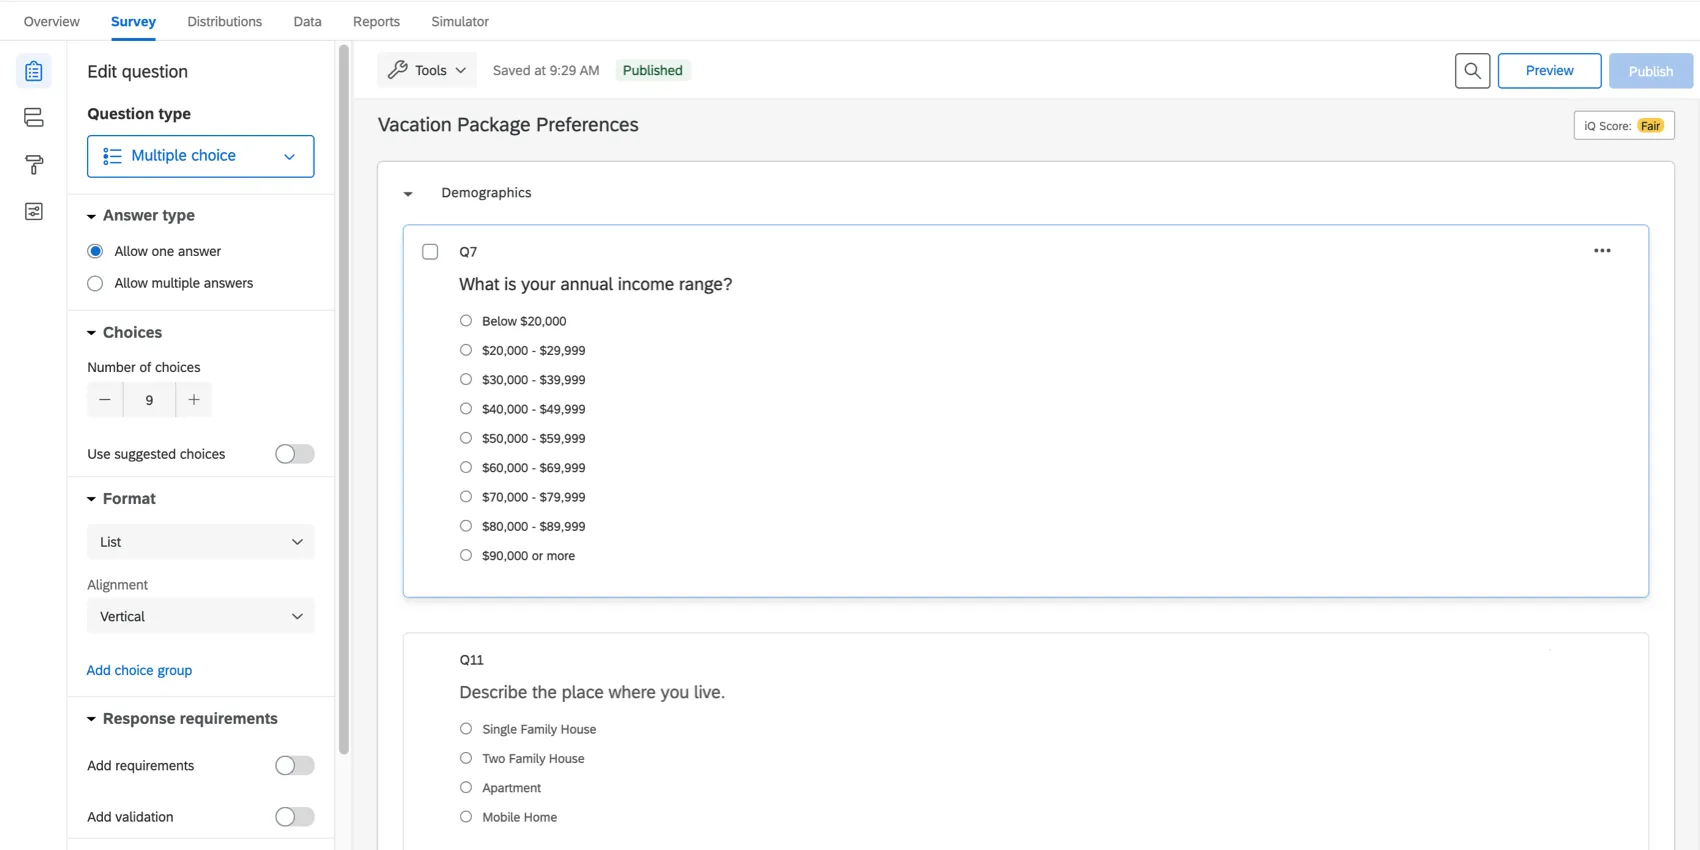
In the Survey tab, make sure you’ve added questions to a non-conjoint block. In the example below, the Demographics block has a question on age, the number of people in the respondent’s household, and more.
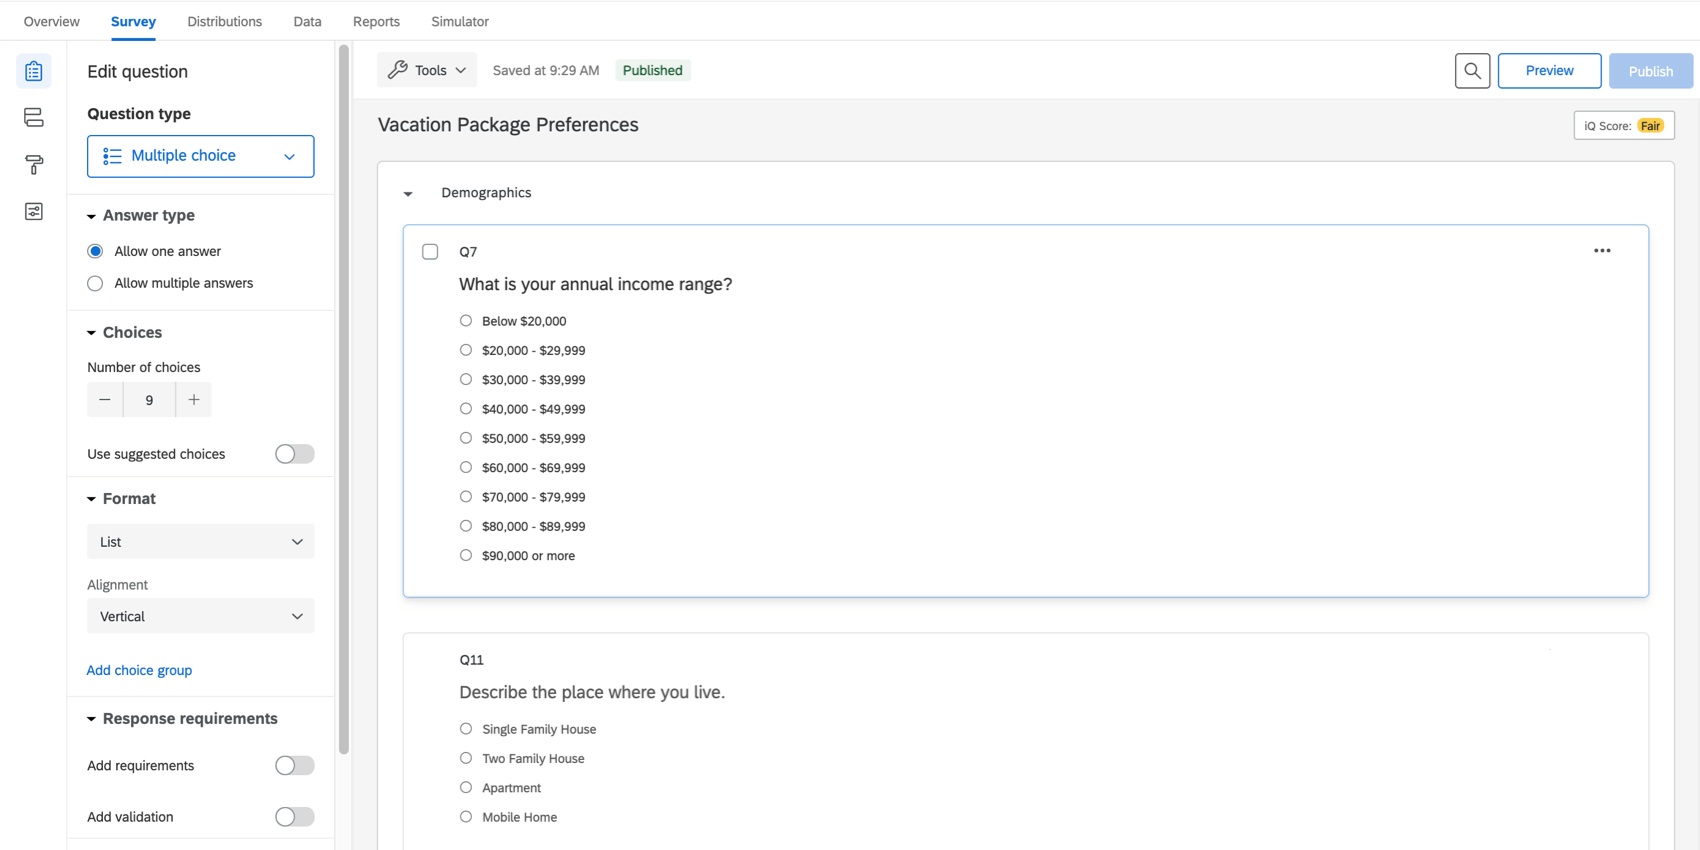
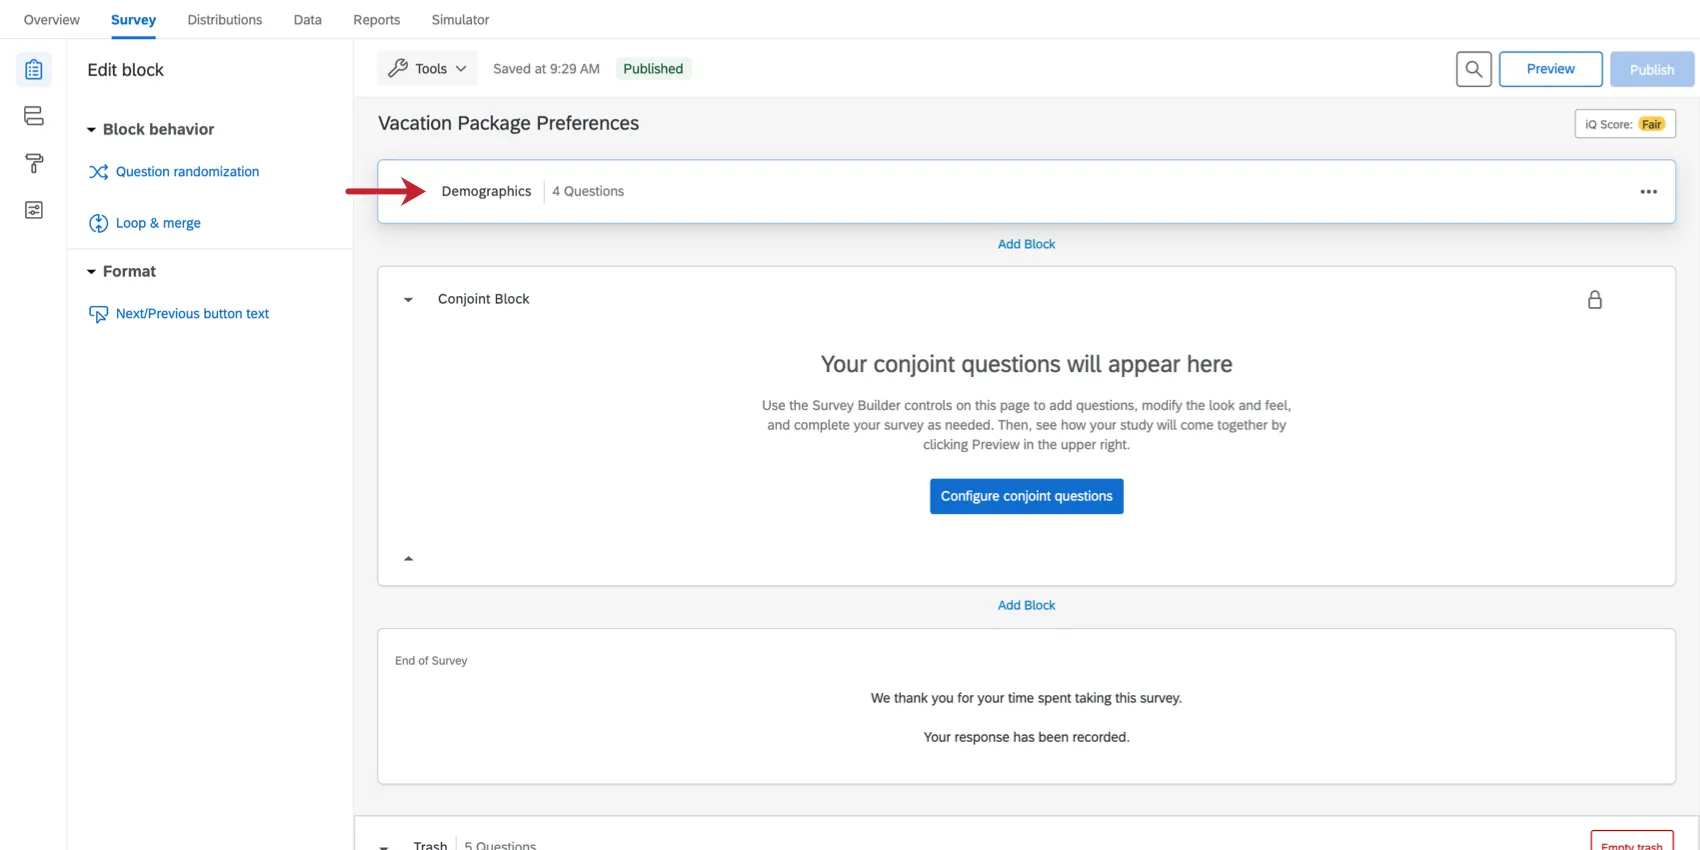
The Demographics block is located right above the conjoint block, although you can move it as desired.
Question Formatting
You can only conduct conjoint clustering using single-answer multiple choice questions. This is because they offer a finite selection of choices that can be easily analyzed. You can also use some survey metadata, such as start date, IP address, recipient information, and more.
- Demographics: Ask about basic descriptive information, such as age, income bracket, race, or gender.
- Behavior: Ask how customers interact with your brand and your products, or about behaviors that may relate to their purchasing behavior. For example, you can ask how often the customer goes shopping.
- Operational Data: This is information such as time spent on your website, or an employee’s tenure in your company.
- Question Formats: Format questions about behaviors and beliefs as scales. The range on a scale can help us understand what scale points are correlated and therefore roughly in the same cluster; Yes/No and single-select questions are not as useful for cluster analysis. Example: If you ask “What kind of shopper are you?” and give the options “Prefer shopping at malls”, “Prefer shopping online”, and “Prefer shopping at boutiques”, the clustering algorithm will want to divide respondents into three groups, one for each answer. If you instead asked those as a series of questions (e.g., “Do you like shopping at malls?”) with responses 1 through 7, the clustering algorithm will do a better job at really discerning what separates different shoppers from each other.

Qtip: Once you’re finished adding questions, don’t forget to publish.
Enabling Clusters
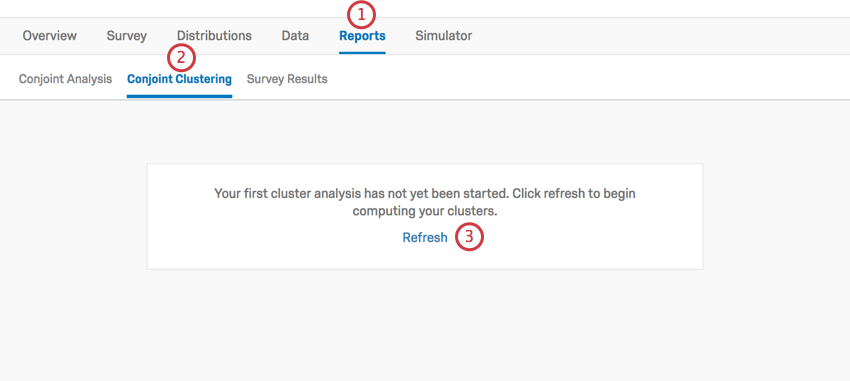
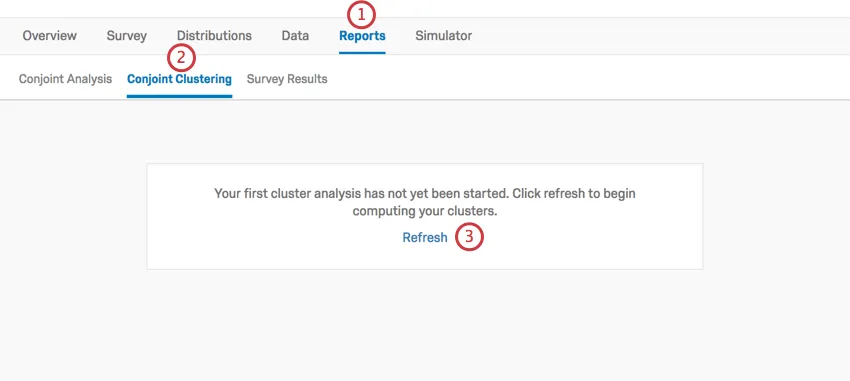
Qtip: Like conjoint results and the simulator, the conjoint clustering report refreshes hourly.
Adjusting Demographics Used in Clustering
By default, conjoint clustering will use every multiple choice survey question you have made. However, you don’t have to use every question if you don’t want to, and you can add and remove content to see what different clusters this feature recommends to you.
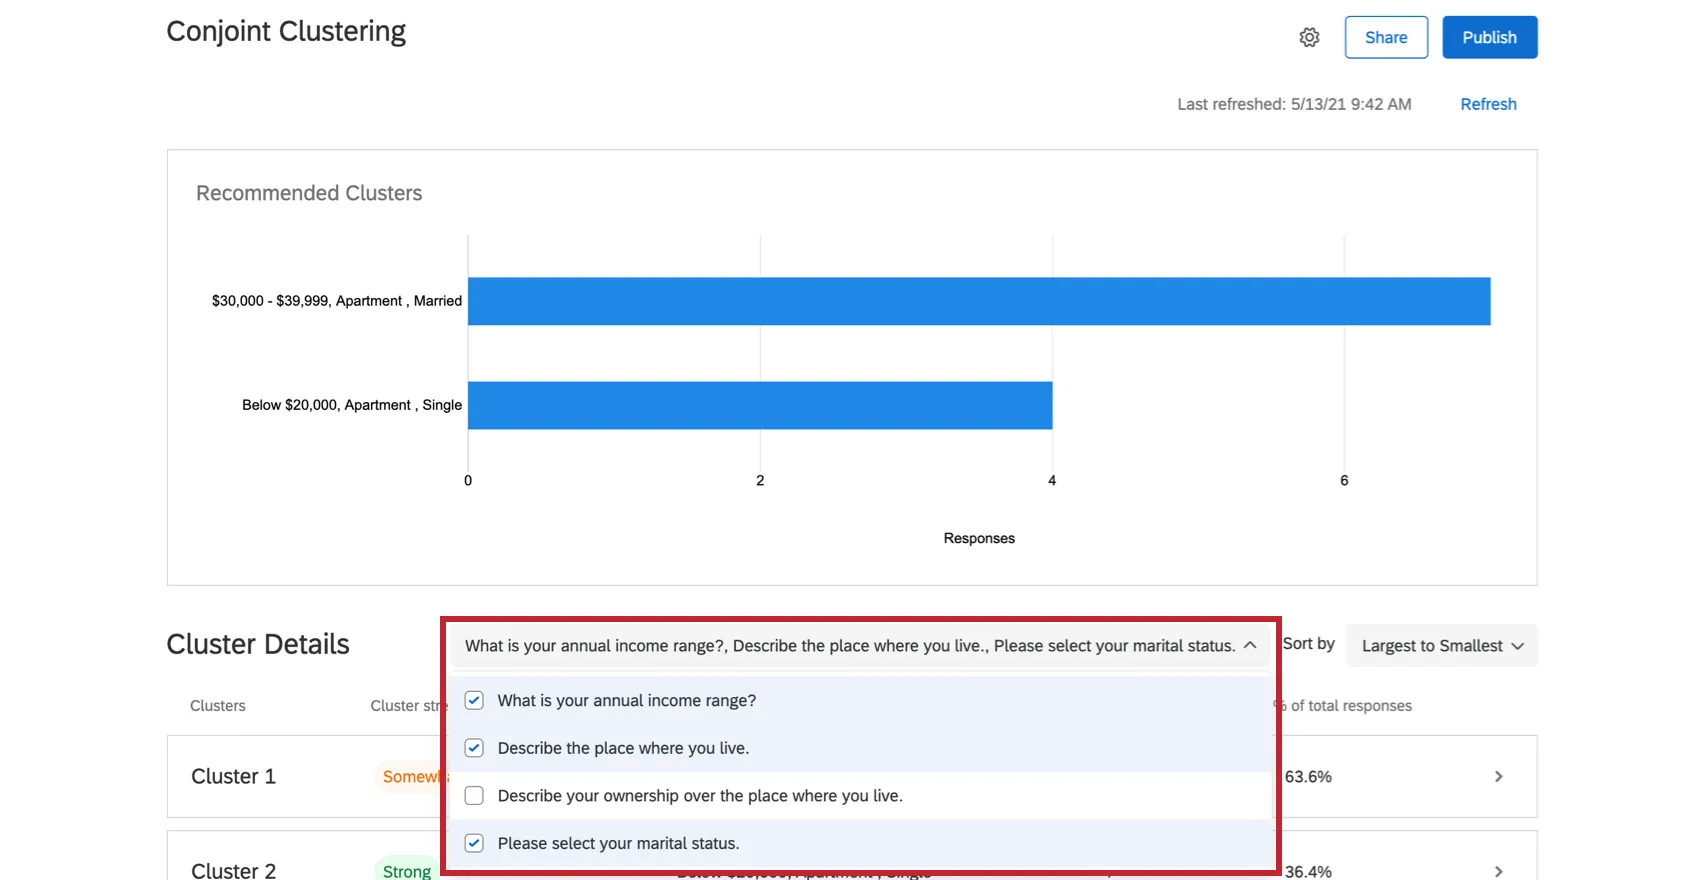
Adding & Removing Demographics
In the box to the right of the Cluster Details header, select a question to add or remove it from cluster analysis. Removing a question does not cause the clusters to recalculate.
Recommended Clusters
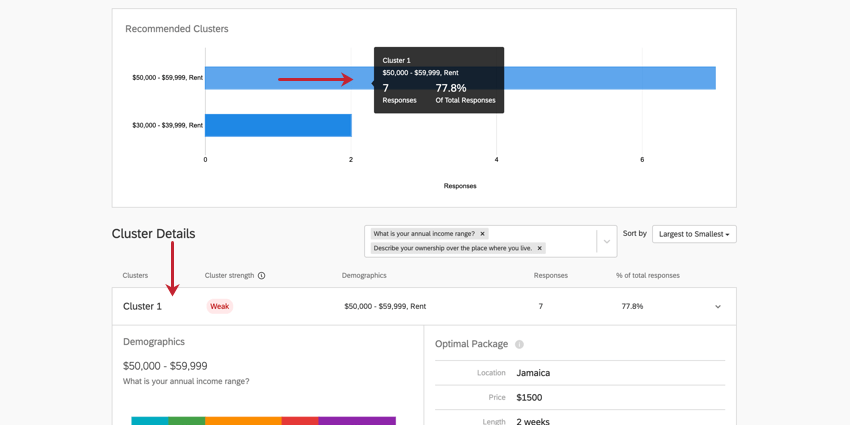
Once you’ve collected enough data and refreshed your conjoint clustering page, this feature will recommend clusters to you. These clusters are determined based on how similar the respondents’ optimal package is. Their individual utility for each attribute is calculated, and then the demographics common amongst these clusters are highlighted so you can gain a better understanding of how different populations prefer your products.
Highlight a cluster in the top graph to learn more about this cluster. Click it to open the cluster details below.

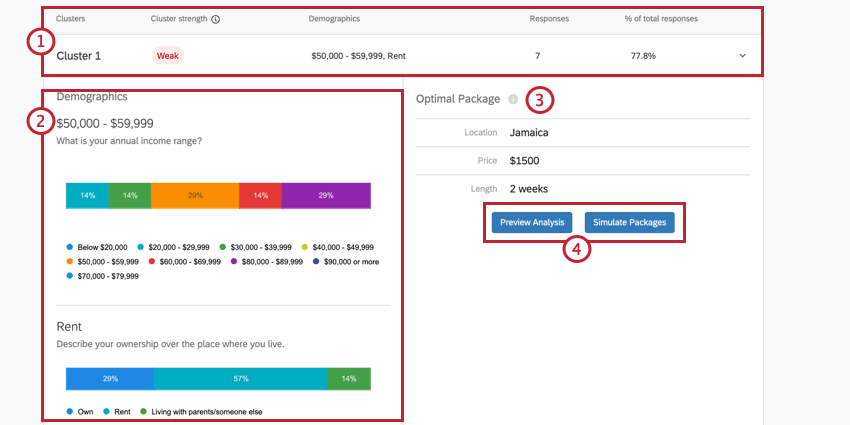
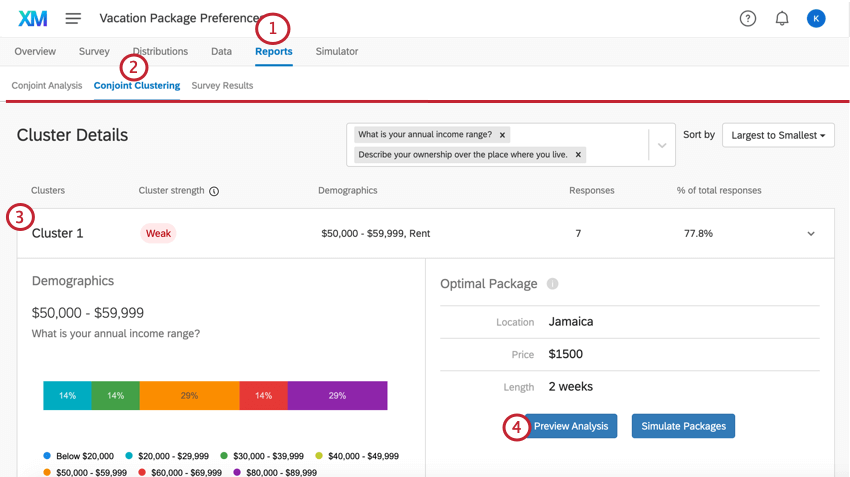
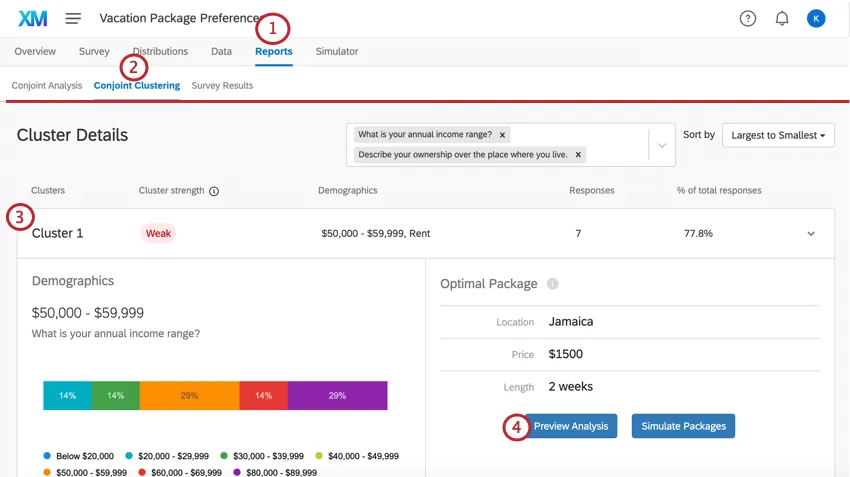
Cluster Details

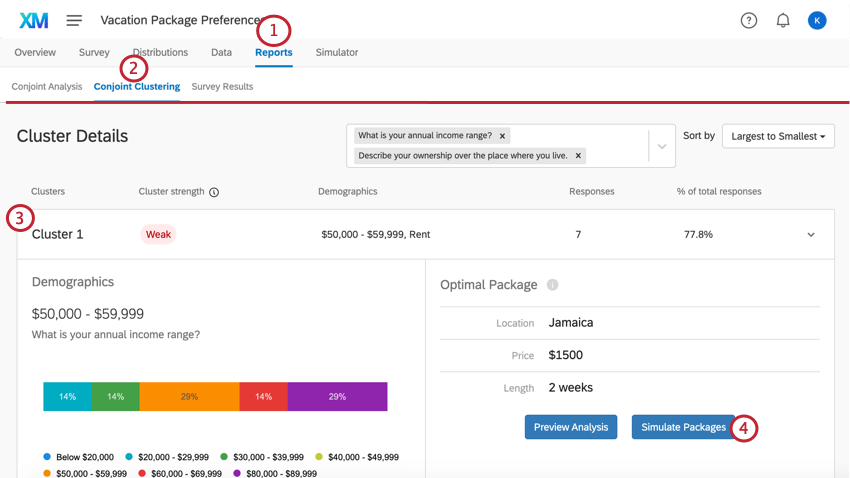
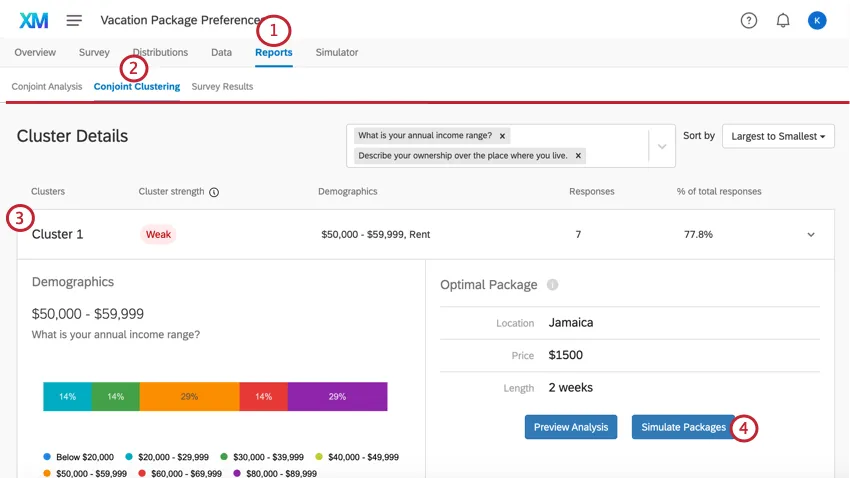
Example: In Cluster 1 pictured here, the responses tend to be from people making $50,000 to $59,999 a year, who rent apartments and are single. The cluster strength is weak, meaning the cluster is not statistically significant. 7 respondents generally fit this pattern, which is 77.8% of the entire dataset. This is a very small dataset, so decisions likely should not be made based on these results.
Example: Cluster 1’s preferred living arrangement is an apartment. However, apartments aren’t listed as the most common choice for this cluster. That’s because those who live in apartments are simply more likely to have chosen a vacation to Jamaica for 2 weeks at $1500 to be the best possible package than those in the cluster who have different living arrangements.
Qtip: Remember, the “Demographics” in these graphs are the non-conjoint questions you created in the Survey tab.
Determining Cluster Strength
Qualtrics uses a metric called silhouette scoring to determine the strength of each cluster. This score produces a value between 0 and 1 which determines how closely clustered the respondents are. We use the following table to convert from silhouette score to cluster strength:
| Correlation Score | Relationship Strength | Cluster Strength Label |
|---|---|---|
| 0.71 to 1.0 | Very strong relationship | Strong |
| 0.51 to 0.70 | Somewhat strong relationship | Somewhat strong |
| 0.26 to 0.50 | Somewhat weak relationship | Somewhat weak |
| 0 to 0.25 | No significant relationship | Weak |
Applying Clusters to Reports and the Simulator
Clusters can be applied to the Conjoint Results and the Simulator so that you can see more specific details about how respondents in this cluster evaluated the attributes presented to them.
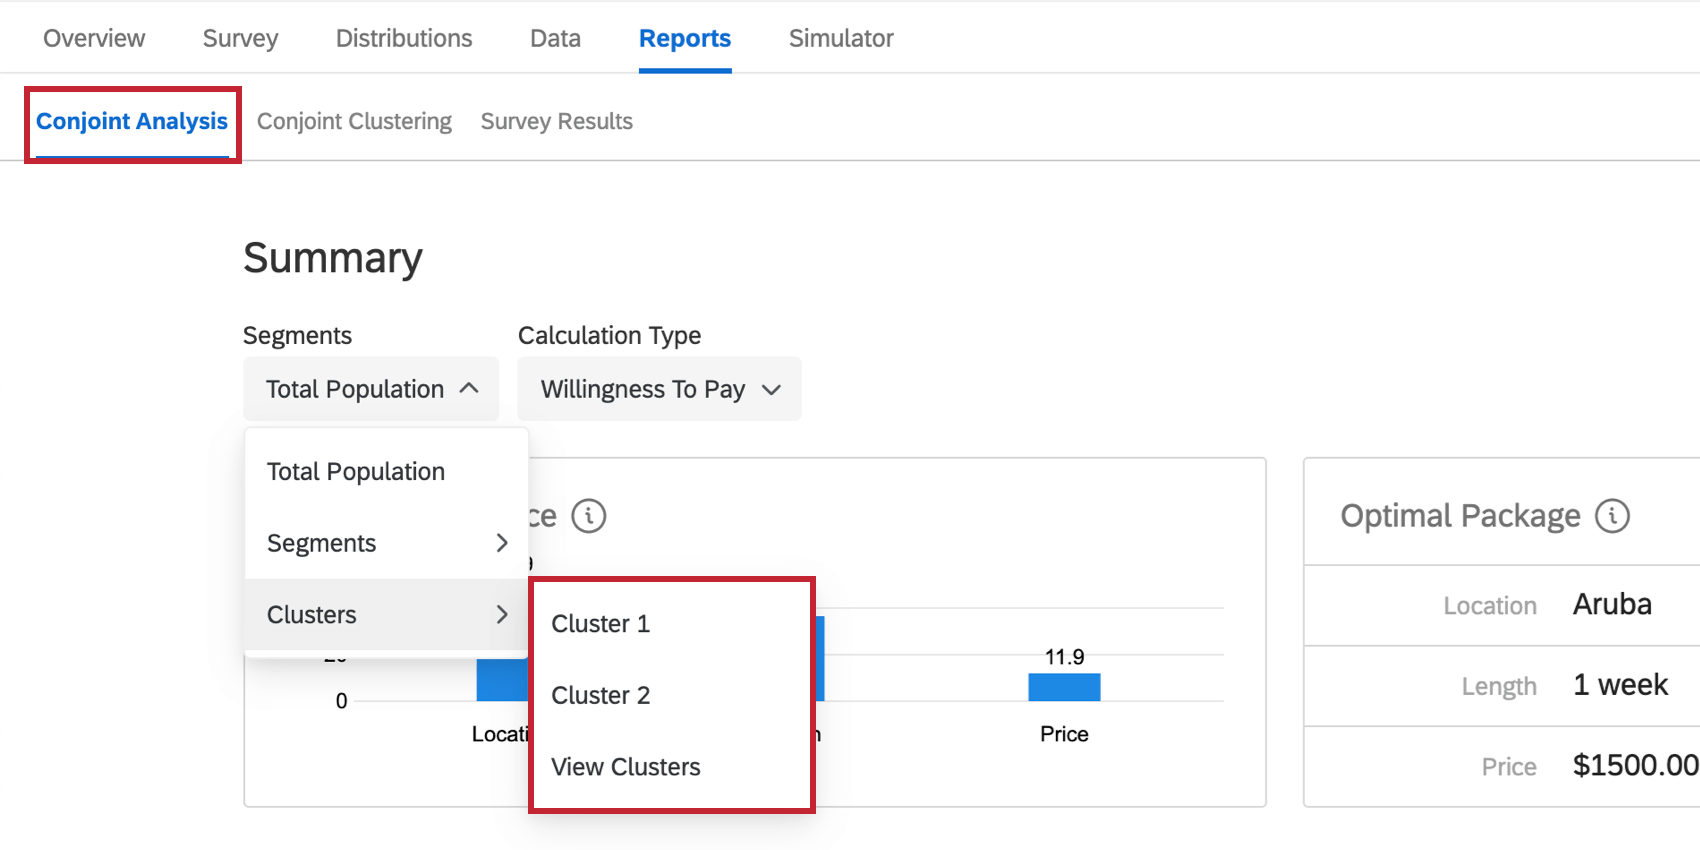
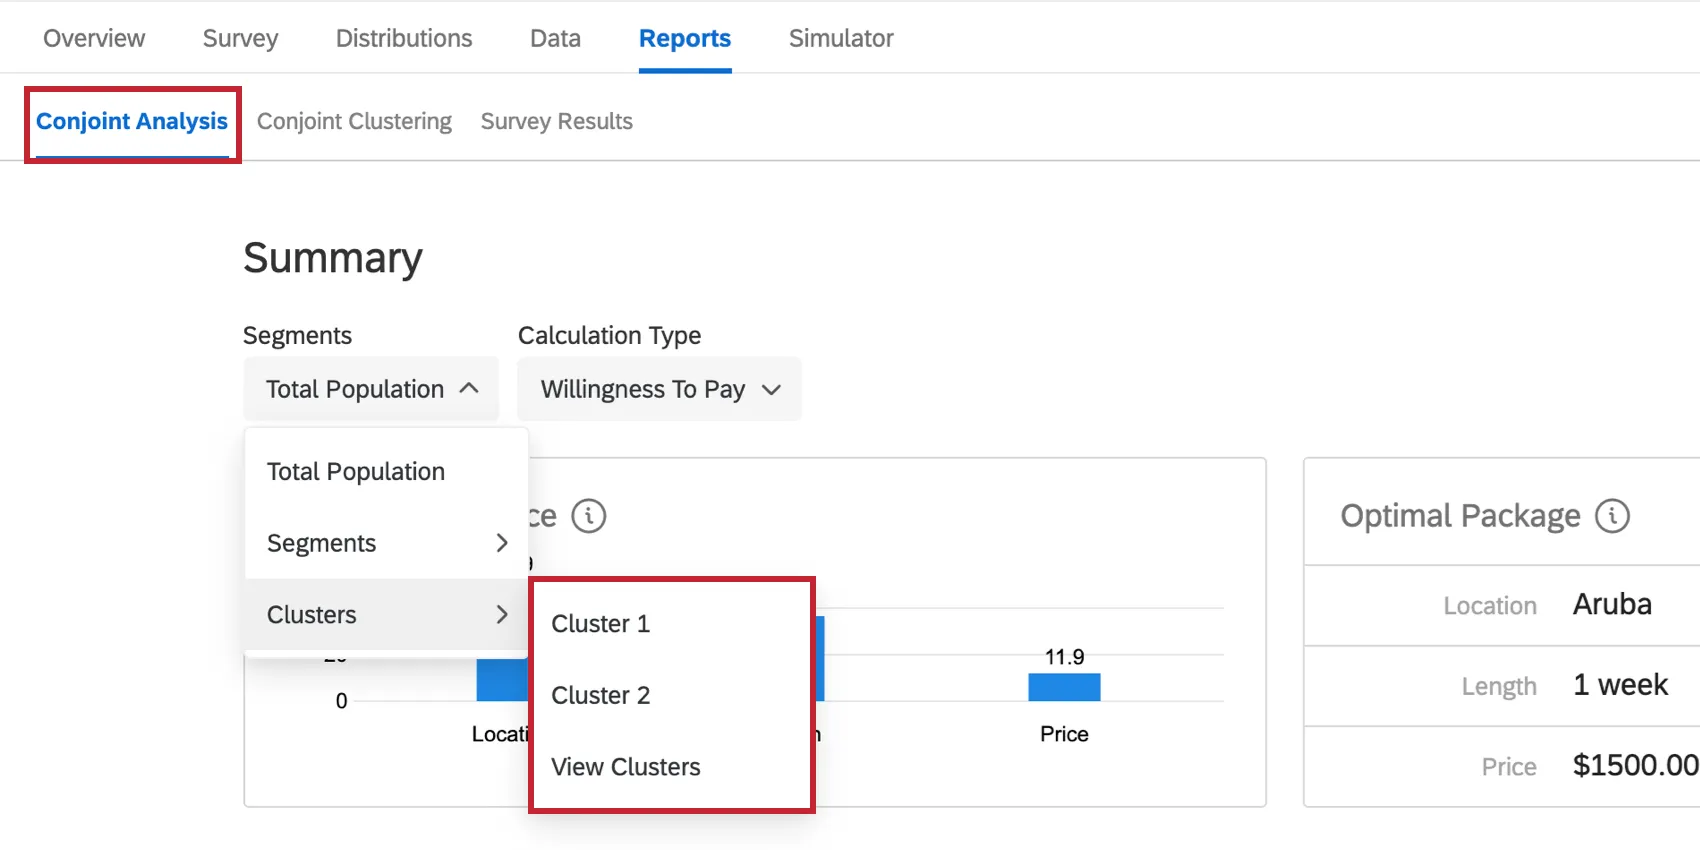
Conjoint Analysis Reports
While in the Conjoint Analysis section of the Reports tab, select a cluster from the dropdown in the upper-left.
You can also select Preview Analysis when you have a cluster selected in the Conjoint Clustering section of the Reports tab.
Simulator
Qtip: While you cannot share a simulator that only contains your cluster’s data, these clusters are available to those you’ve shared the simulator with. Colleagues are free to apply these clusters to the simulator at their own discretion.
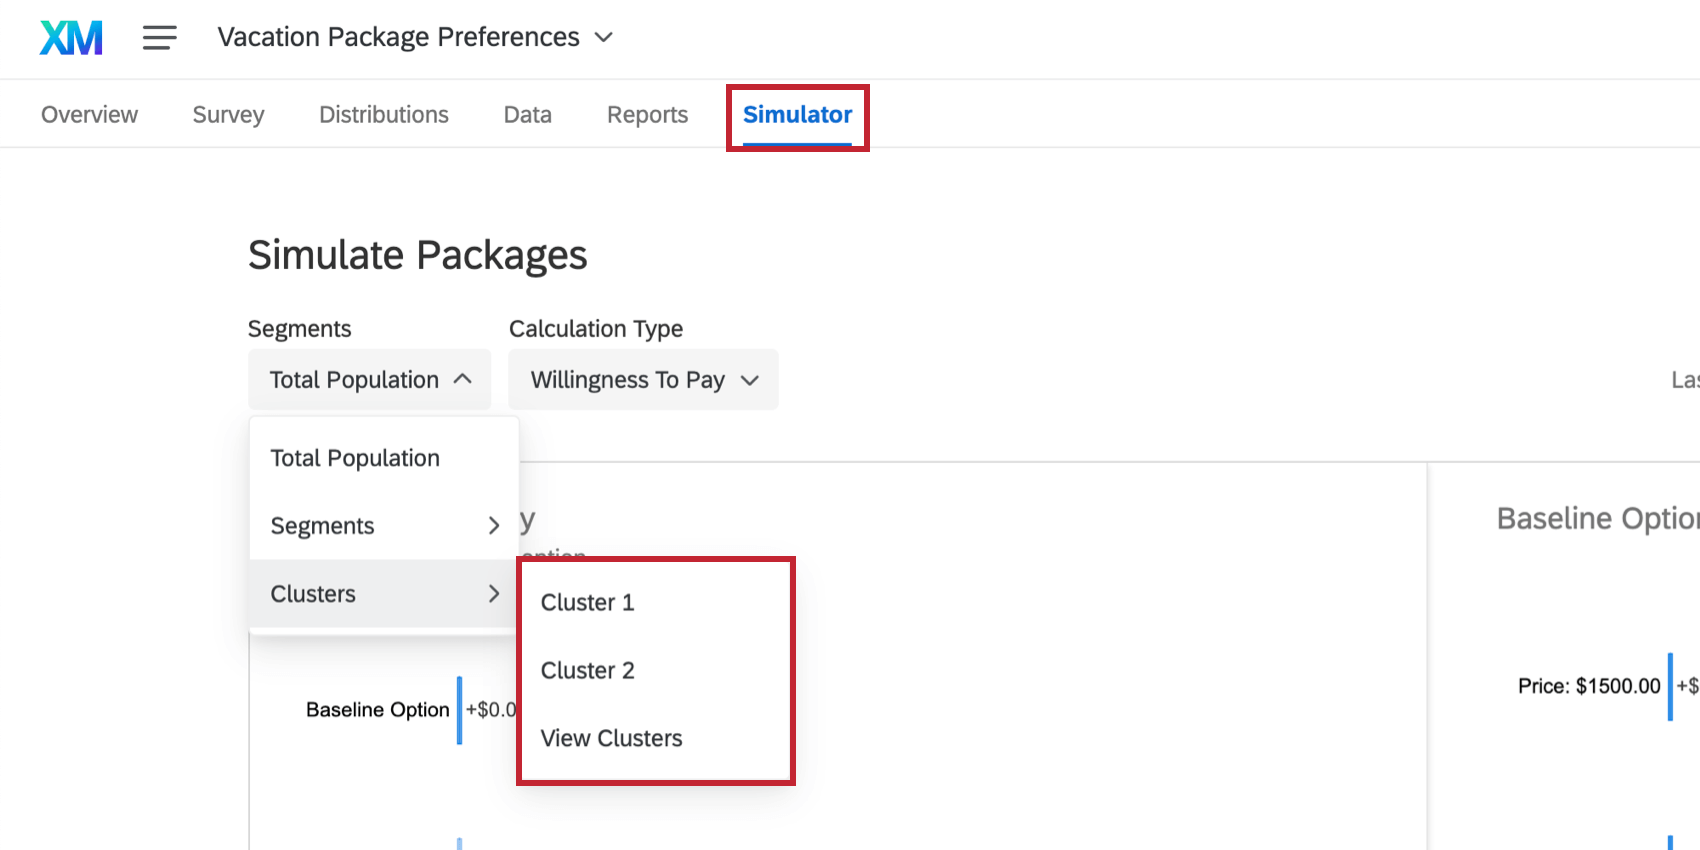
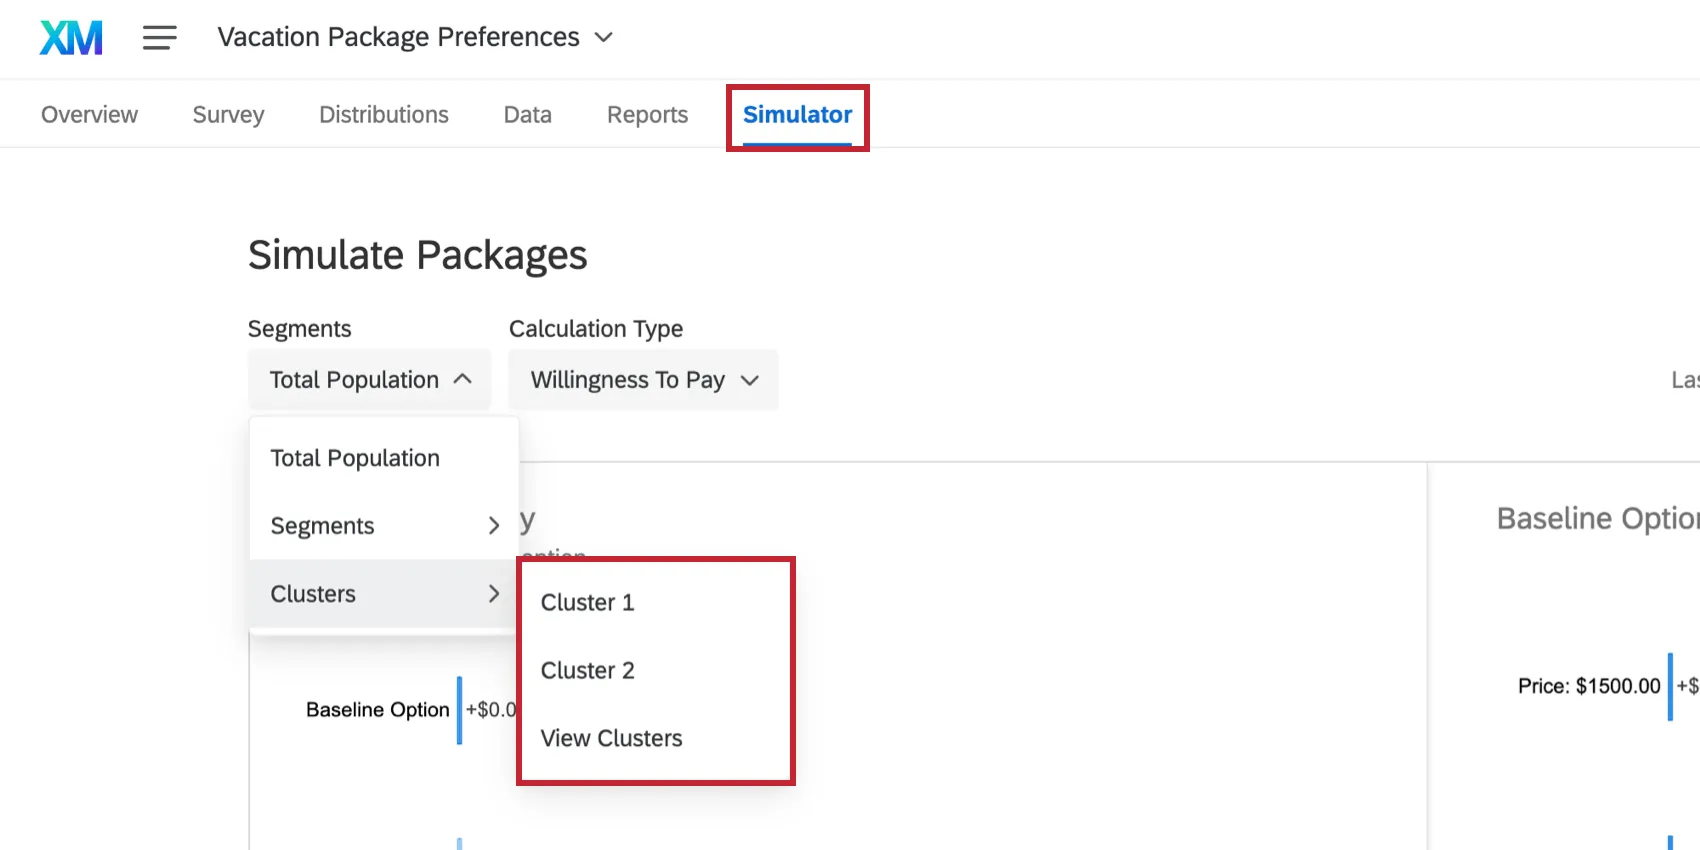
While in the Simulator tab, select a cluster from the dropdown in the upper-right.
You can also select Simulate Packages when you have a cluster selected in the Conjoint Clustering section of the Reports tab.
That's great! Thank you for your feedback!
Thank you for your feedback!