
MaxDiff TURF Simulator
What's on this page
About the MaxDiff TURF Simulator
The MaxDiff TURF simulator allows you to simulate how respondents would react to different packages. To learn more about TURF, how it is calculated, and how best to use this data, see the TURF Analysis support page.
By default, the simulator will show the optimal package as Option 1. The optimal package is the package that optimizes potential reach while keeping the number of features low. A random, contrasting option is presented as Option 2. However, it is important to adjust the simulator to get a better idea of the impact each package will have in comparison to each other.

Simulating Different Packages
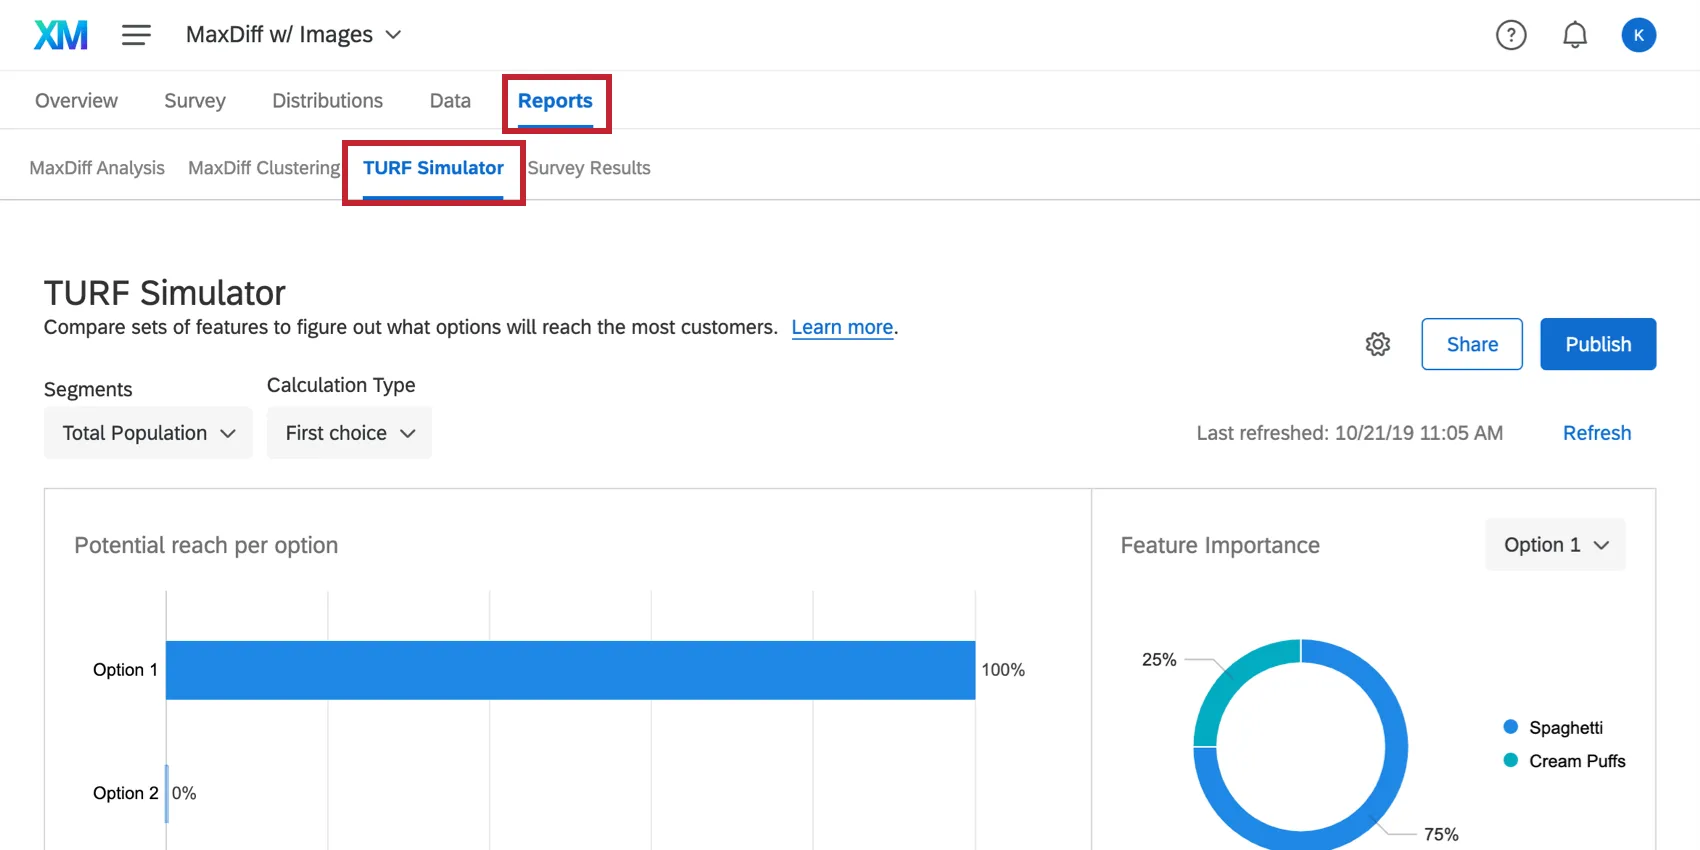
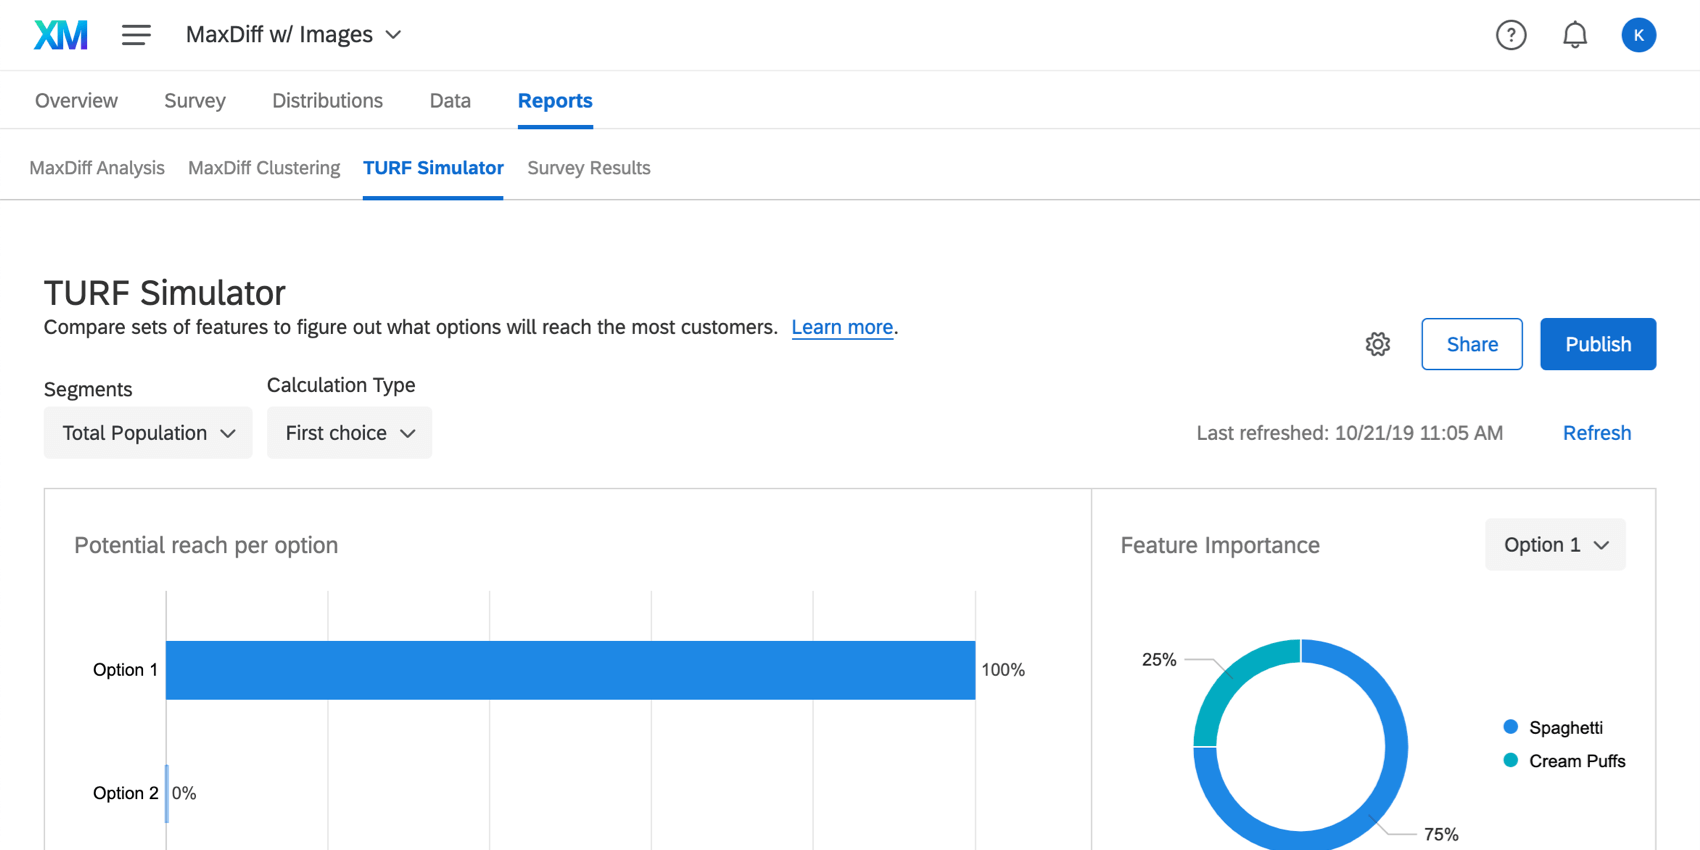
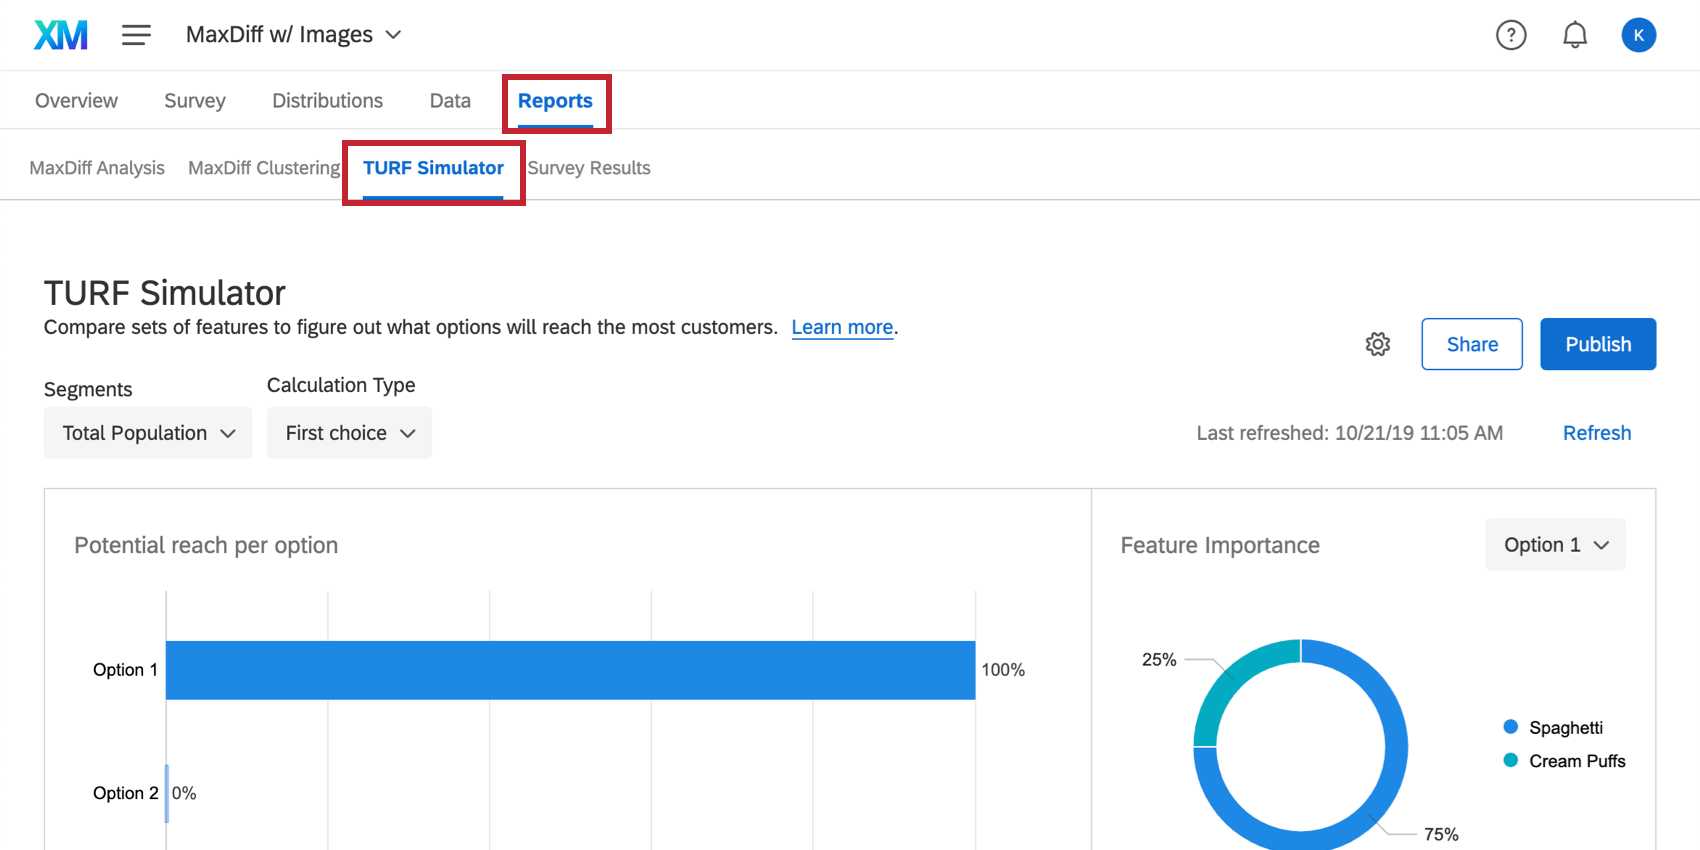
To access the simulator, go to the TURF Simulator section of the Reports tab.
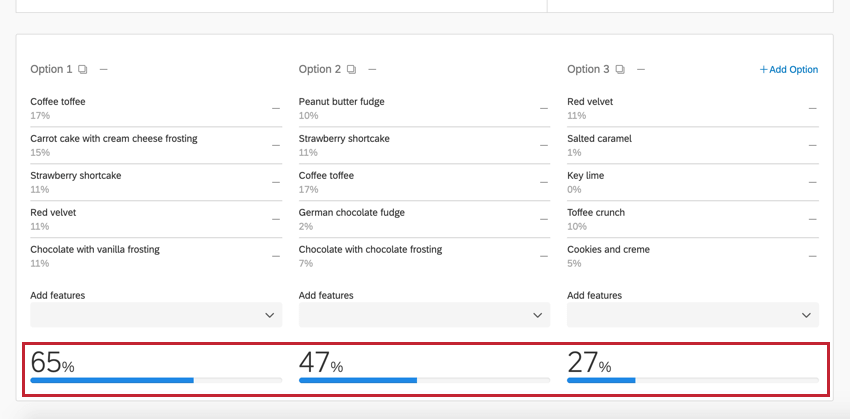
At the bottom of the page, you’ll find the different packages the simulator has constructed.
In order to get the most out of your simulator, you will want to adjust the packages and see how the Potential reach per option adjusts. Packages with higher potential reach per option are more favorable. The greater the contrast the features available between Option 1 and 2, the better.
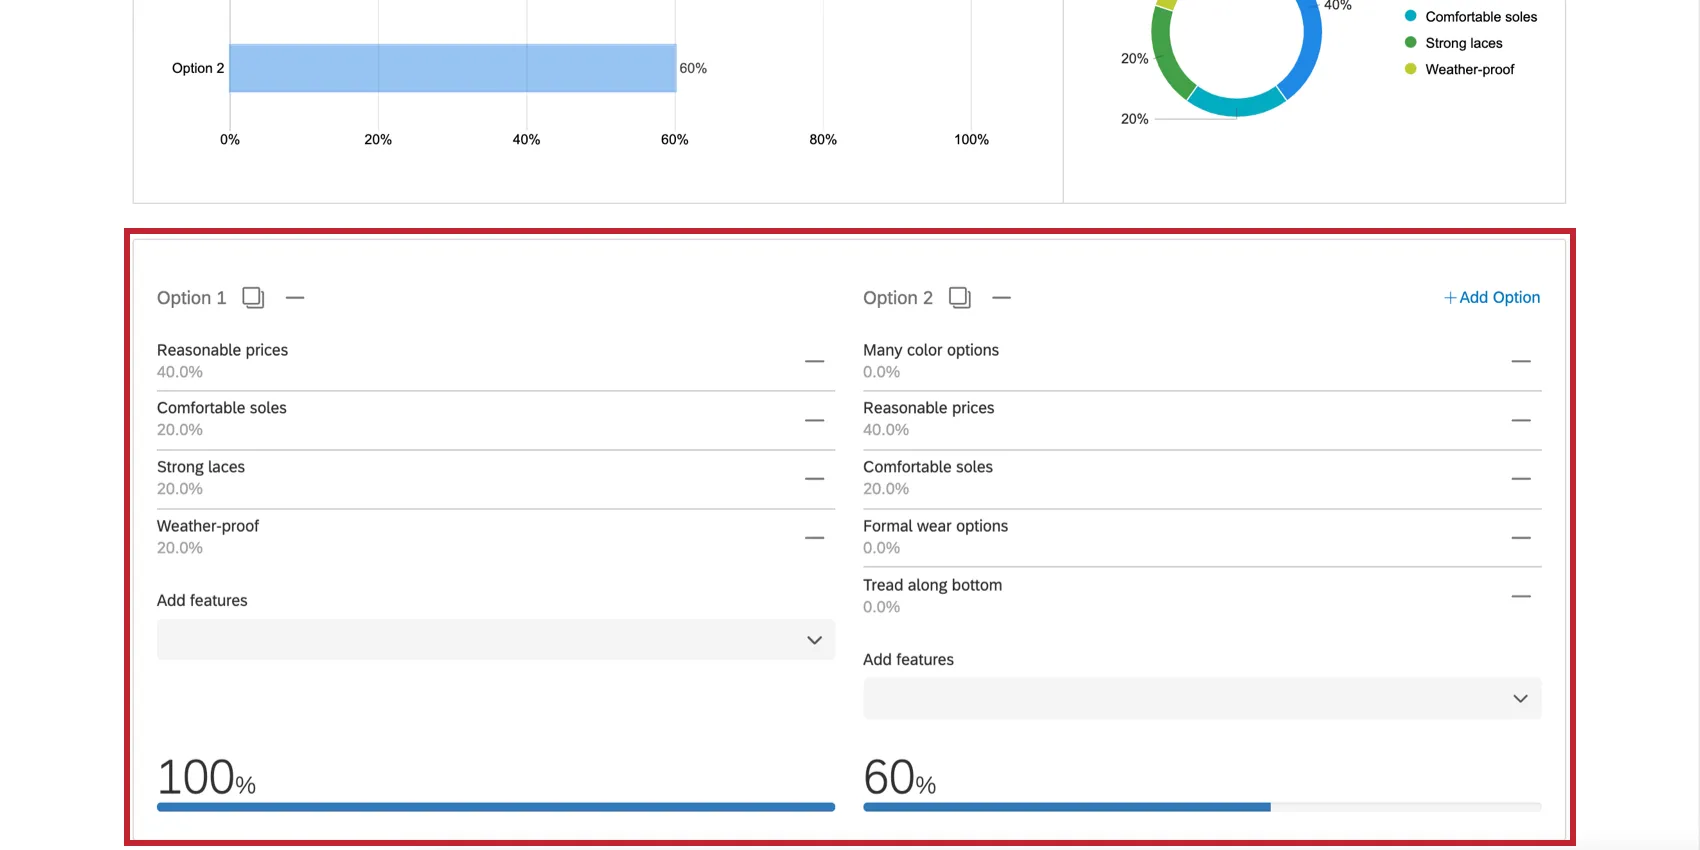
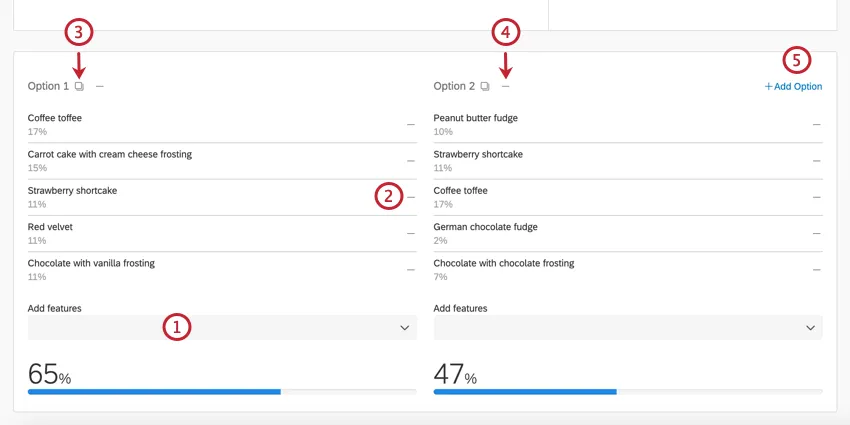
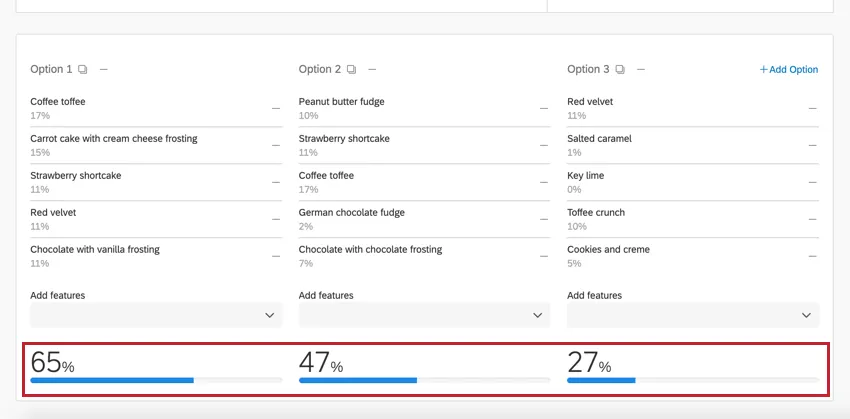
Adjusting Packages
You can adjust the packages to see different feature offerings against each other and how these offerings are predicted to perform with your respondents.
Qtip: The order in which you add features to a package can affect the breakdown of the reach of each feature. This is because we consider a person as “reached” by the first feature in the package that appeals to them. However, the order of features does not affect the overall reach of the package.
Qtip: You can compare a maximum of 8 packages against each other.
Qtip: Refreshing the page or leaving and coming back will revert the simulator back to the default settings. In addition, changes you make to the simulator will not change what it will look like when you share it with someone.
As you make adjustments to what’s included in each option, the percentage below each option will change. This percentage is called the Potential reach per option and is explained more in the next section.
Potential Reach Per Option and Feature Importance
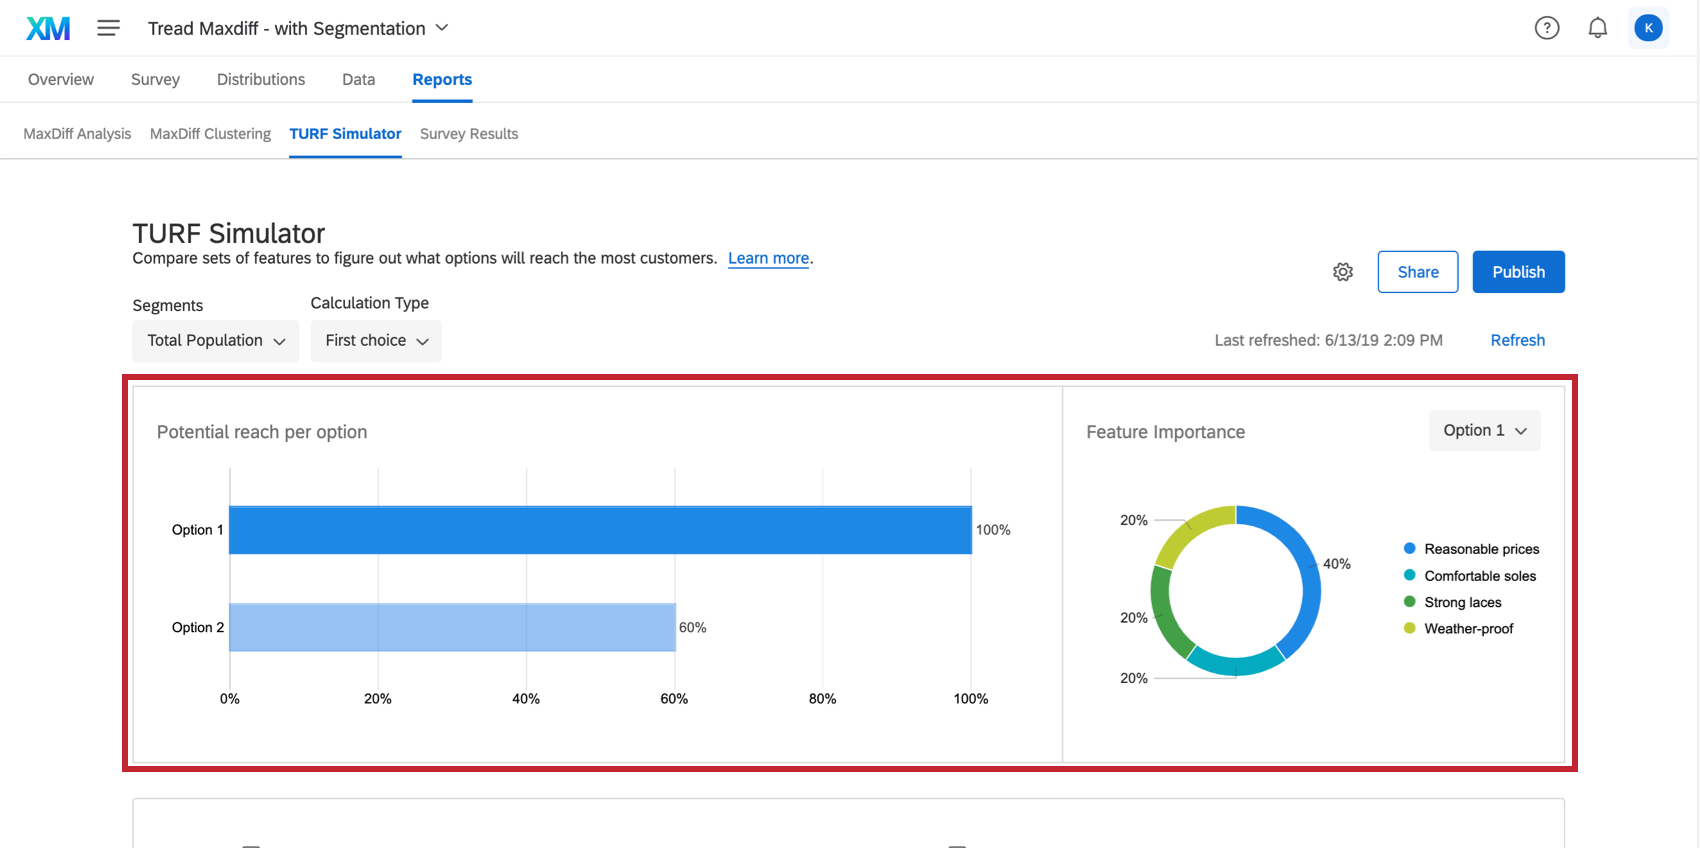
The graphs at the top of the simulator display 2 key measurements: Potential Reach Per Option and Feature Importance.
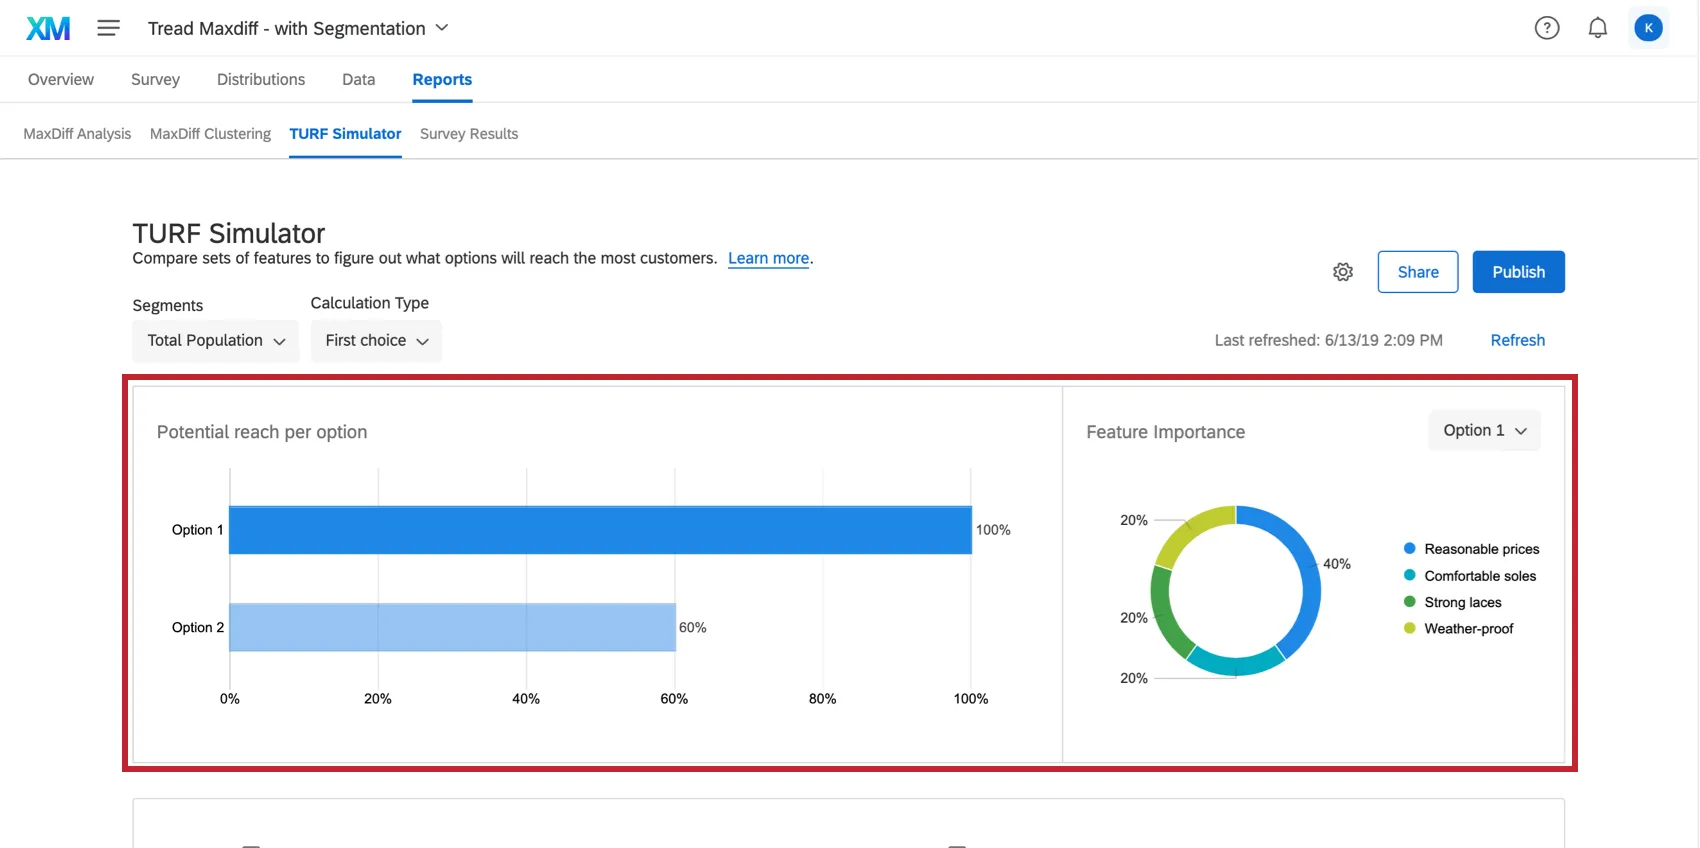
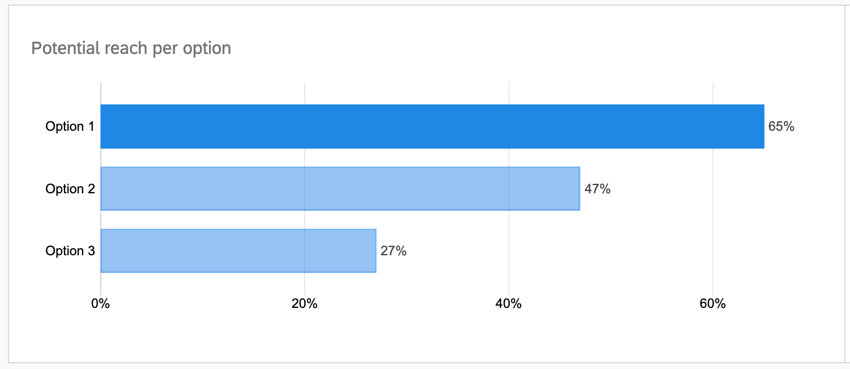
Potential Reach Per Option

Potential reach per option is the predicted percentage of your respondents who will respond positively to a package. The better performing a package will be for your respondents, the higher its potential reach per option will be, and thus the larger its bar will be in the chart. A package with a potential reach per option will appeal to more respondents than a package with lower preference share.
Qtip: Your packages’ potential reach per option will not add up to one hundred percent. This is because some respondents may react to both packages positively, while other respondents may react to one positively and one negatively.
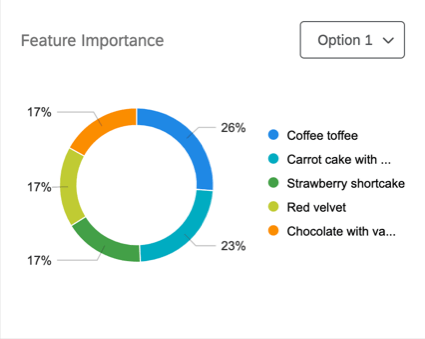
Feature Importance
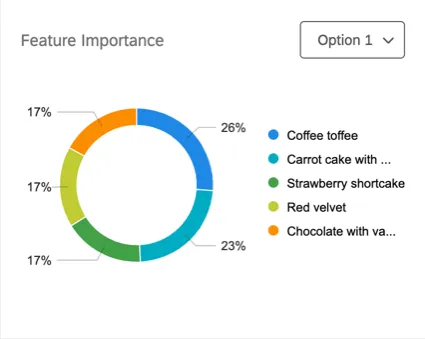
Feature Importance is the amount of potential reach being contributed by each of the individual features. The greater the feature importance score is for an option, the more it added to the option’s potential reach in comparison to the other features.
Qtip: You can change which option you’re analyzing by either clicking the dropdown menu in the feature importance graph or by clicking on the option in the bar chart.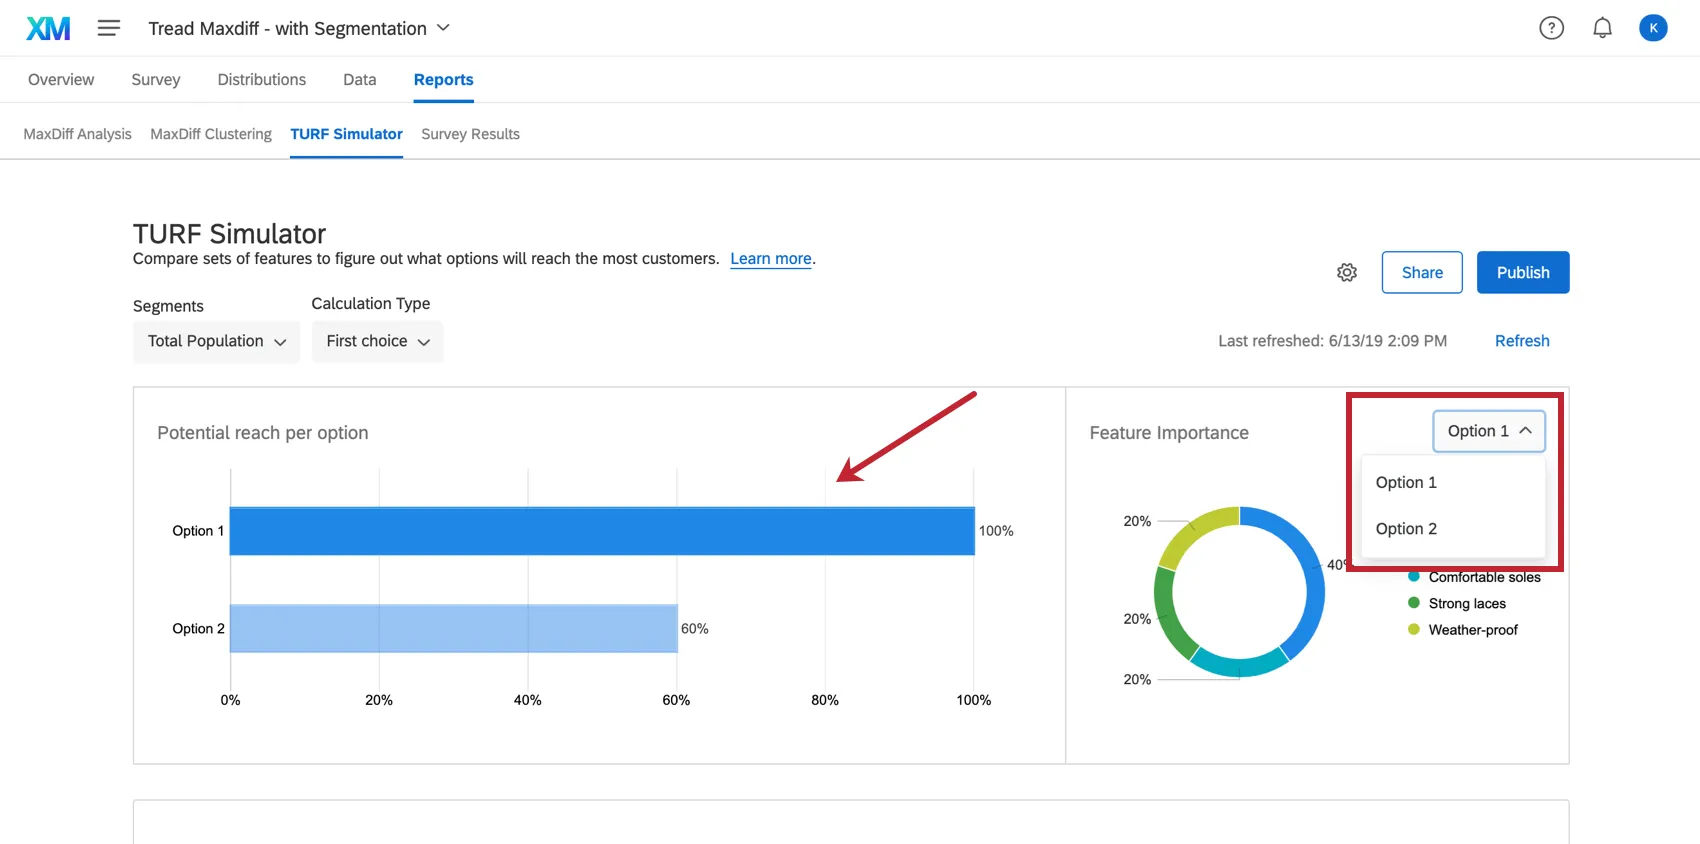

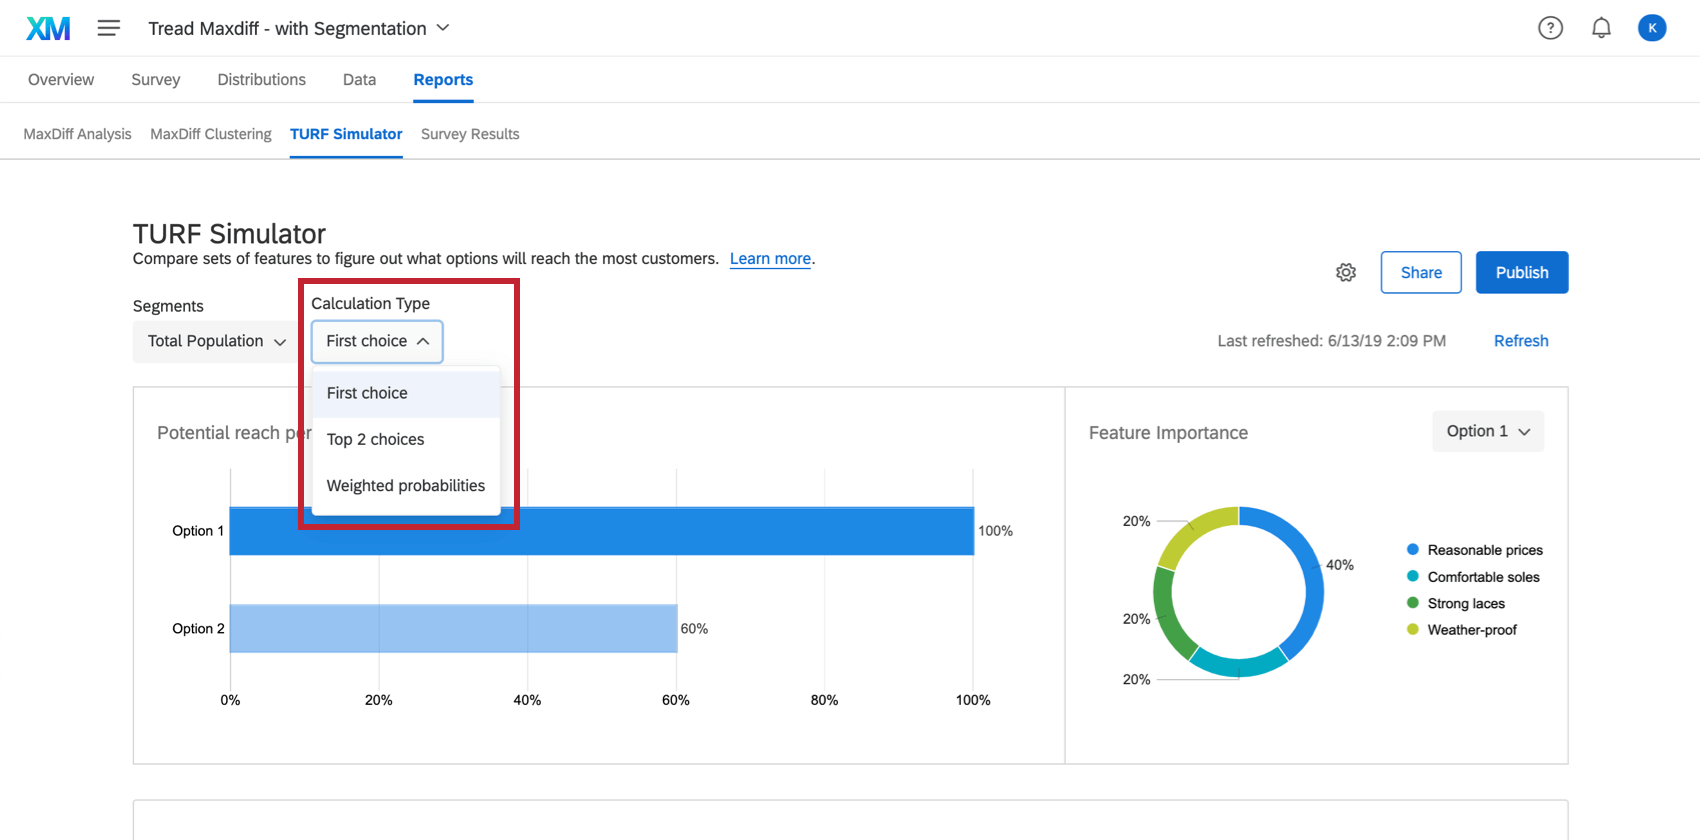
Calculation Types
You can change the calculation your TURF Analysis performs on your data using the Calculation Type dropdown menu.

- First Choice: This method is calculated by looping through each package combination and deriving the percentage of the sample that is reached. The researcher can define if being “reached” means that the item has to be a respondent’s top overall choice or preference.
- Top 2 Choices: This method is calculated by looping through each package combination and deriving the percentage of the sample that is reached. The researcher can define if being “reached” means that the item has to be in the respondent’s top 2 overall choices or preferences.
- Weighted Probabilities: This method incorporates the principles of the multinomial logit modeling used to derive the MaxDiff utility preferences. It calculates the probability that a combination of items would be selected as most preferred, weighted by the item’s preference share.
Qtip: If the features in the maxdiff are purchased as a bundle, we recommend using the weighted probabilities calculation as it incorporates the preference for each of the features in the bundle. If you are evaluating a single feature for purchase, we recommend selecting first choice or top 2 choices calculations. We recommend using the first choice calculation for very discerning use cases and the top 2 choices calculation for more flexible use cases.
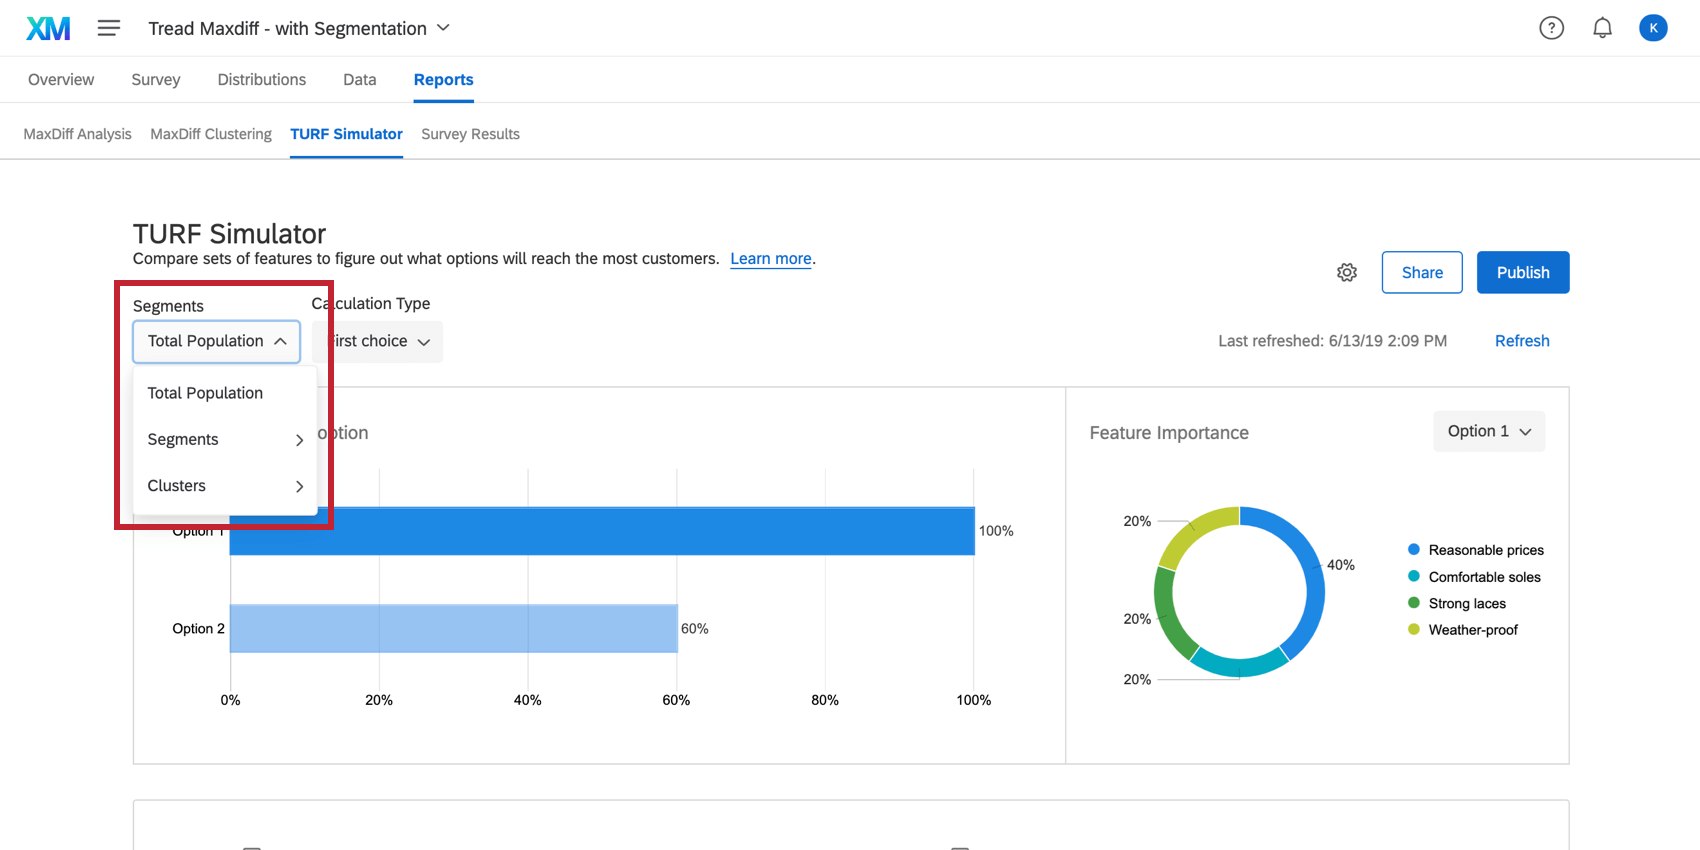
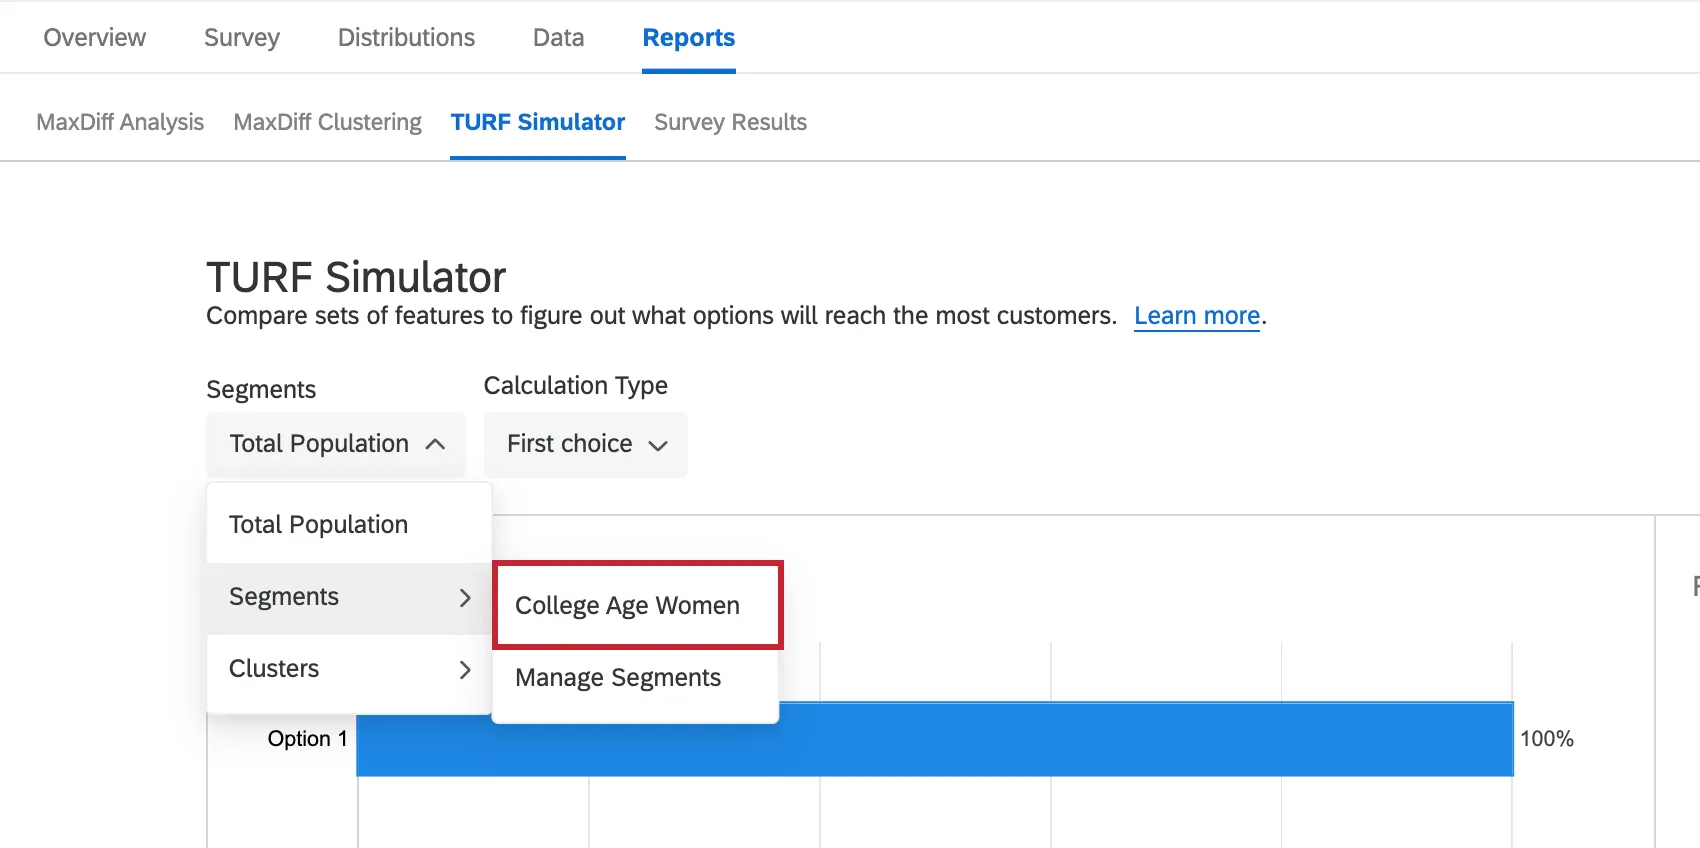
Segments
Segments are used to analyze how different groups of people respond to different package preferences, allowing you to optimize package for specific populations of respondents. These different groups are available through the Segments dropdown menu.
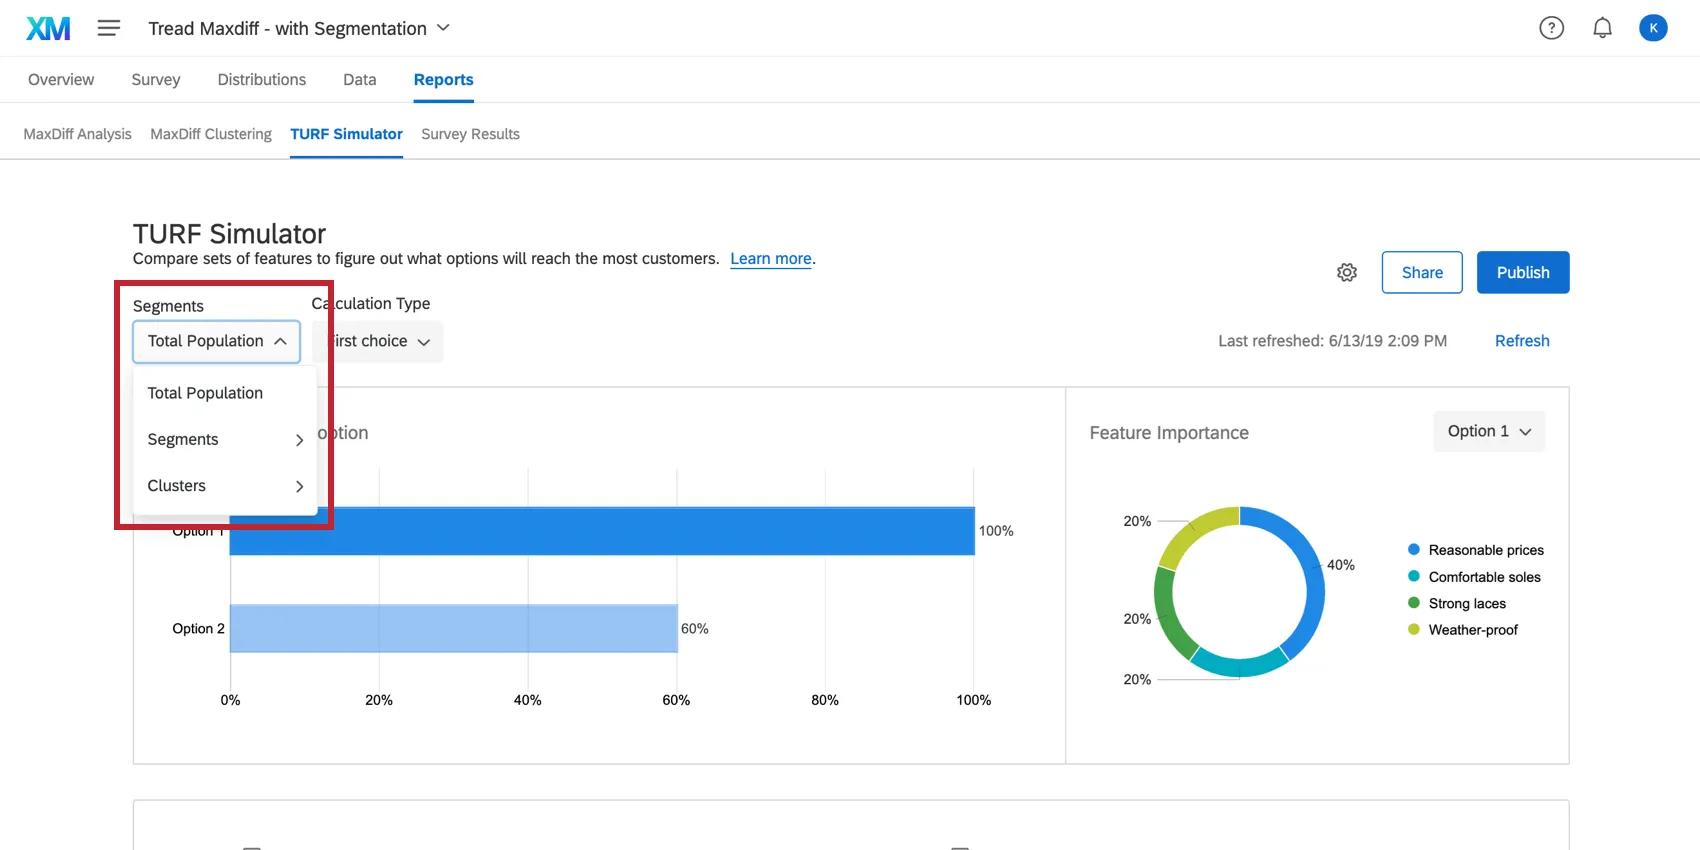
- Total Population: This analyzes the entire dataset together and does not account for specific populations of respondents.
- Segments: This option allows you to build your own segmentation categories. For example, you could ask a NPS question in your survey and then analyze the data for all respondents who are neutral. More information on creating segments is below.
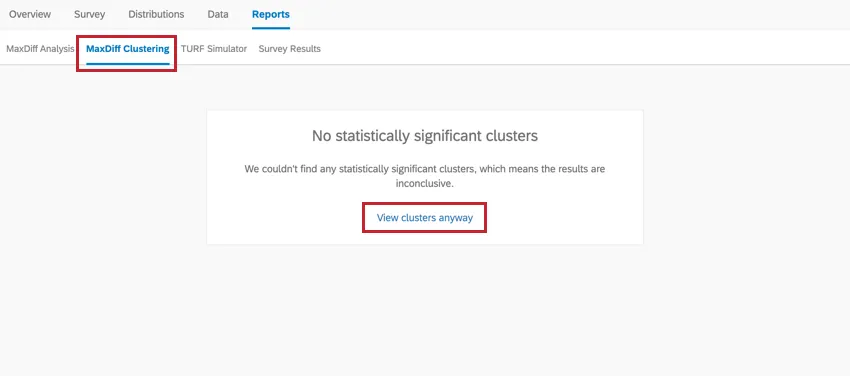
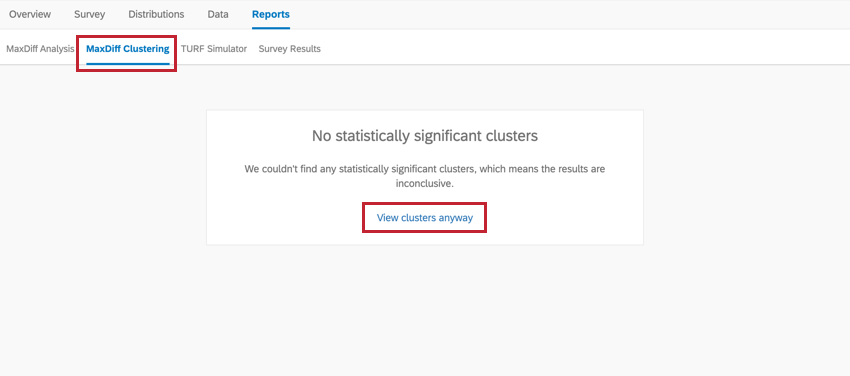
- Clusters: This option allows you to analyze based on your MaxDiff clustering. Qtip: By default, statistically insignificant clusters will not appear as an option since they are not recommended for use in analysis. However, you can enable them by going to your MaxDiff clusters and clicking view clusters anyway.

Creating Segments
In your TURF simulator:
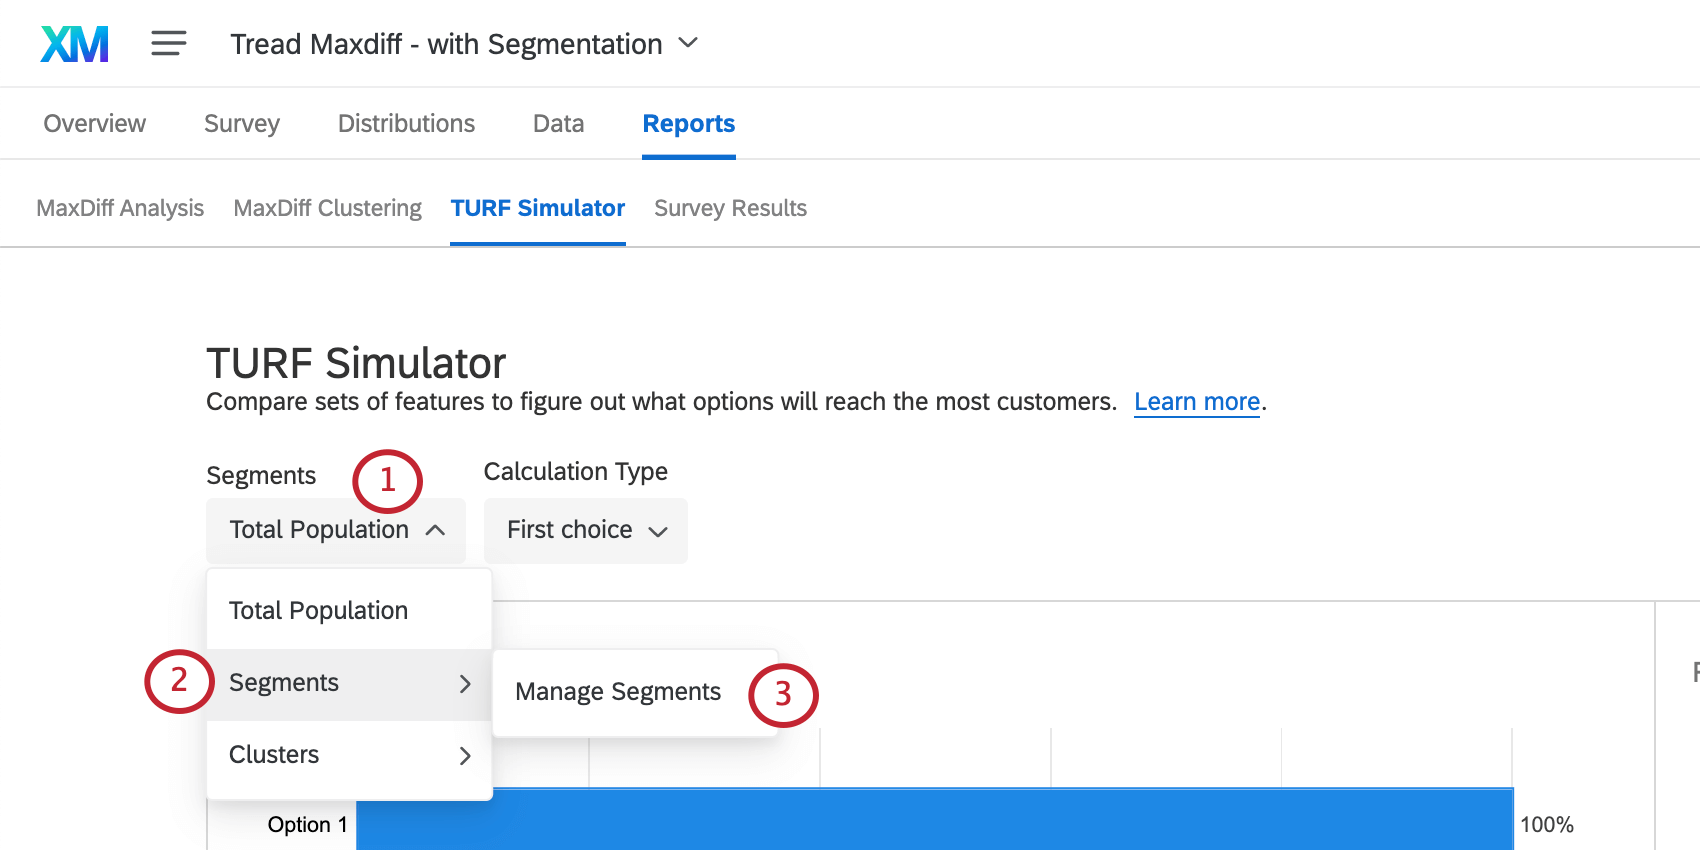
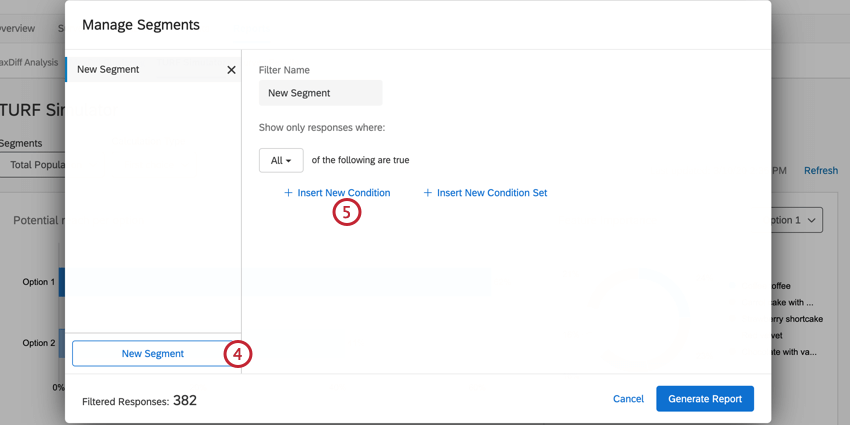
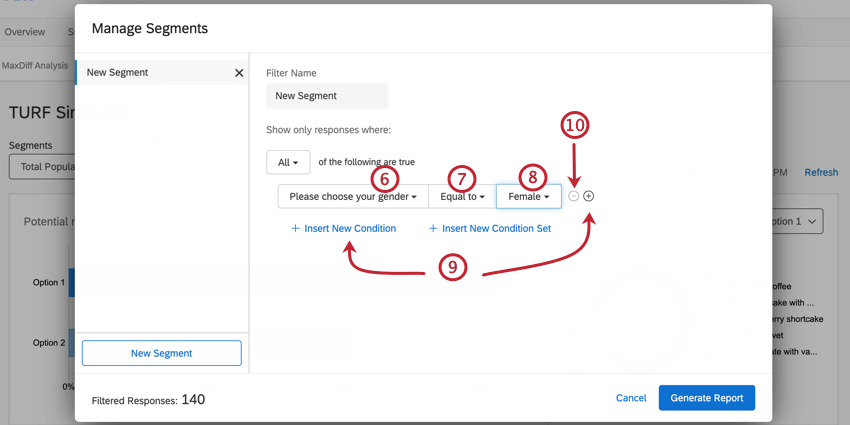
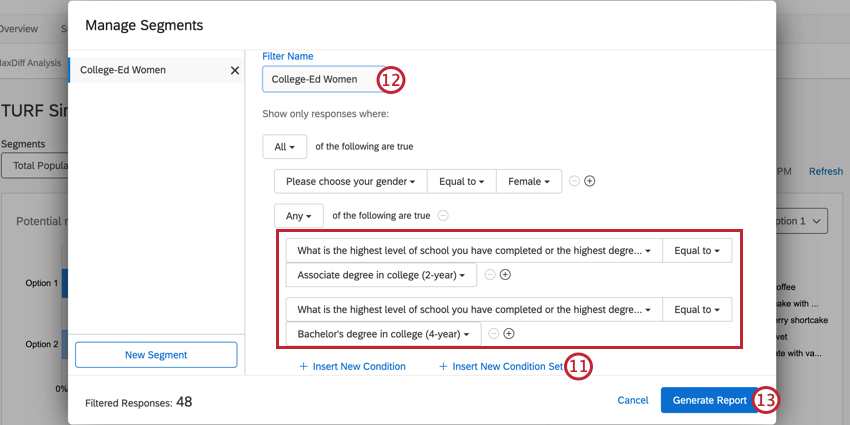
Now that your segment has been created, you can select it from the Segments dropdown menu.
Refreshing the Simulator
When you visit the simulator after new data has been collected, a yellow banner will alert you that New responses have been collected since you last refreshed your report. This means the data you see may be from a previous batch of responses. This banner can be temporarily closed, but if you leave the page and come back without any data refreshes having taken place, it’ll pop up again.
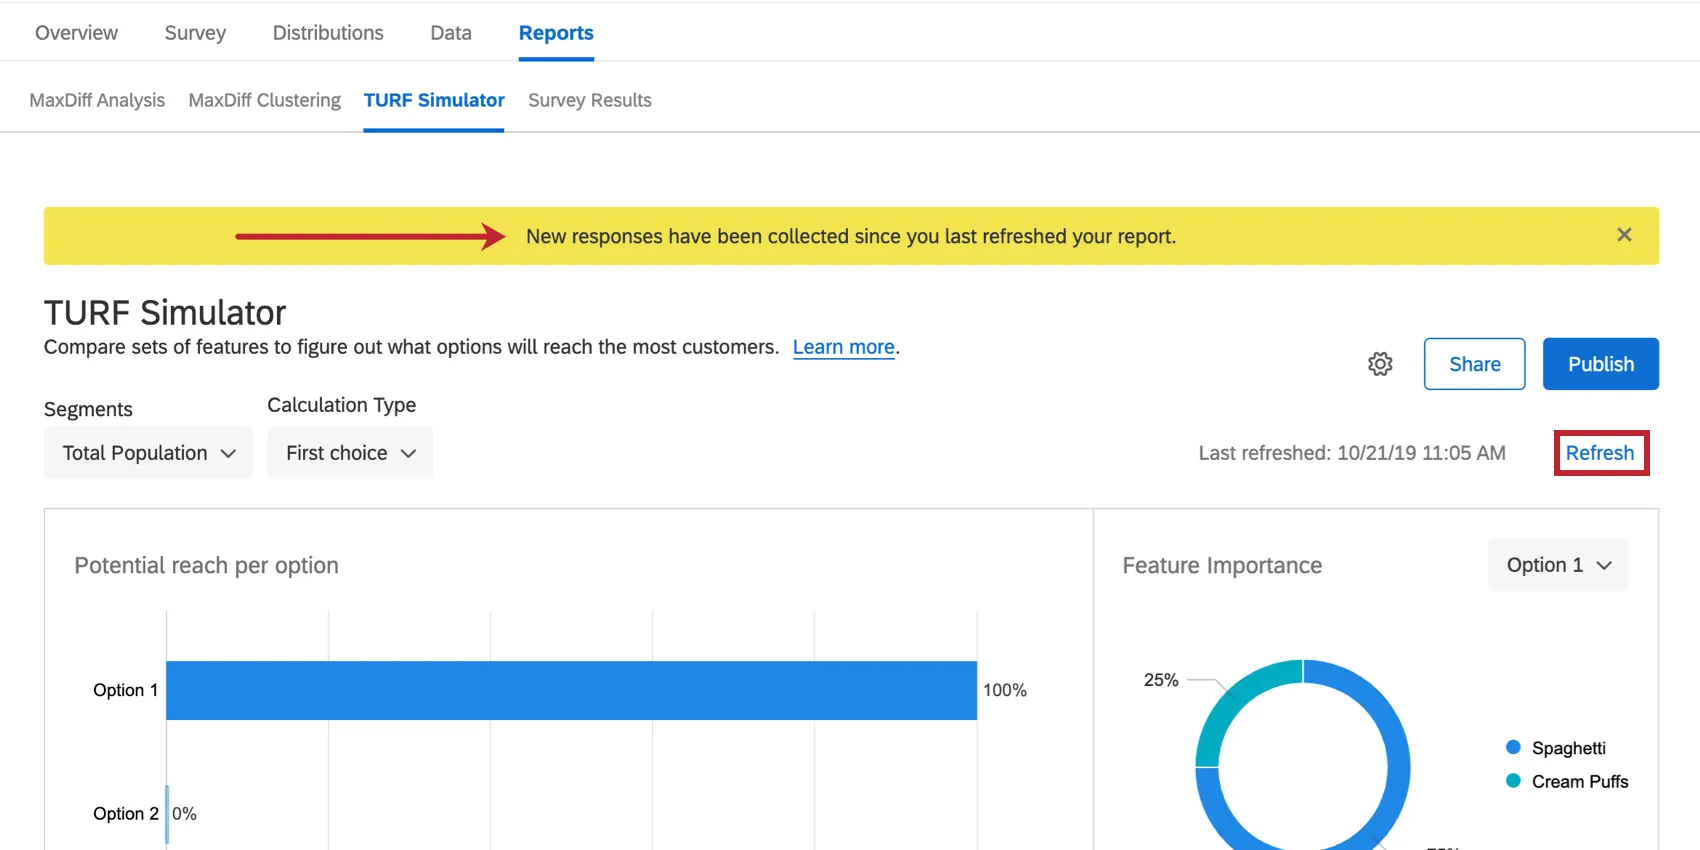
If you would like to manually refresh and force the report to update, click Refresh in blue on the upper-right.
The simulator automatically refreshes every hour. To the left of the refresh button, it will tell you when the data was last refreshed.
That's great! Thank you for your feedback!
Thank you for your feedback!