
Creating & Applying Weights
What's on this page
About Creating and Applying Weights
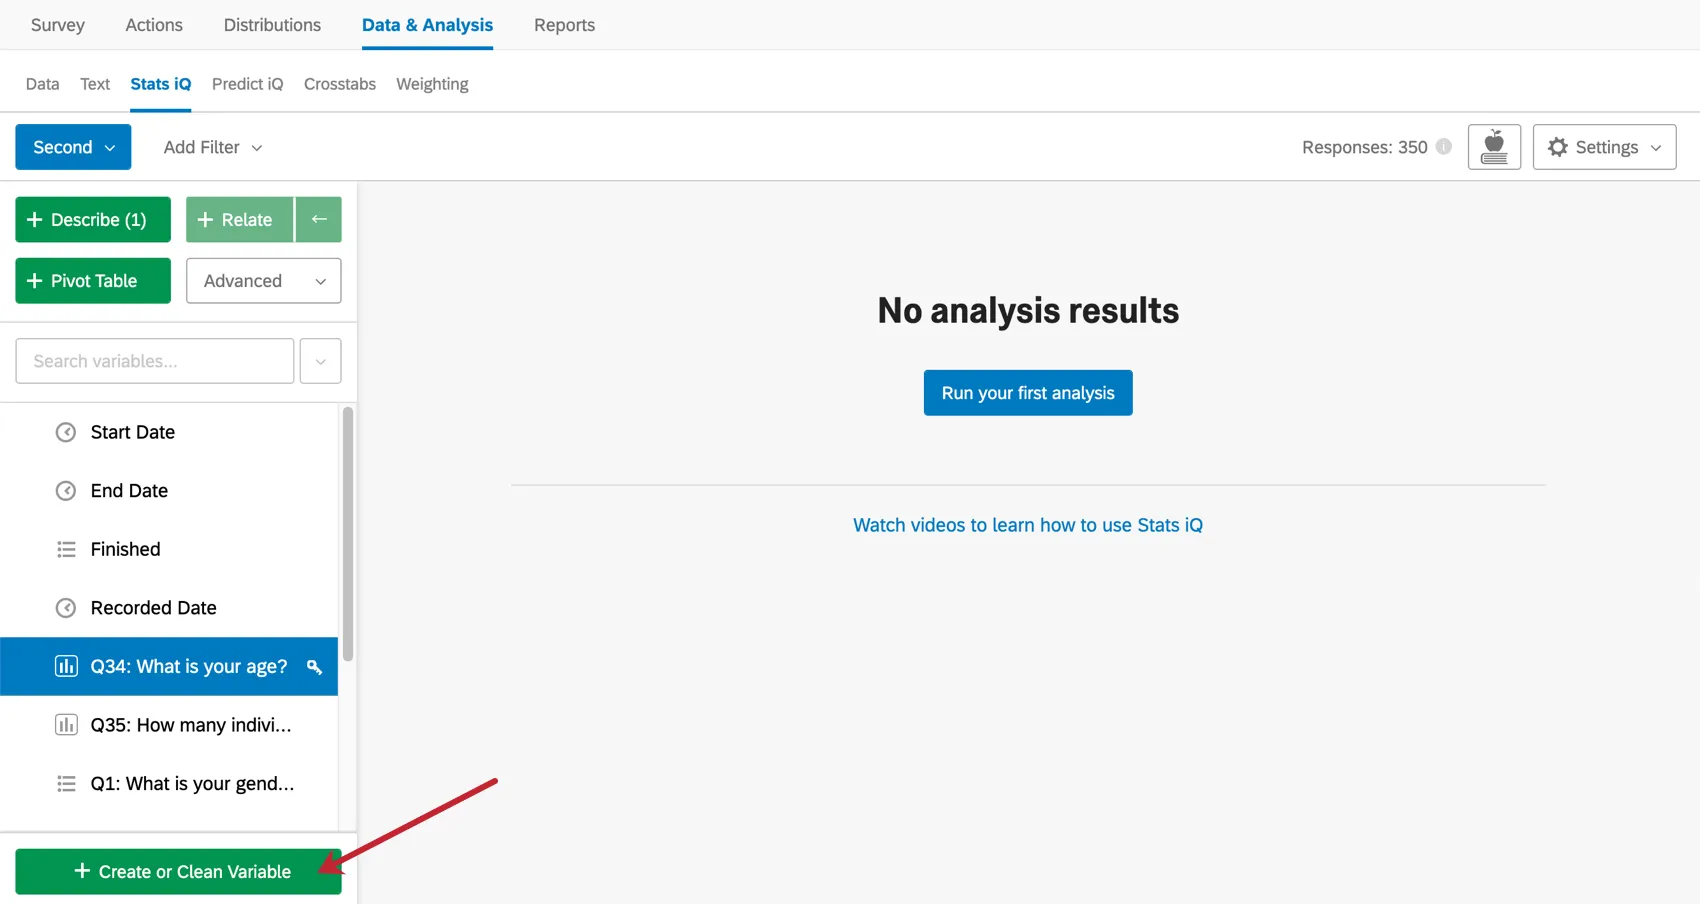
Stats iQ allows users to apply weights so that if certain types of survey respondents are under or overrepresented, Stats iQ can be told that one row of data should count for more or less than a single response. To enable weights, your data must have a variable that contains the desired weights. This variable can be added by using the Create Variable option in the lower-left corner.
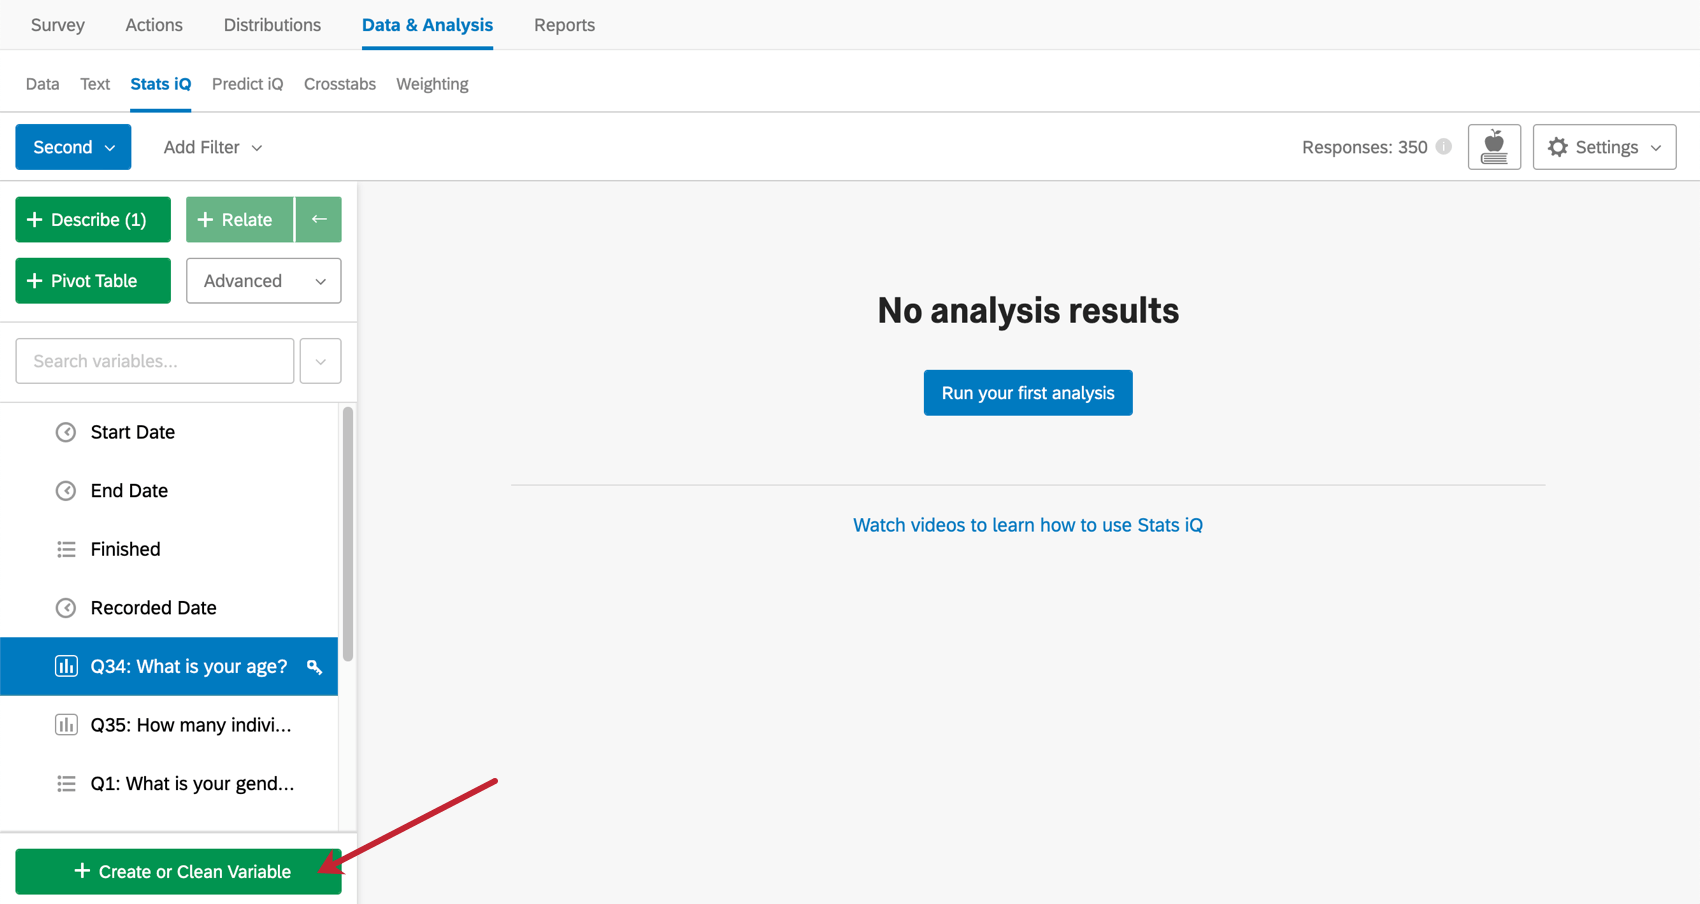
Qtip: You can also create a variable that contains your desired weights by exporting your data, adding the column, and reimporting (see the Import Responses page), however, we recommend using the Create Variable option when possible.
Create a Weighting Variable
Qtip: Weighting variables are most helpful for users working out of imported data projects or those without access to the Weighting section of Data & Analysis. If you have a Weighting section, we advise using that functionality instead.
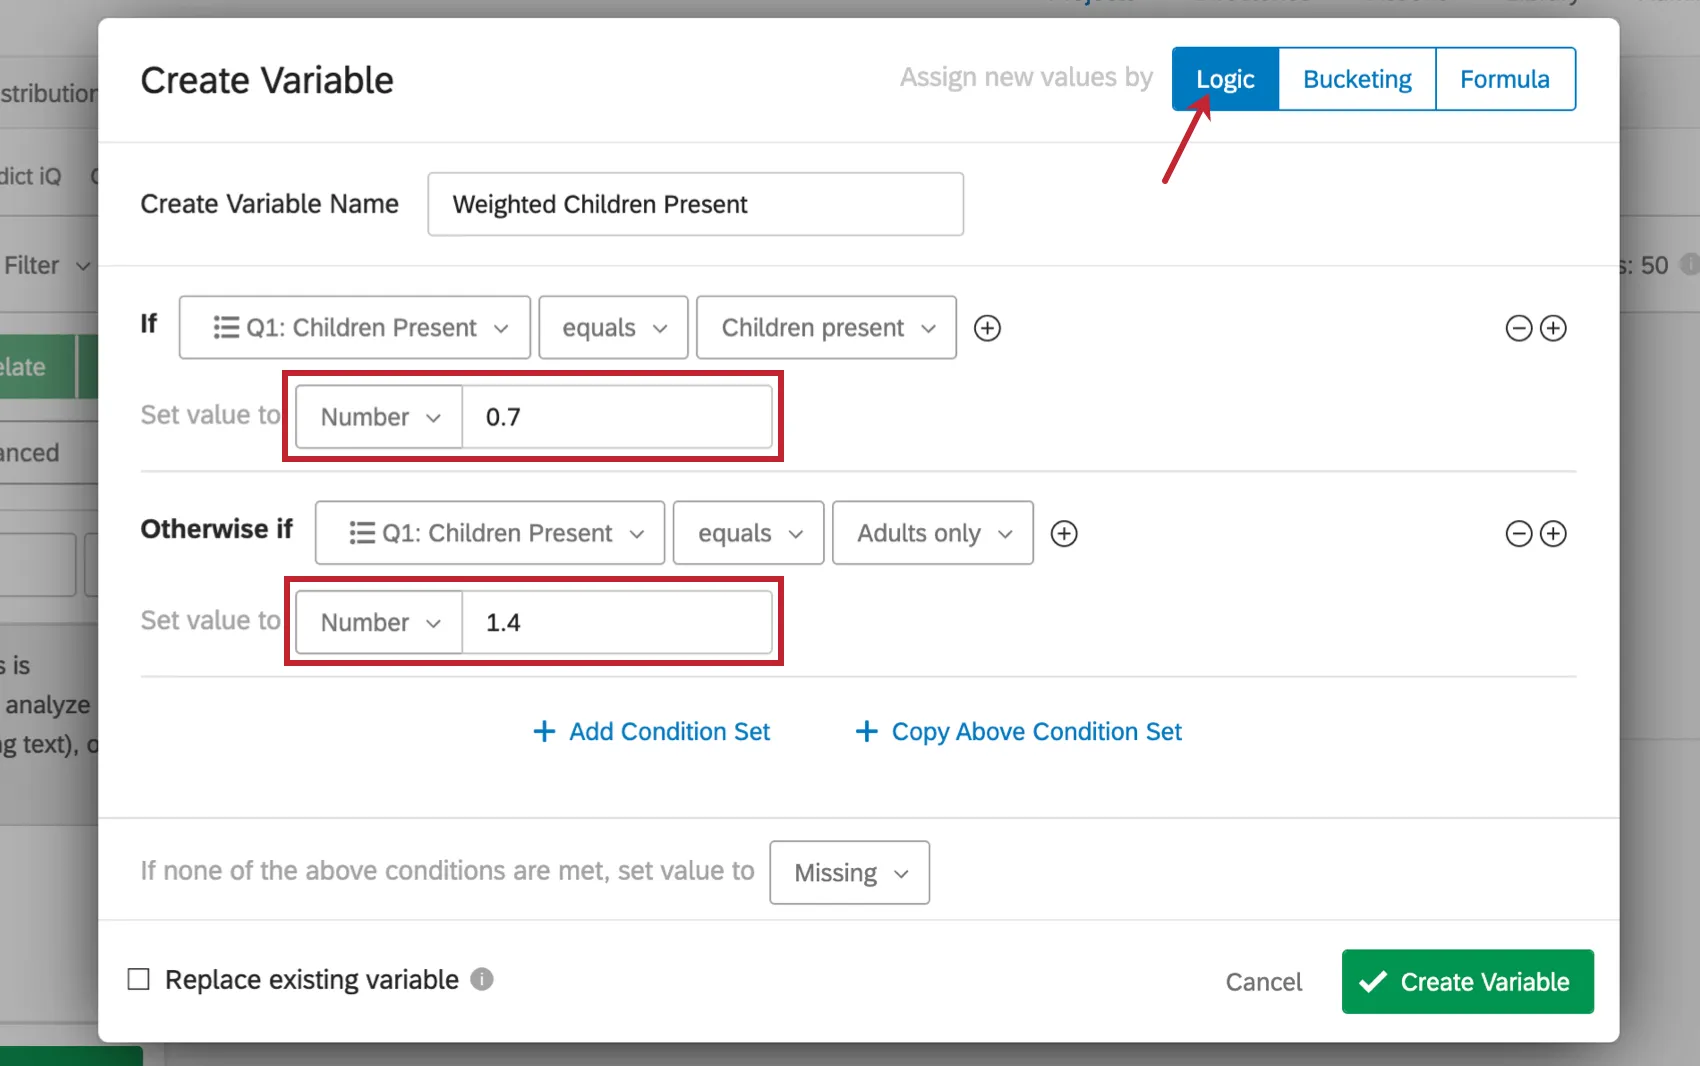
Any numerical variable from the dataset can be used as a weight, but in many cases, the necessary weights needed cannot be determined until after the data is collected. In this case a weighting variable must be manually created. The most common method for creating a weighted variable is to use the Logic option in the Create Variable menu (for more information on creating variables in Stats iQ, see the page on Variable Creation).
Under Logic, specify the numerical weight and the condition under which the weighting should apply. For example, if you had more responses to a hotel satisfaction survey from families with children than families without children, but you know the true split should be 50/50, a weight could be applied to the data to adjust the percentage of “Children Present” responses down and the percentage of “Adults Only” responses up.
Apply a Weighting Variable to the Dataset
Once a weighting variable exists in the dataset, the weights from this variable can be applied using the Weighting dropdown in the Analysis Settings menu. For more information on the Analysis Settings menu, see the page on Analysis Settings.
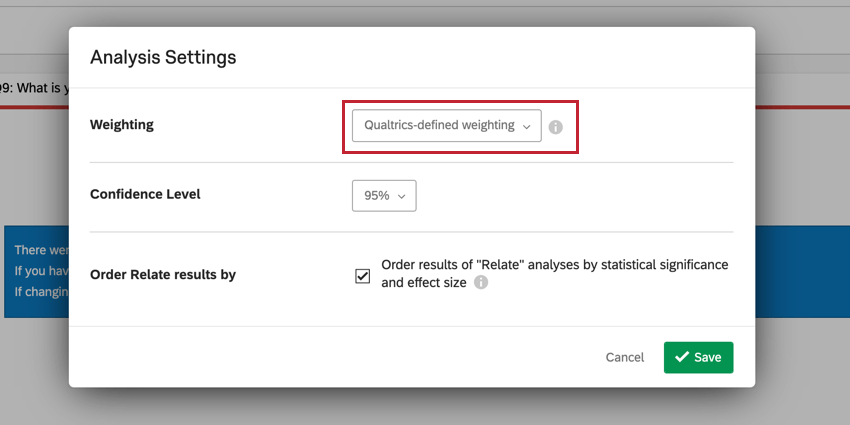
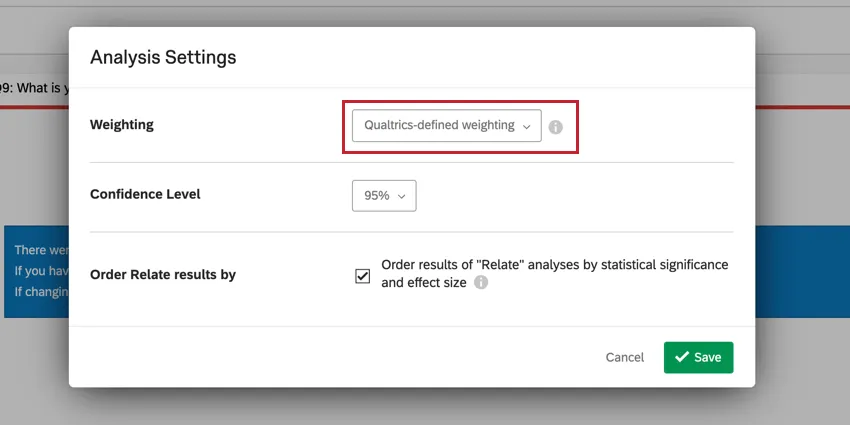
Qtip: “Qualtrics-defined weighting” is any weighting set up in the Weighting section of the Data & Analysis Tab.
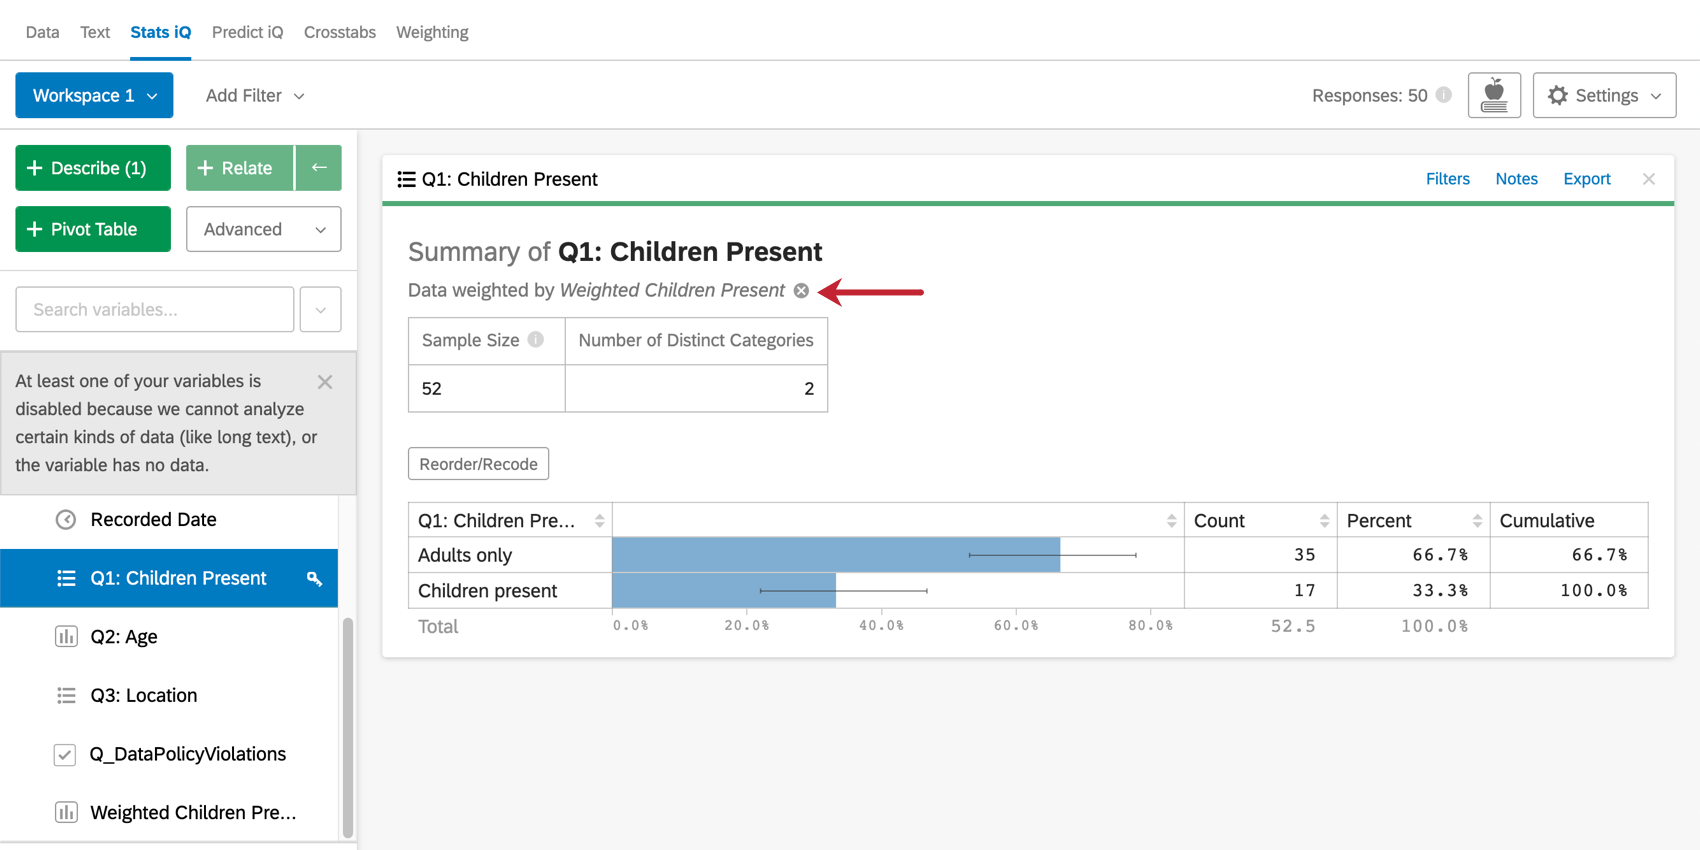
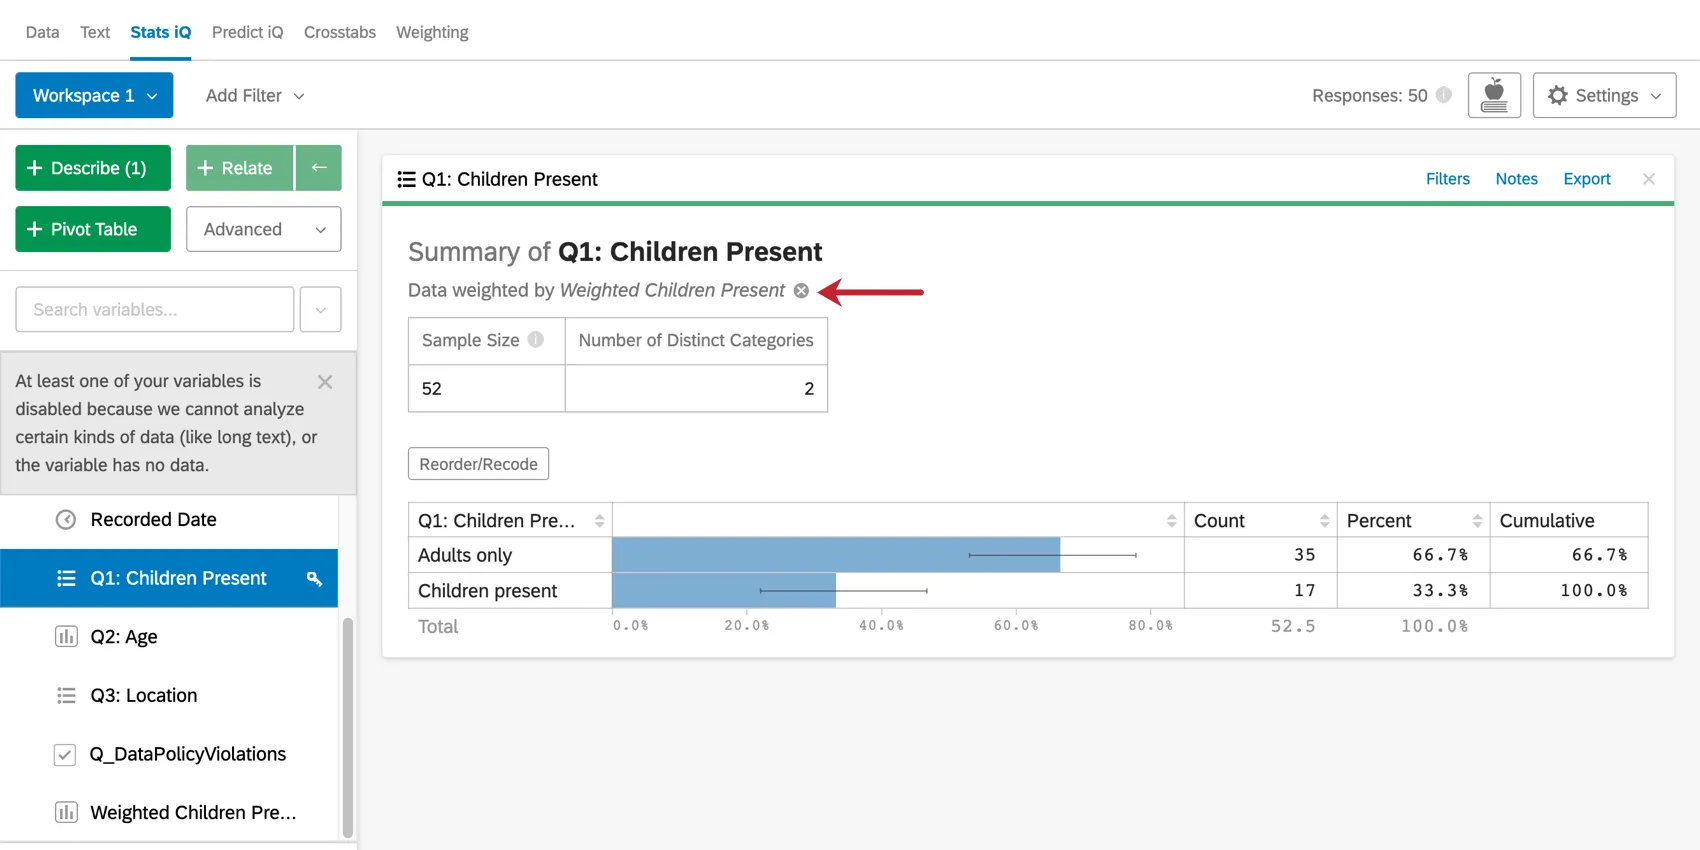
By default, weights will apply to all cards that are created after the weighting variable is selected in Analysis Settings. If you would like to remove the weighting from a specific card, click the “x” to the right of the applied weights.
Details on How to Calculate Weights
In the Weighting section of Data & Analysis, weights are calculated automatically after the desired percentages of respondents are specified. In Stats iQ, weights must be determined manually before a weighting variable can be created. This allows for many more options in terms of how variables are applied, but requires an understanding of how to calculate weights. In this section we will go over a brief example of how to calculate weights in a standard situation.
Typically weights are calculated when the data from a survey (the sample) does not match the general population. For example, if 60% of the respondents to your survey had children and 40% did not, but in reality you know that your population is closer to a 50/50 split, weights can be calculated to adjust the sample so that it matches the general population.
The most basic approach to this is to calculate a multiplier for each group based on the percentage of the sample and the percentage of the population for that group. For the example stated above, this would be done as follows:
With children: 50% / 60% = 0.5 / 0.6 = 0.83
Without children: 50% / 40% = 0.5 / 0.4 = 1.25
The values of the weighting variable would be 0.83 and 1.25 for respondents with and without children, respectively.
FAQs
How do I create a new Stats iQ variable?
How do I create a new Stats iQ variable?
How can I "recode" values in Stats iQ?
How can I "recode" values in Stats iQ?
For variables that can't be directly recoded, you can recode values for in the Create or Clean Variable menu. In the Create Variable window, use the Logic method to assign numerical values to each existing value for the variable. You can either create a new variable or select Replace Existing Variable in the lower-left corner to update the variable with the new numeric values.
For more information on the Logic method for variable creation, please visit the support page on Variable Creation.
What are the options for analyzing my data in Stats iQ?
What are the options for analyzing my data in Stats iQ?
- Describe: Selecting a variable from the list and then clicking Describe will give you a visualization of the data contained in that variable. Use this when you would like to see how the data for a certain variable is distributed.
- Relate: Selecting two variables and then clicking Relate will run a statistical analysis of the relation between the two variables. Use this when you would like to know how strongly two variables are correlated.
- Pivot Table: Selecting two or more variables and clicking Pivot Table will create a table that displays the values of the variables as rows and columns. The cells can be set to display a variety of different information including column and row percentage, Sum, and Variance. Use this when you would like to compare the overlap between specific values of a set of variables.
- Regression: Selecting two variables and clicking Regression will give the mathematical relationship between the variables. Use this when you would like to predict values for one variable based off of the values of another.
- Cluster: Selecting two to ten demographic variables and clicking Cluster will display groupings of traits most likely to occur together, thus revealing the population segments captured in your data.
What do the different variable types mean in Stats iQ?
What do the different variable types mean in Stats iQ?
I don't know what this statistical term means. Can you tell me?
I don't know what this statistical term means. Can you tell me?
- Statistical tests: ANOVA, T-test, and Chi-squared are all statistical test that Stats iQ performs to test whether or not the relationship between two variables is significant. These tests are used to generate a P-Value.
- P-Value: This value represents the probability that the observed results would be seen if no correlation between the variables exists. A lower P-Value means more correlated data.
- Effect Size: The effect size is a measure of how large the correlation between two variables is. This is measured in different ways depending on the type of the statistical test performed. Examples are Cohen’s d, Pearson’s r, and Cramer’s v. The larger the effect size value, the more correlated the variables are.
How do I filter the data that appears in Stats iQ?
How do I filter the data that appears in Stats iQ?
How do I get my new responses to show up in Stats iQ?
How do I get my new responses to show up in Stats iQ?
What’s Stats iQ? / Where’s Statwing?
What’s Stats iQ? / Where’s Statwing?
What do I do if my data isn't loading properly?
What do I do if my data isn't loading properly?
That's great! Thank you for your feedback!
Thank you for your feedback!