
Bar Chart (Results)
What's on this page
Qtip: There is a new version of Results available. To opt in to the new Results Dashboards, navigate to the Results tab and click Try it now.

About Bar Charts
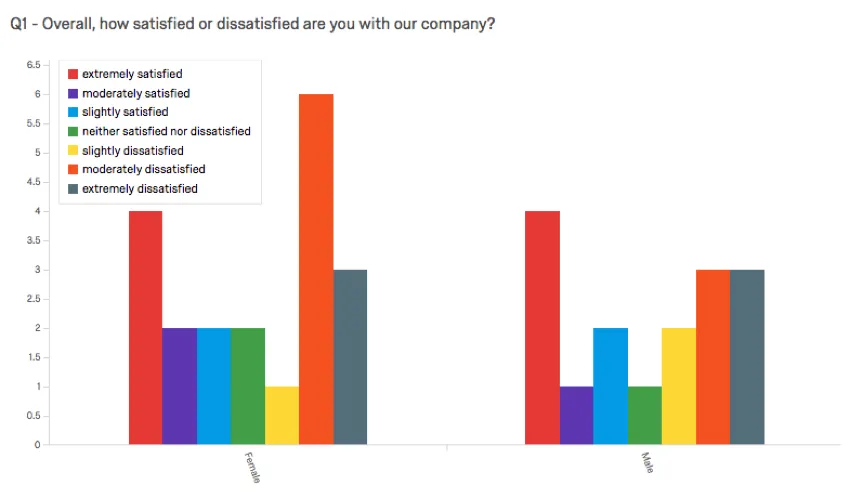
The Bar Chart visualization allows you to view answer options or field value data as rectangular bars. The length of each bar is proportional to the number of respondents who selected or were assigned the value. One axis of the visualization shows the specific answer options being compared, and the other axis represents a discrete value (e.g., counts or percentages of respondents with that option).
Customization Options
For general settings, see the Visualizations Overview support page. Read on for settings specific to the Bar Chart.
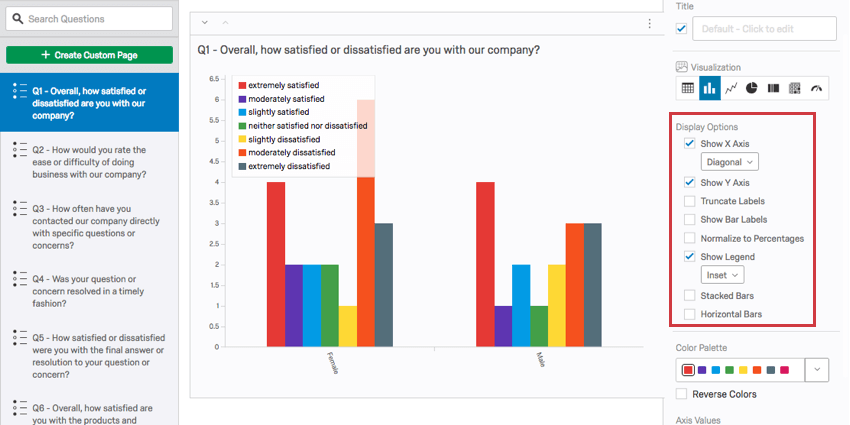
Display Options
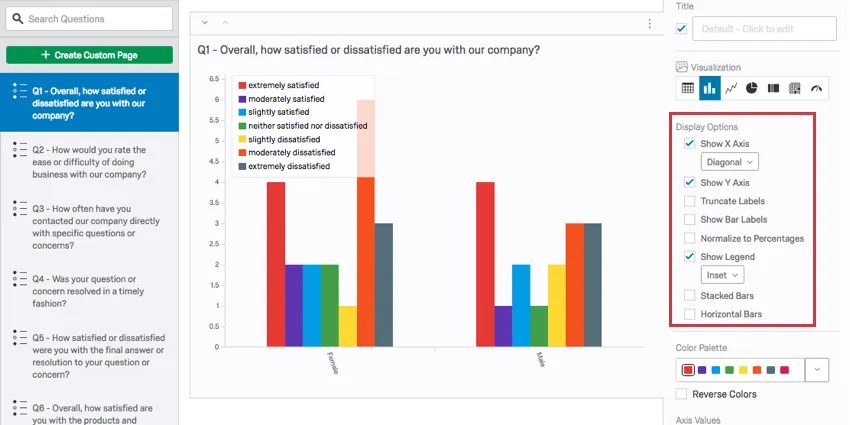
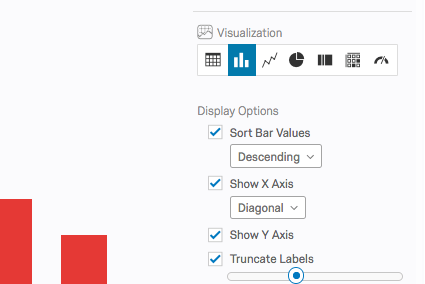
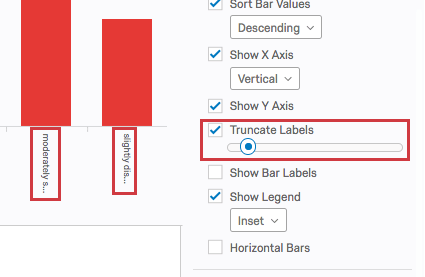
You have six settings under the Display Options list in the visualization editing pane. Some of these options will be enabled by default, but you can enable any combination of these to achieve your desired visualization:
- Sort Bar Values: Sort the options in ascending or descending order. This option disappears once you apply a breakout.
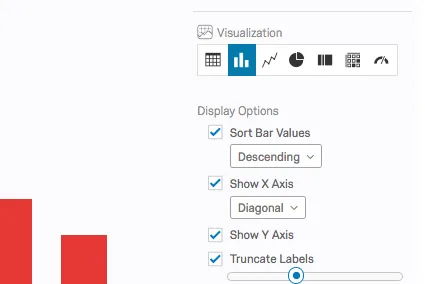
- Show X Axis: Display the X axis and its values in the visualization. Note that when Horizontal Bars is enabled, the X axis is in the Y position. For a vertical Bar Chart, you can also change the orientation of the text to Horizontal, Vertical, or Diagonal.
- Show Y Axis: Display the Y axis and its values in the visualization. Note that when Horizontal Bars is enabled, the Y axis is in the X position.
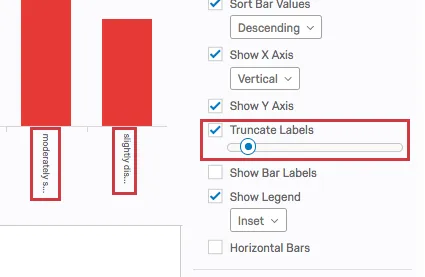
- Truncate Labels: Shorten the labels of each bar once they reach a certain length.
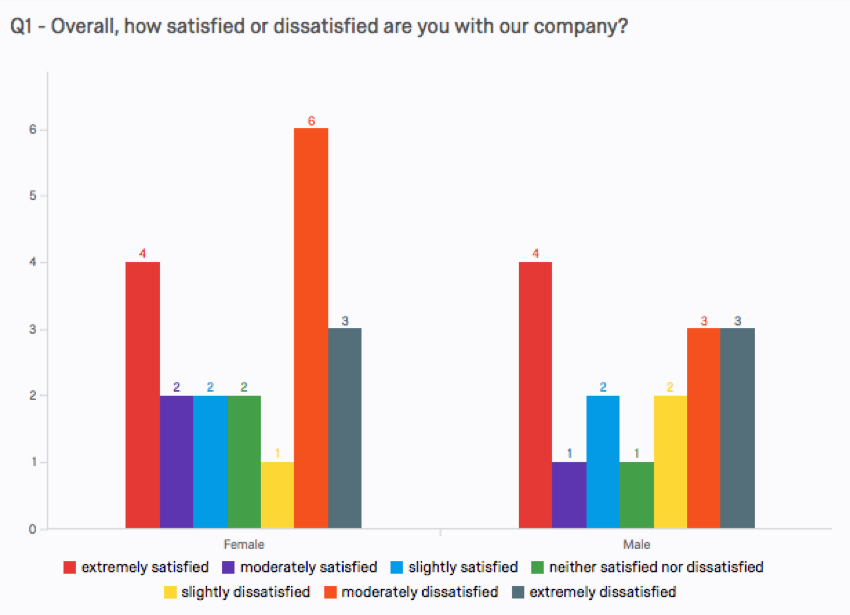
- Show Bar Labels: Display the number of respondents who answered or were assigned to each option at the end of each bar.
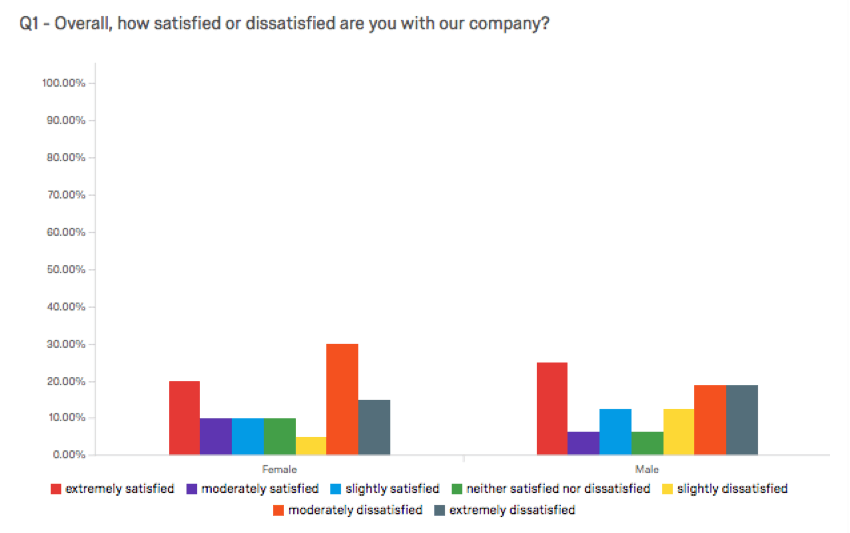
- Normalize to Percentages: Display the percentage of respondents who answered or were assigned each option instead of the count. Only available when a breakout is applied.

- Show Legend: Display the legend values with the auto setting, at the bottom, to the left, or inset within the graph.
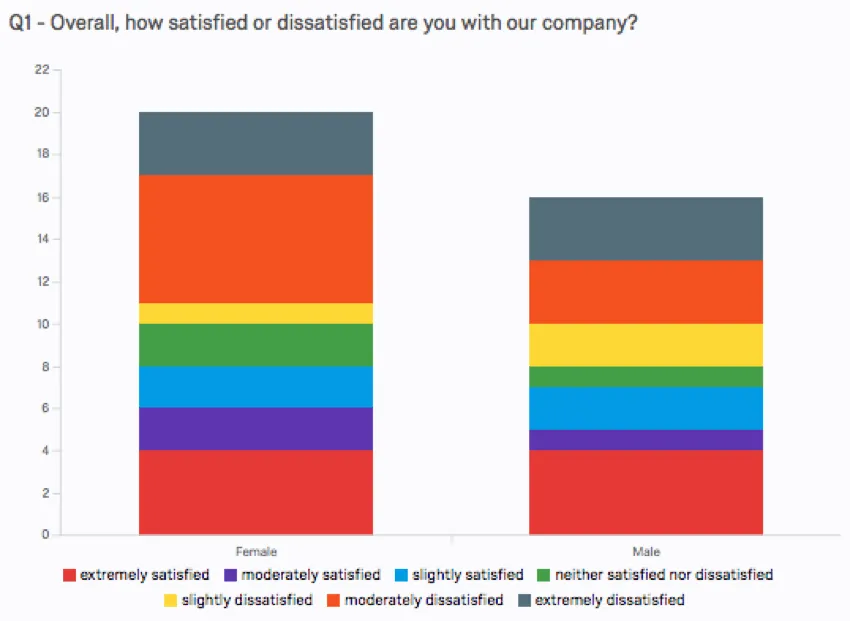
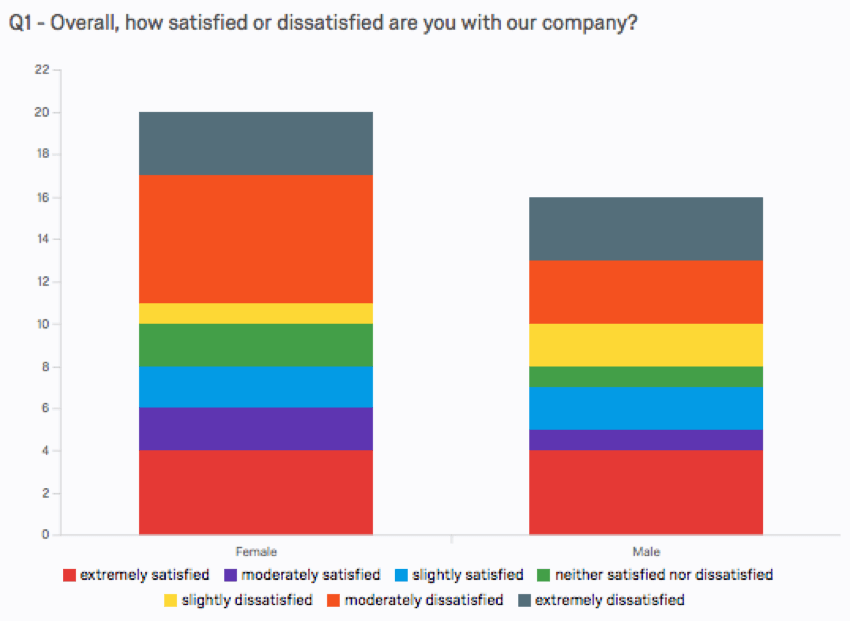
- Stacked Bars: Display the options stacked on top of each other instead of as separate bars. Note that when Horizontal Bars is enabled, options will be stacked side by side. Only available when a breakout is applied.
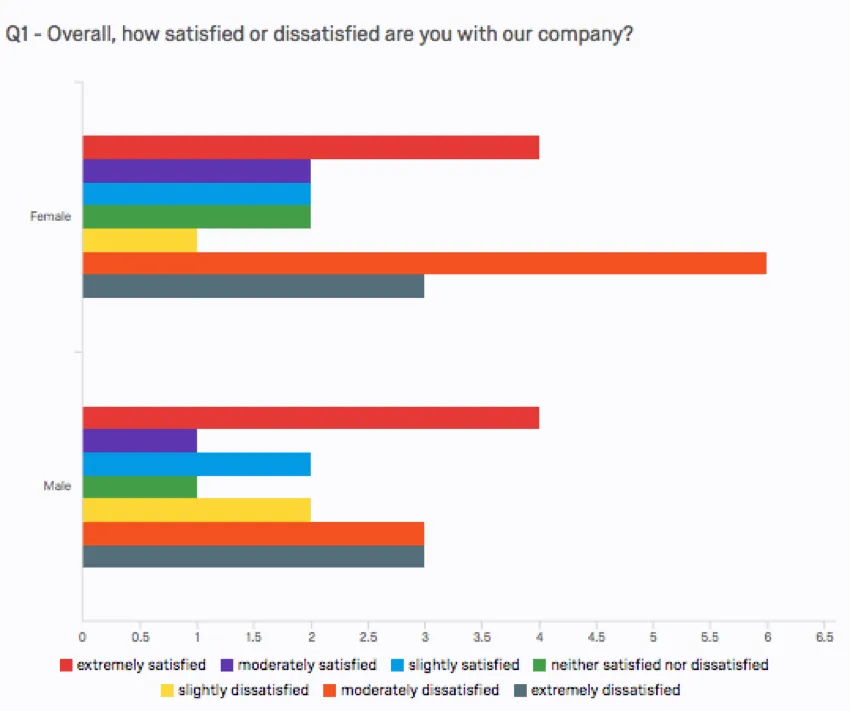
- Horizontal Bars: Rotate the visualization so that the bars appear lengthwise along the graph instead of vertical.
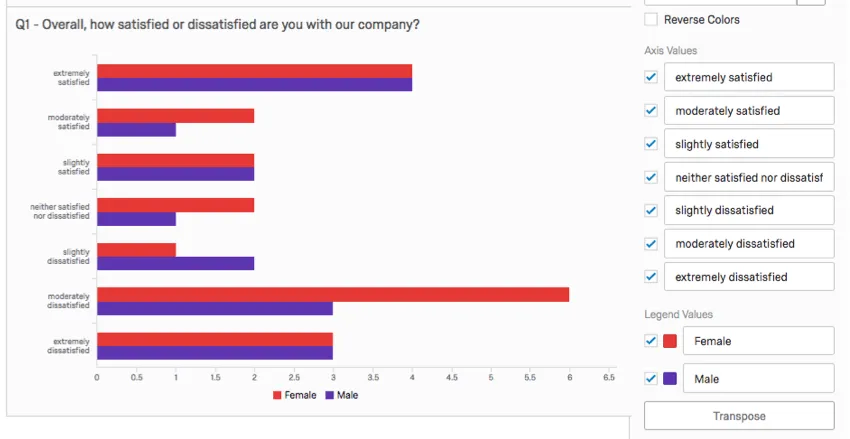
Axis Values
Whenever you apply a breakout to a Bar Chart, the visualization is broken into several sets of bars, one for each of the Breakout options (or “axis values”). You can edit the text of these axis values by clicking directly into the textbox for the name and entering the new name.
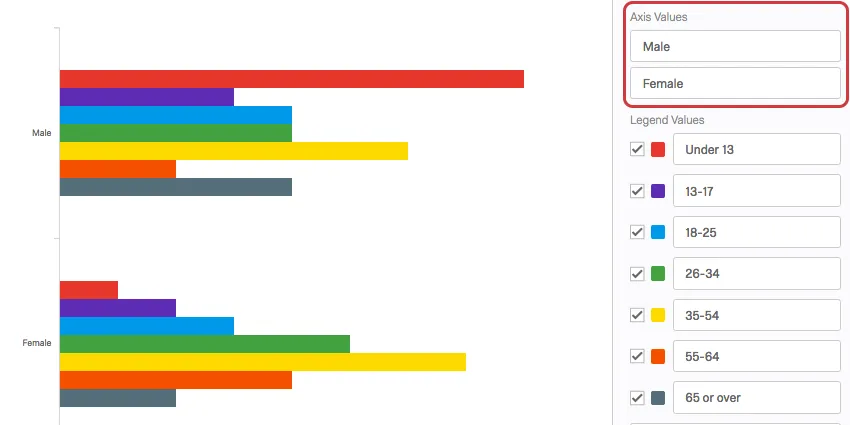
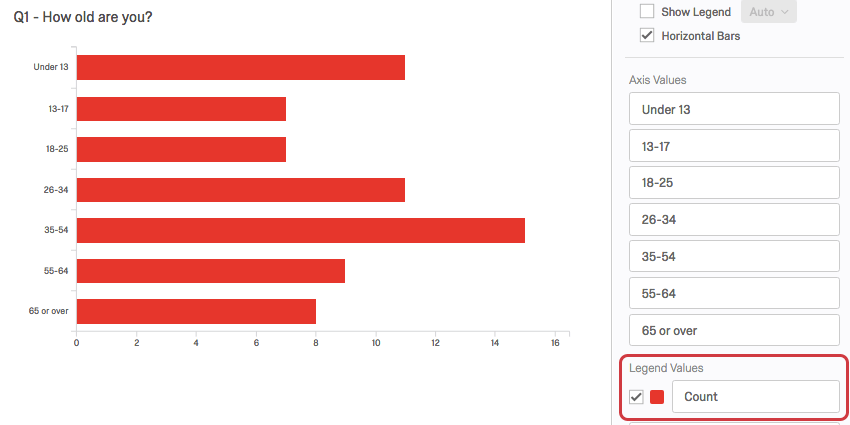
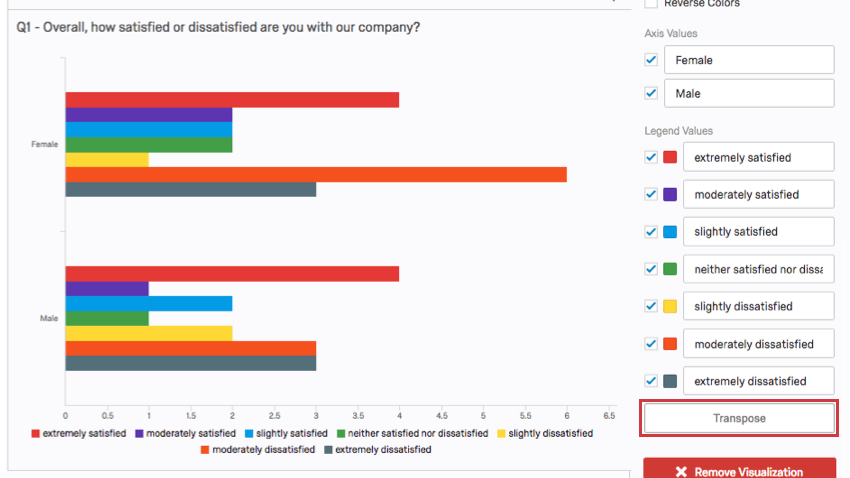
Legend Values
You have a variety of options concerning the answer names (or “legend values”), including the following:
- Change the legend value text by clicking directly into the textbox for the name and entering the new name. To turn the legend on/off, use the Display Options.

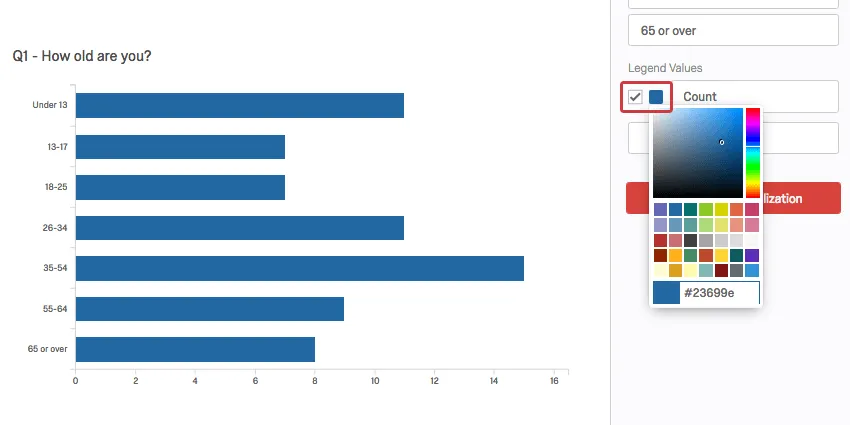
- Adjust the color of the option by clicking directly on the color box to the left of the value and selecting a new color.
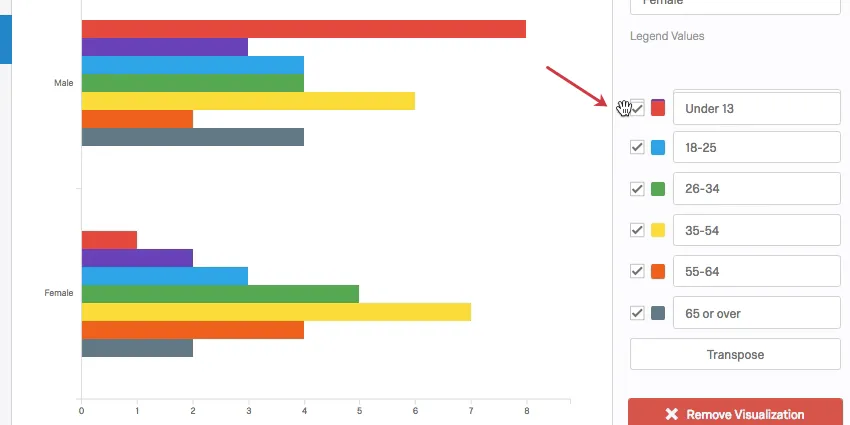
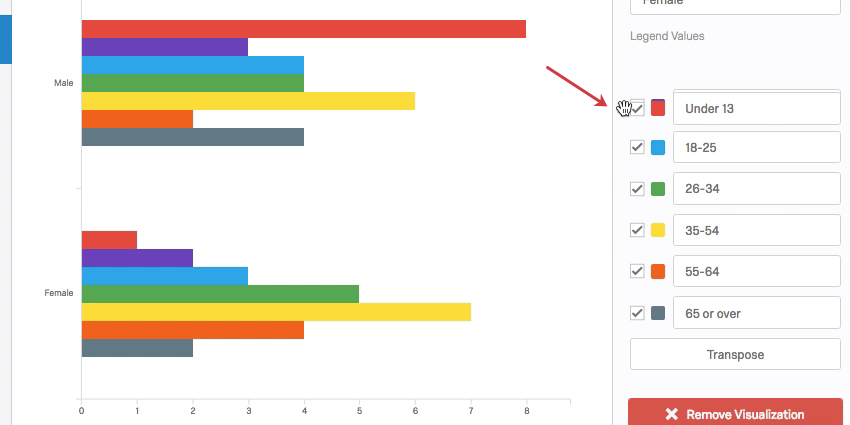
- Change the order the values appear in the visualization by clicking to the left of a value and dragging it to its desired position.
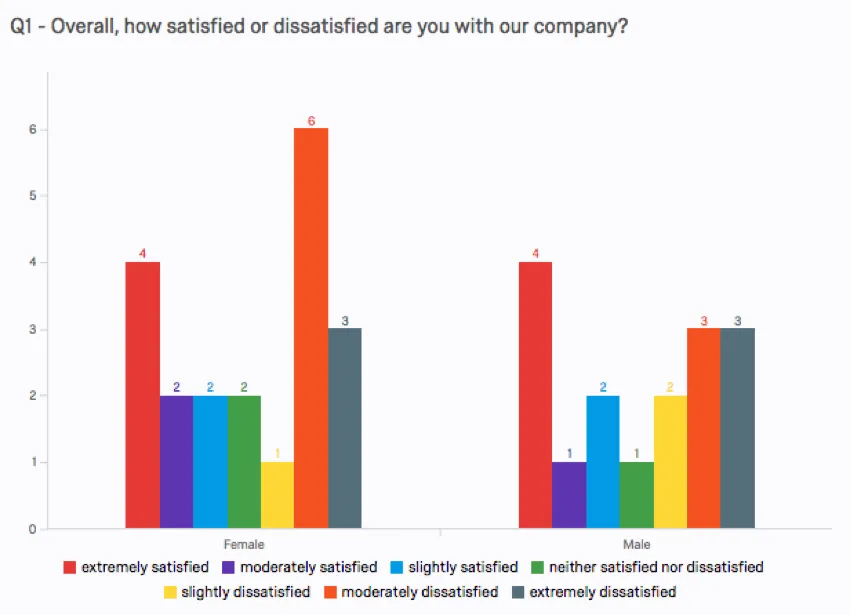
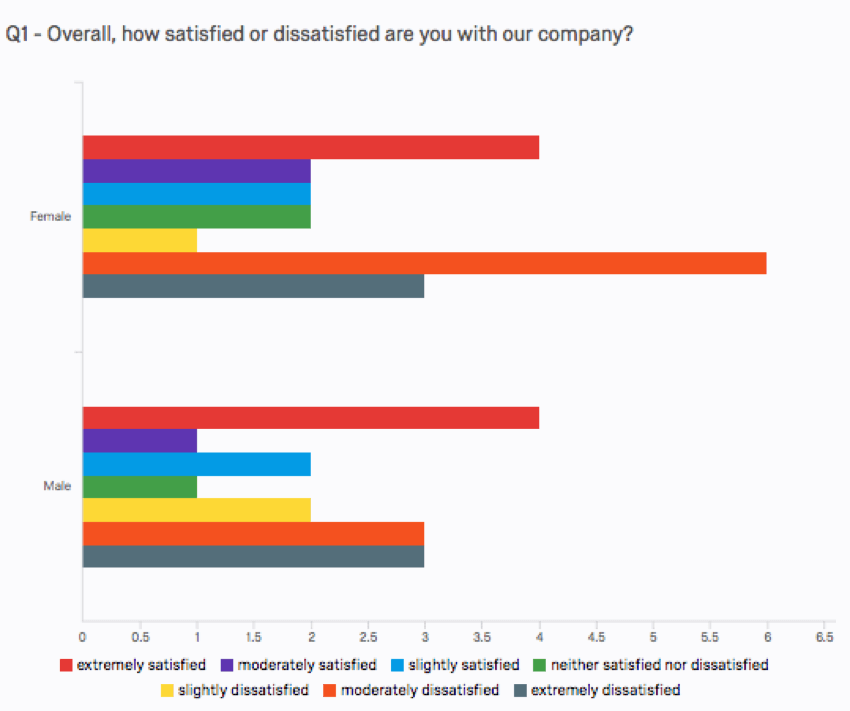
 This Bar Chart has more Legend Values because it has been broken down by gender. To set this up, use the breakout by option found in visualization editing pane.
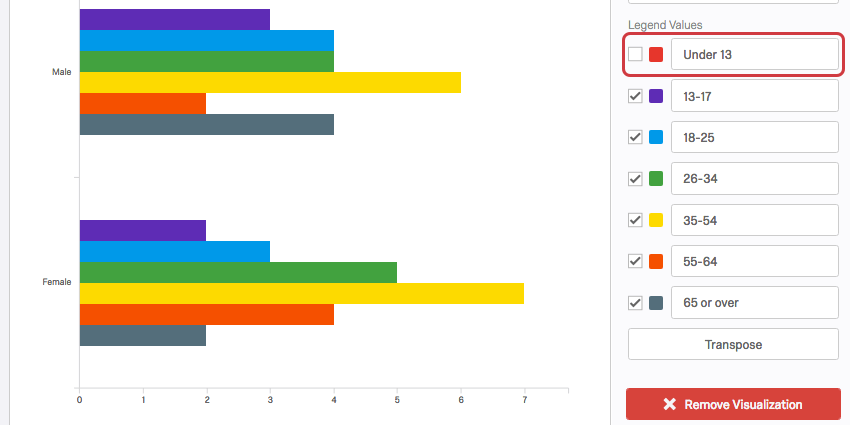
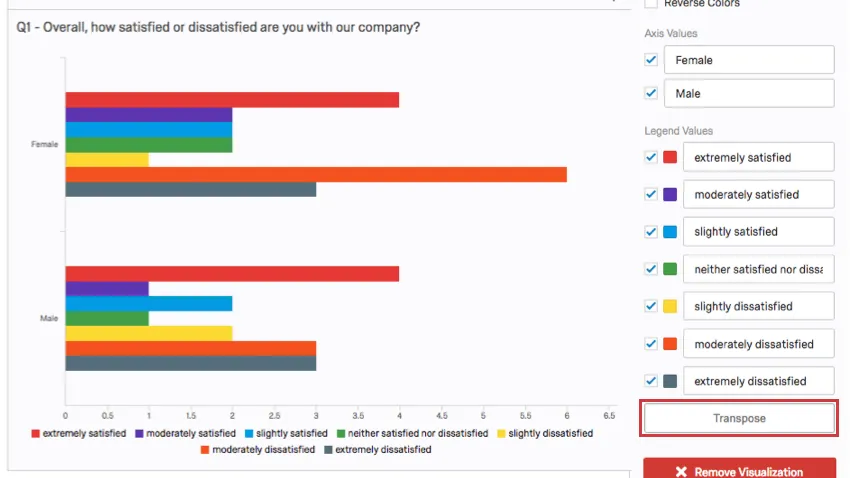
 - Hide values from the visualization by deselecting the checkbox to the left of the value.


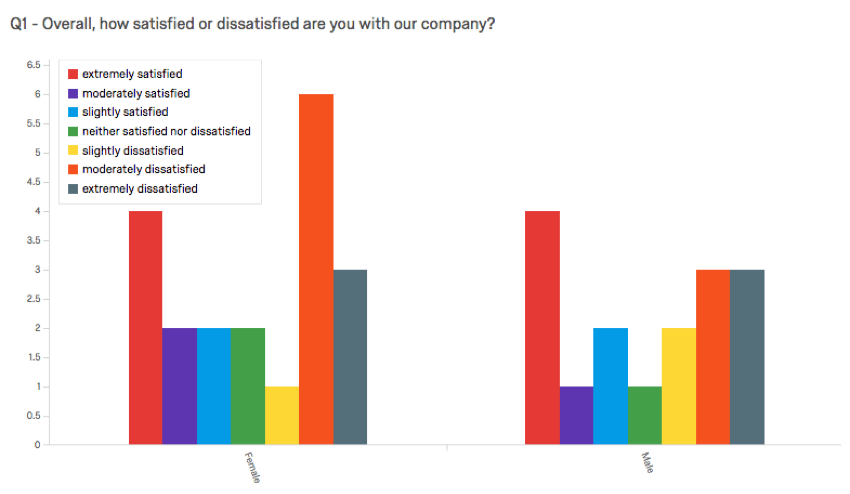
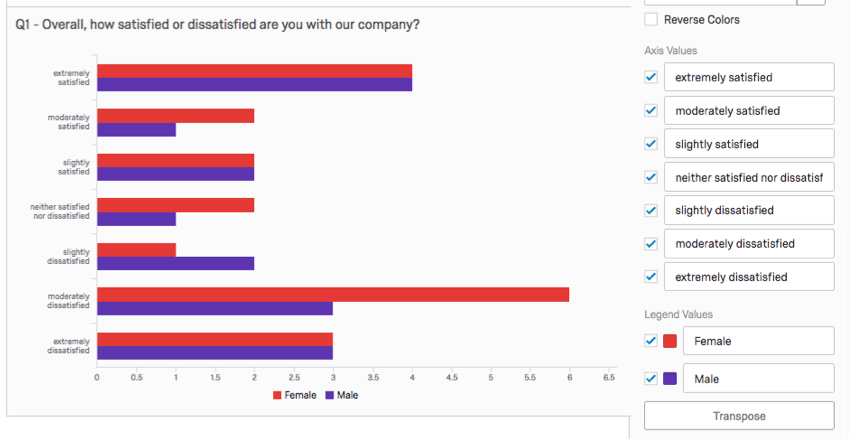
Transpose
Whenever you apply a breakout to a Bar Chart, the visualization is broken into several sets of bars, one for each axis value. By default, the axis values are set by the Breakout options, but you can click the Transpose button to switch the axis values (Breakout options) with the legend values (Data Source options).
Incompatible Fields
Bar Charts are compatible with almost every kind of variable in Qualtrics because they can display both discrete data (e.g., a finite, five point scale) and continuous data (e.g., a question where respondents type in their age). This includes most question types, survey metadata, Embedded Data, and custom variables, such as Formulas or Bucketed variables.
Below are the few variables Bar Charts are not compatible with:
- Text Entry questions lacking numeric validation
- Form field questions lacking numeric validation
- Open text fields on other questions, such as Text Entry Matrix Tables, text entry columns on Side by Sides, and “Other” text boxes lacking numeric validation
- Heat Maps with no regions defined
- Signature question
- File Upload
- Filter Only Embedded Data
- Text Embedded Data
- Text manual variables
In general, Bar Charts are incompatible with open text content that is not numeric.
Qtip: Be careful with numeric data collected from open-ended questions and with finite scales that have hundreds of choices. A Bar Chart cannot comfortably display hundreds of choices, so for variables like these, it might be better to set your metric as mean or use filters so fewer results are included.
That's great! Thank you for your feedback!
Thank you for your feedback!