-

Qualtrics Platform -

Customer Journey Optimizer -

XM Discover -

Qualtrics Social Connect
Basic Filters in 360 Reports
About Report Filters in 360
Sometimes, you only want to create a report about a particular group of 360 respondents. Maybe you’re interested in how respondents from a certain country rated your product, or maybe you only want your report to include data from the last month. You can narrow down the data presented in your reports by using filters.
Fields You Can Filter By
Evaluation Scope
The Evaluation Scope defines whose evaluations you want to be included in a subject report. If you don’t add this field to your filter, then subjects will be able to see data that does not belong to them in their reports. There are times when you may want to deliberately set your filters up that way, but be careful.
Once added, evaluation scope can be one of the following:
- Subject’s Evaluations: Only include data from the subject’s evaluations.
- Other Evaluations (Excluding Subject’s): Only include data from everyone’s evaluations, excluding the subjects. This parameter is good for comparing the subject against how others in the company performed.
Relationship
The relationship of the evaluator to the subject. It’s important to include both evaluation scope and relationship in the same filter.
Survey Metadata
Survey metadata is information automatically collected when a respondent takes a survey. Survey metadata fields include the following:
- Start Date: The date and time the survey was started.
- End Date: The date and time the survey was completed.
Qtip: This time correlates to the last time the respondent interacted with the survey. Note that End Date and Recorded Date could be different times if a response was later closed as an incomplete response.
- Response Type: The type of response collected (Survey Preview, IP Address, etc.).
Qtip: A response type of IP Address means the response was collected via the Anonymous Link.
- IP Address: The IP address collected from the respondent’s browser.
- Duration: The number of seconds it took the respondent to complete the survey.
- Finished: The status of the respondent’s survey (true = completed, false = incomplete).
- Recorded Date: The date and time the survey was recorded in the dataset.
- Response ID: Internal Qualtrics ID assigned when a response is closed, so only completed responses have one.
Embedded Data
Embedded Data includes any extra information you’ve recorded in addition to your question responses. These include:
- Participant’s Email Address
- Participant’s Full Name
- Participant’s Unique Identifier
- Timestamp of last metadata update
Subject Metadata and Evaluator Metadata
Any metadata that was saved with your subjects or evaluators, such as additional employee information. Please be careful to note the difference between subjects and evaluators.
Question Answers
There are many different question types in Qualtrics, and different question types have different filtering options. Some question types have only one filter option (i.e., only one way to represent the data), but for other question types you will have additional options. Possible options include the following:
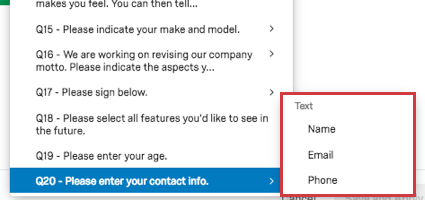
- Text Entry: For Text Entry questions with multiple form fields, you can choose which field you want to display.
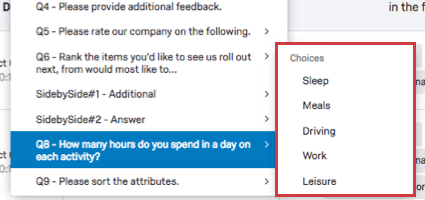
- Choices: For questions with multiple statements or components (such as a Matrix Table), you can choose which statement to filter by.
- NPS®: For NPS® questions, you can view the NPS® groups (Detractor, Passive, and Promoter, all calculated for you) or you can view the actual numeric values (0–10) the question displays to respondents.
Saving and Reloading a Global Filter
Here, we go over how to add a filter (which automatically saves it) and how to use filters you’ve created in the past.
Saving a Filter
- Navigate to the Reports tab.
- Navigate to the Reports section.
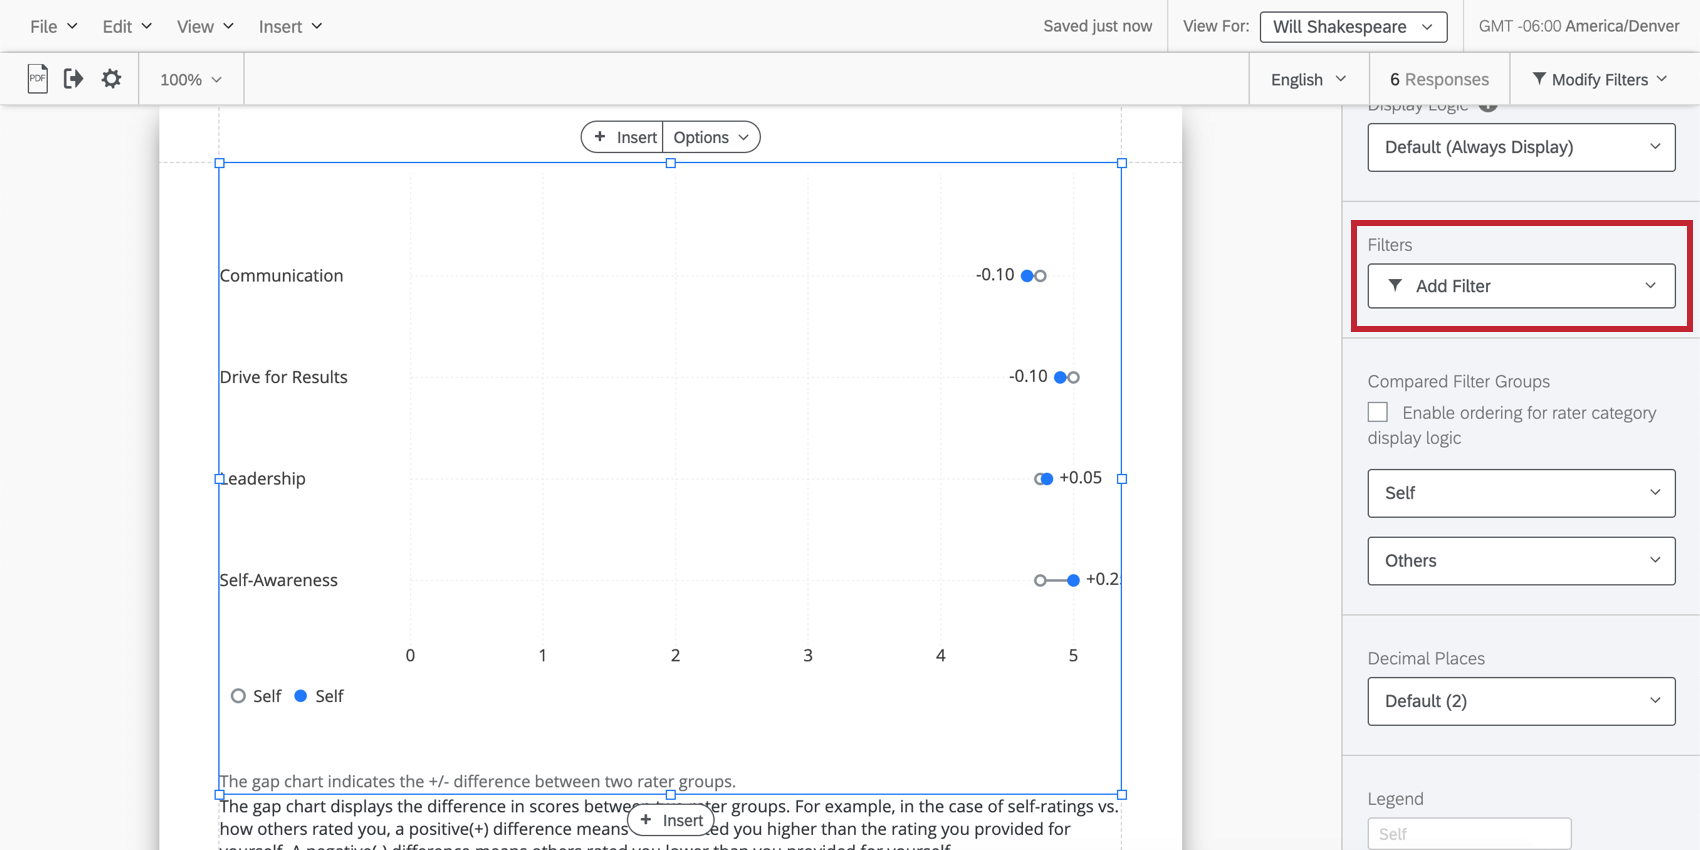
- Click Add Filter.
- Hover over your data source.
- Select Manage Filters.
- Click Create New.
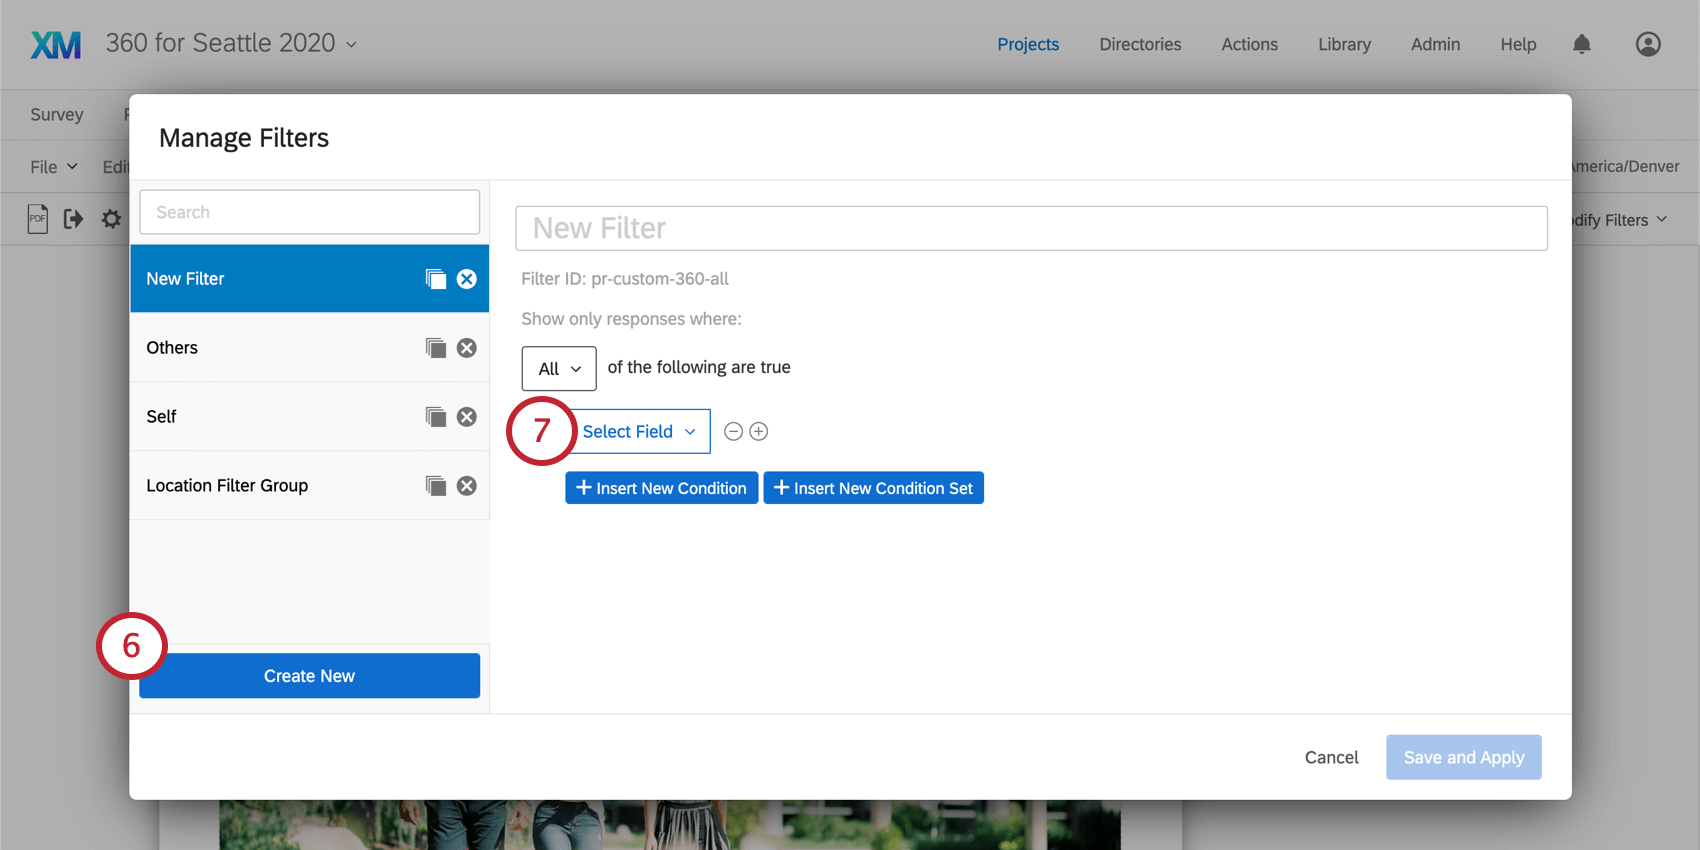
- Select the Field you want to filter by.
- Select your Operator. This is how the responses filtered out by the filter should relate to the Field’s value.
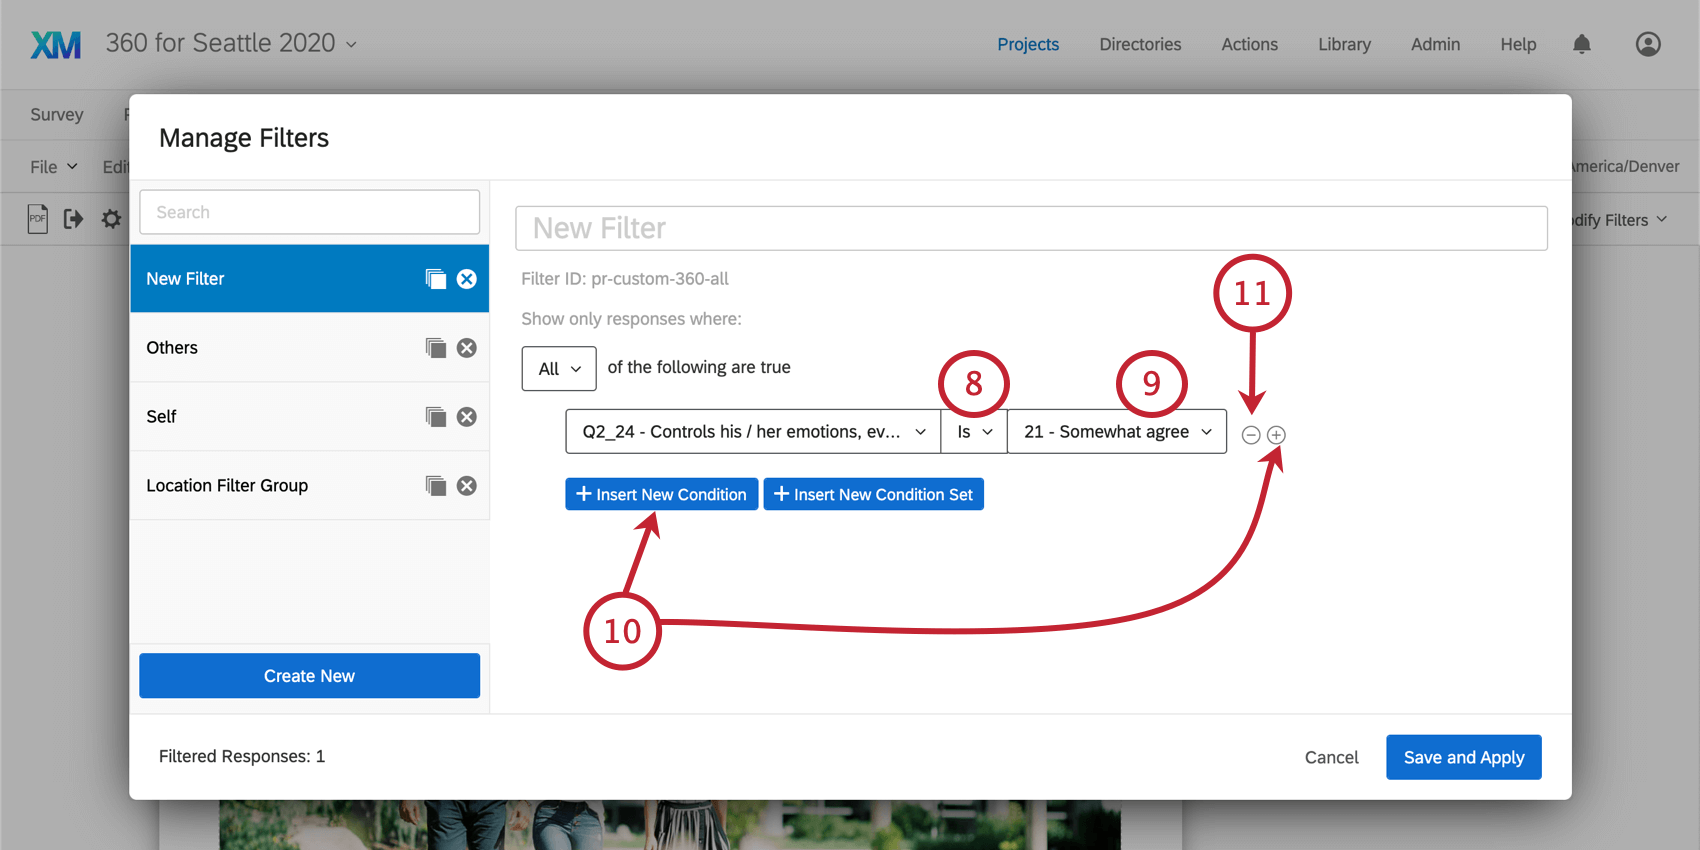
- Select the Operand. This is the value of the Field you chose.
- Click the plus sign ( + ) or Insert New Condition to add another condition.
- Click the minus sign ( – ) to remove a condition.
- Click Insert New Condition Set to nest a new condition set under the first.
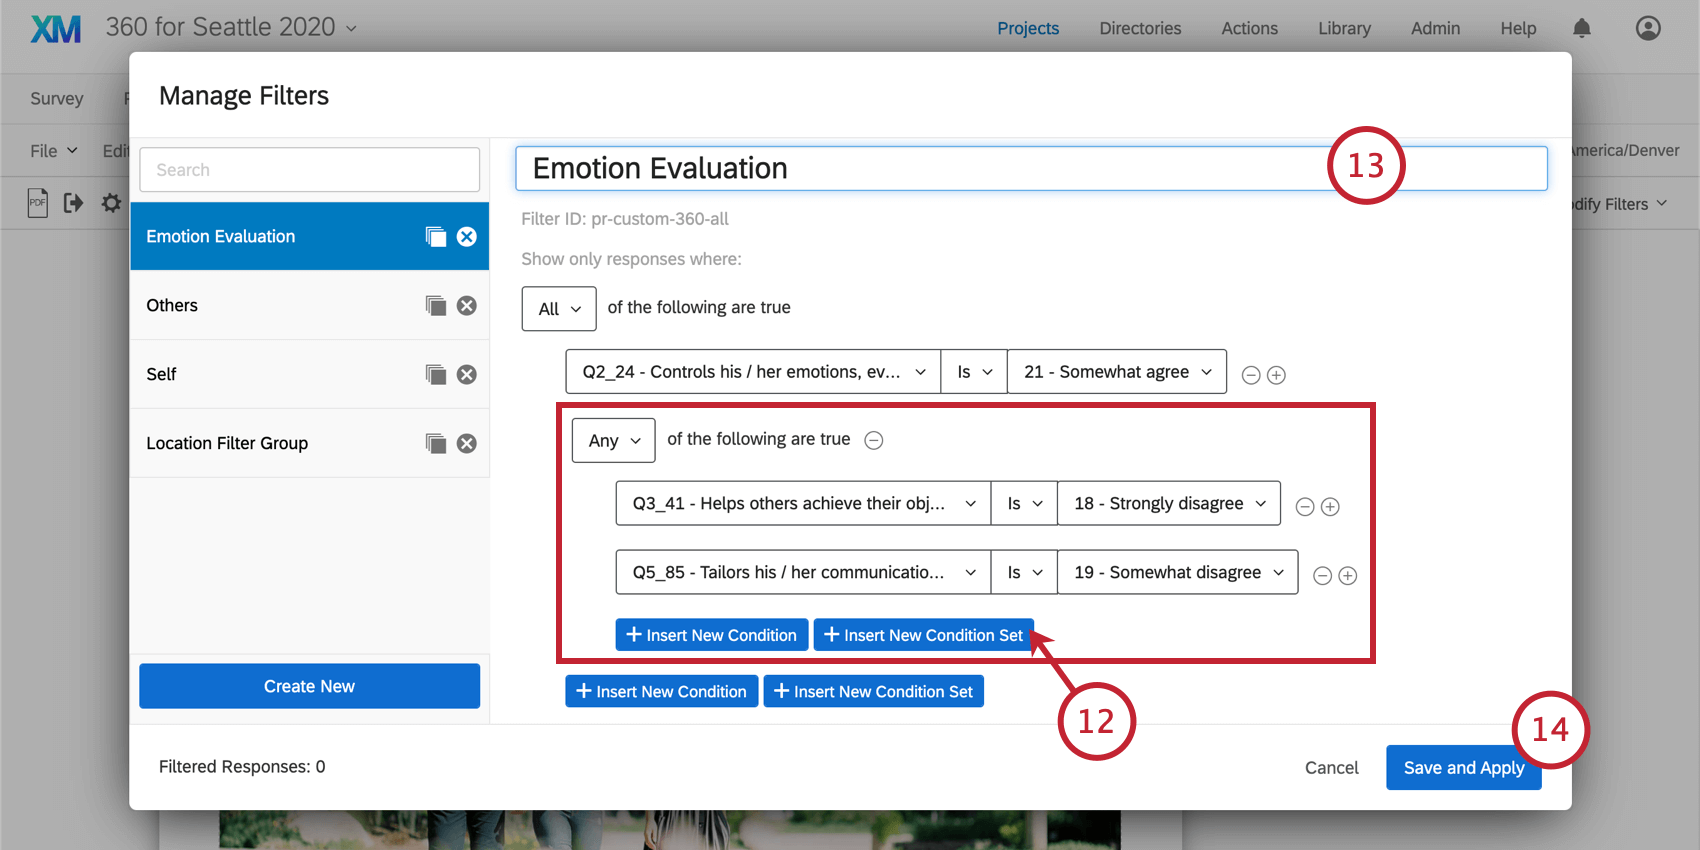
- Name your filter.
- Click Save and Apply to finish.
Reloading Filters
- Navigate to the Reports tab.
- Navigate to the Reports section.
- Open the desired report.
- Click Filters.
- Highlight over your data source.
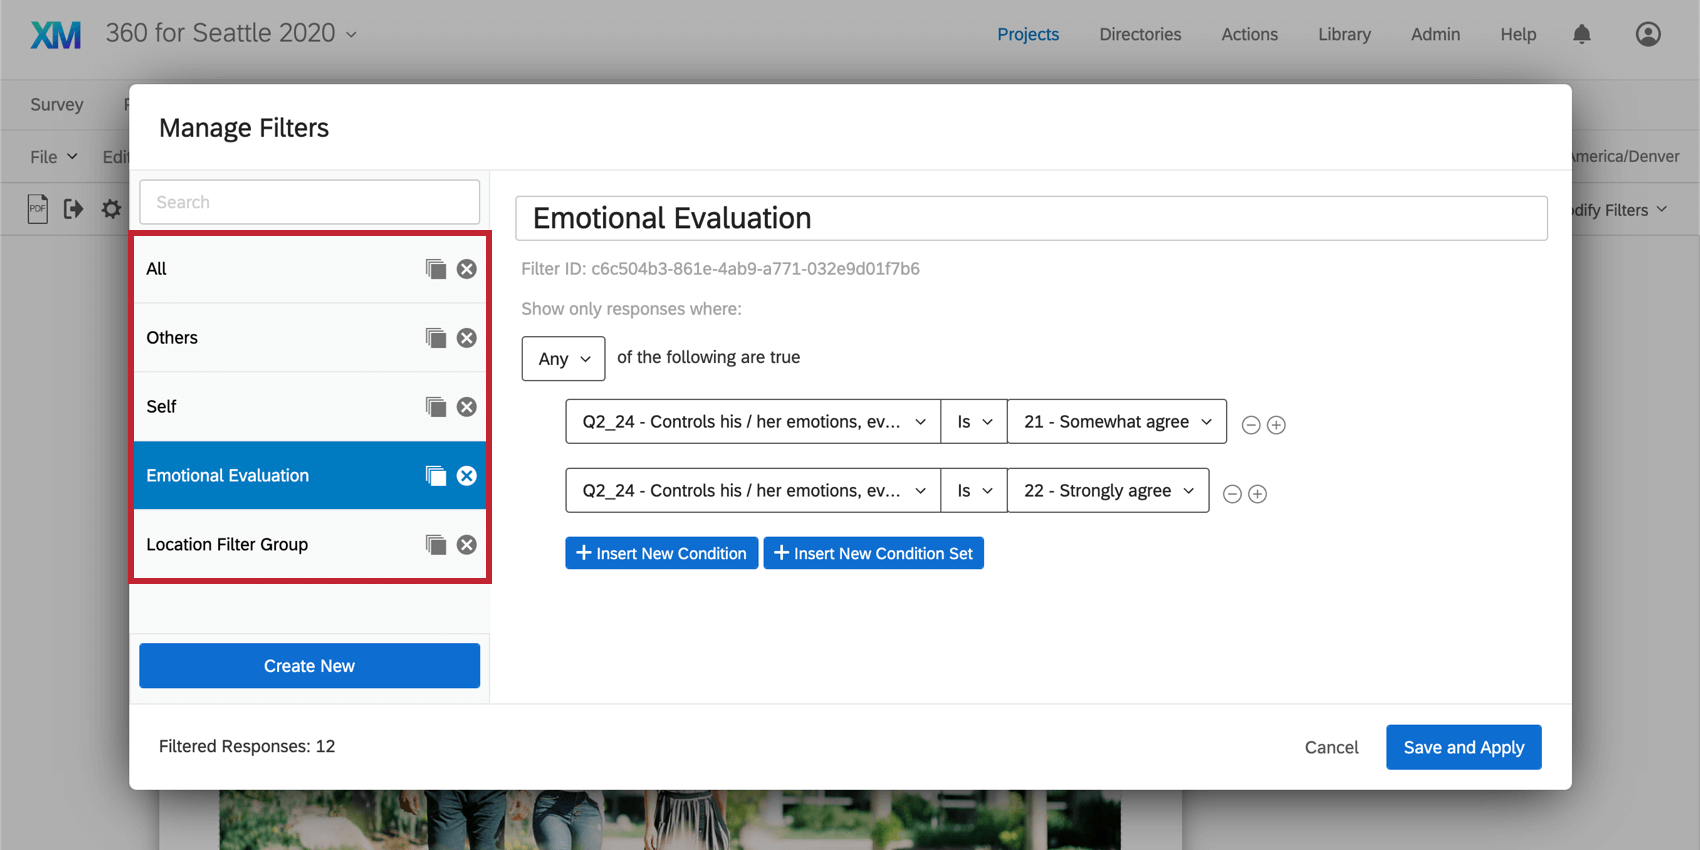
- Select the filter you want to use.
Deselecting a Filter
To view your unfiltered data again, follow the steps in the Reloading a Filter section to deselect your current filter.
Conditions and Condition Sets
Filters work the same in Data & Analysis as they do in Reports – in fact, the filters you create there also appear in Advanced-Reports, and vice versa.
To learn more about building the conditions of your survey, see the following sections of the Filtering Responses support page:
Managing Filters
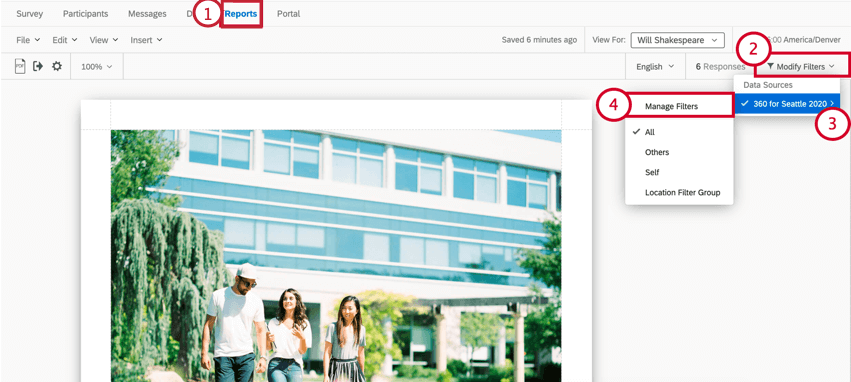
- Navigate to the Reports tab.
- Click Modify Filters.
- Highlight over your data source.
- Select Manage Filters.
- Select the filter you want to edit along the left.
- Edit the conditions or rename the filter as desired.
- Click Save and Apply.
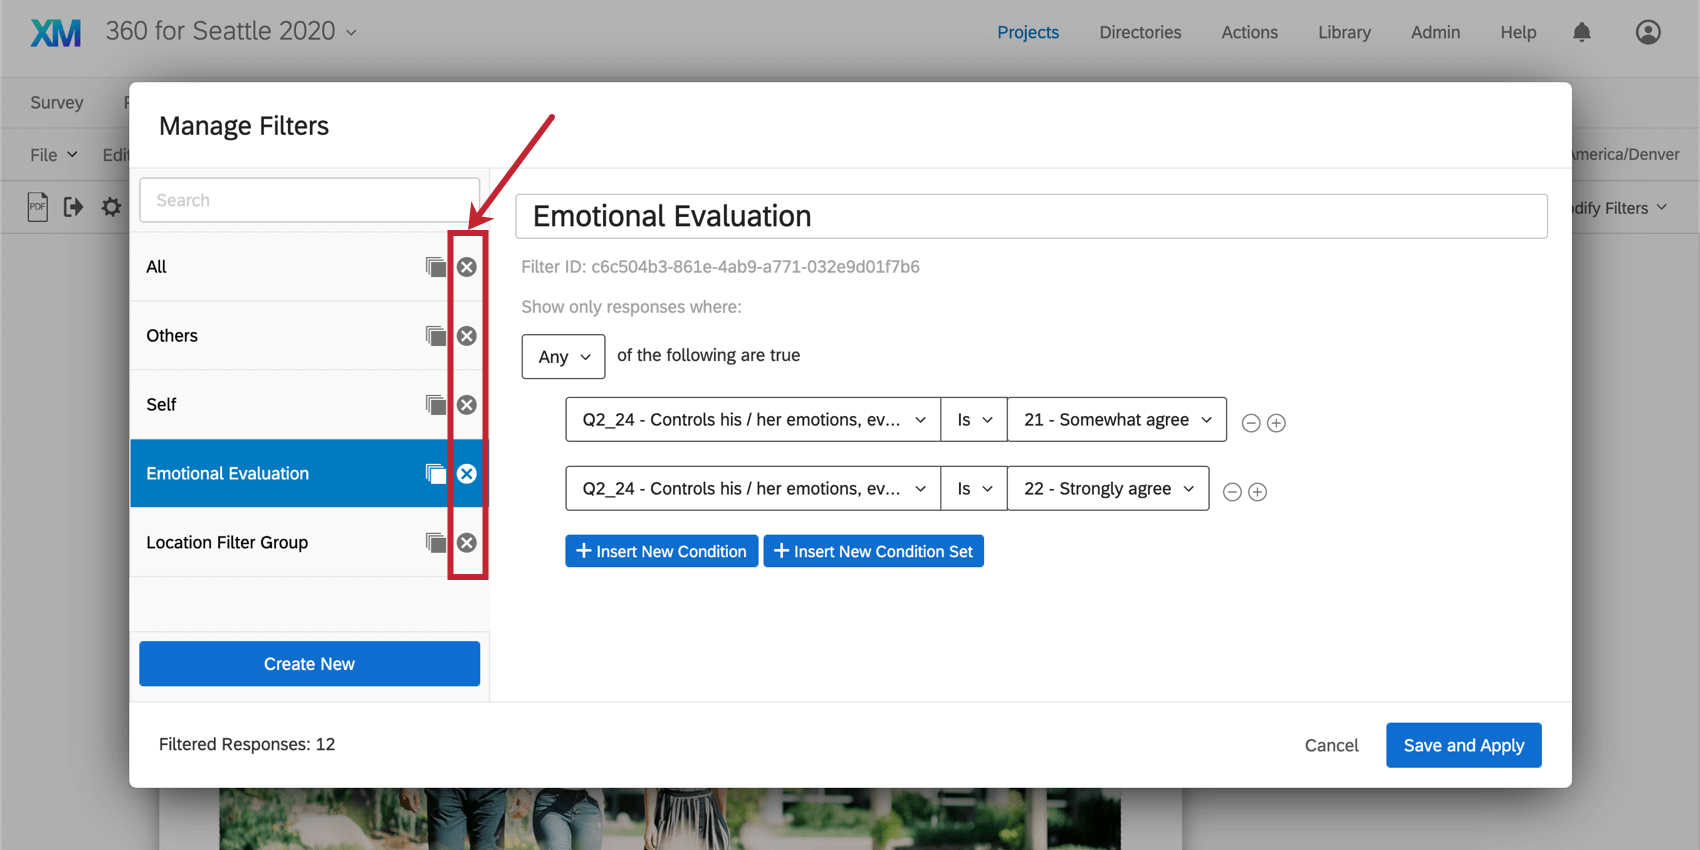
Copying a Filter
Once on the Managing Filters window, click the copy icon to the right of a filter to create an exact duplicate of it.

Deleting a Filter
Once on the Managing Filters window, click the X to the right of a filter to delete it permanently.
Setting Filters for Additional Data Sources
Every visualization has a Data Source. However, this data source doesn’t have to be the 360 survey you’re currently working on. It can be any survey in your account. This is useful if, for example, you want to have a table with your 2019 survey’s data next to a table with your 2018 survey’s data.
When your report contains at least one visualization with a different survey source (e.g., 2018 instead of 2019 data), you are then allowed to manage and reload filters for that survey.
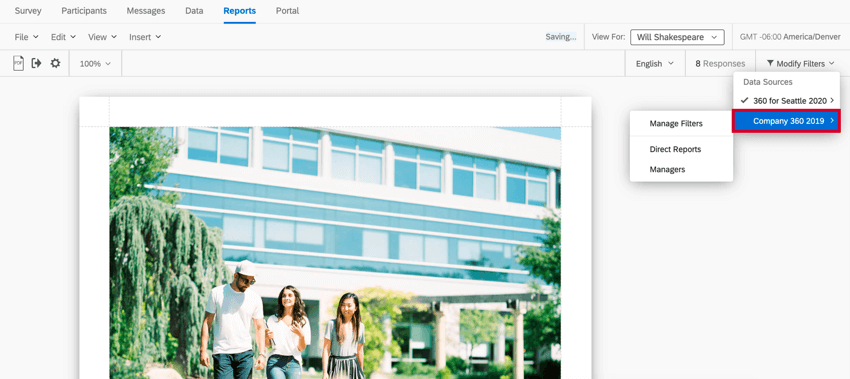
To create or manage these filters:
- Navigate to the Reports tab.
- Navigate to the New Reports section.
- Click Modify Filters.
- Highlight over your additional data source.
- Select Manage Filters to create a new filter.
- Select an existing filter to globally apply that filter to all visualizations with a matching data source that are in the subject report.