-

Qualtrics Platform -

Customer Journey Optimizer -

XM Discover -

Qualtrics Social Connect
The Confusion Matrix & Precision-Recall Tradeoff
The confusion matrix and the precision-recall chart help you assess your model’s accuracy.
Confusion Matrix
Let’s say you’re thinking about giving an extra sugar cube to customers who are likely to return. But of course you want to avoid giving out sugar cubes unnecessarily, so you only give them to customers that the model says are at least 30% likely to return.
If you had some new customers walk by…
| CustomerID | Age | Gender |
|---|---|---|
| … | … | … |
| 324 | 54 | Female |
| 325 | 23 | Female |
| 326 | 62 | Male |
| 327 | 15 | Female |
| … | … | … |
…you could use our regression model to predict how likely they’d be to return…
| CustomerID | Age | Gender | Model-estimated likelihood of return |
|---|---|---|---|
| … | … | … | … |
| 324 | 54 | Female | 34% |
| 325 | 23 | Female | 24% |
| 326 | 62 | Male | 65% |
| 327 | 15 | Female | 7% |
| … | … | … | … |
…and decide to classify customers with at least 30% likelihood as “Will return” and give them sugar cubes:
| CustomerID | Age | Gender | Model-estimated likelihood of return | Model prediction (30% cutoff) |
|---|---|---|---|---|
| … | … | … | … | … |
| 324 | 54 | Female | 34% | Will return |
| 325 | 23 | Female | 24% | Won’t |
| 326 | 62 | Male | 65% | Will return |
| 327 | 15 | Female | 7% | Won’t |
| … | … | … | … | … |
To better understand how accurate our model is, though, you can apply the model to the datapoints you already have, where you already know if that customer eventually returned…
| CustomerID | Age | Gender | Model-estimated likelihood of return | Model prediction (30% cutoff) |
Returned |
|---|---|---|---|---|---|
| 1 | 21 | Male | 44% | Will return | Returned |
| 2 | 34 | Female | 4% | Won’t | Returned |
| 3 | 13 | Female | 65% | Will return | Didn’t |
| 4 | 25 | Female | 27% | Won’t | Didn’t |
| … | … | … | … | … | … |
…and assess how accurate the data is…
| CustomerID | Age | Gender | Model-estimated likelihood of return | Model prediction (30% cutoff) |
Returned | Prediction accuracy |
|---|---|---|---|---|---|---|
| 1 | 21 | Male | 44% | Will return | Returned | Correct |
| 2 | 34 | Female | 4% | Won’t | Returned | Incorrect |
| 3 | 13 | Female | 65% | Will return | Didn’t | Incorrect |
| 4 | 25 | Female | 27% | Won’t | Didn’t | Correct |
| … | … | … | … | … | … | … |
…and then further break that down into the following categories:
- True Positive: Classified by the model as “Will return” and had in fact “Returned” in reality.
- False Positive: Classified by the model as “Will return” but actually “Didn’t return” in reality.
- True Negative: Classified by the model as “Won’t return” and in fact “Didn’t return” in reality.
- False Negative: Classified by the model as “Won’t return” but had actually “Returned” in reality.
| CustomerID | Age | Gender | Model-estimated likelihood of return | Model prediction (30% cutoff) |
Returned | Prediction accuracy | Accuracy type |
|---|---|---|---|---|---|---|---|
| 1 | 21 | Male | .44 | Will return | Returned | Correct | True positive |
| 2 | 34 | Female | .04 | Won’t | Returned | Incorrect | False negative |
| 3 | 13 | Female | .65 | Will return | Didn’t | Incorrect | False positive |
| 4 | 25 | Female | .27 | Won’t | Didn’t | Correct | True negative |
| … | … | … | … | … | … | … | … |
Lastly, you could summarize all this work into precision and recall.
Precision:
- Of those classified as “Will return,” what proportion actually did?
- True positive / (True positive + False positive)
Recall:
- Recall: Of those that in fact “Returned,” what proportion were classified that way?
- True positive / (True positive + False negative)
Better models have higher values for precision and recall.
- You can imagine a model with 94% precision (almost all identified as “Will return” do in fact) and 97% recall (almost all who “Returned” were identified as such).
- A weaker model might have 95% precision but 50% recall (when it identifies someone as “Will return,” it’s largely correct, but it mislabels as “Won’t return” half of those who did in fact later “Return”).
- Or maybe the model has 60% precision and 60% recall.
These numbers should give you a good sense for how accurate your model is, even if you never actually want to make any predictions.
Precision vs. Recall Curve
Within any one model, you can also decide to emphasize either precision or recall. Maybe you’re very short on sugar cubes and only want to give them out to people you’re very confident will return, so you decide to only give them to customers who are 60% likely to return (instead of 30%).
Our precision will go up because you’ll only hand out sugar cubes when you’re really confident someone “Will return.” Our recall will go down because there will be a lot of folks who ultimately “Return” who you weren’t confident enough to give a sugar cube to.
Precision: 62% —> 80%
Recall: 60% —> 30%
Or, if you’re feeling rich in sugar cubes, you could give them out to anyone with at least a 10% chance of being a returner.
Precision: 62% —> 40%
Recall: 60% —> 90%
You can trace this tradeoff between precision and recall with this chart:
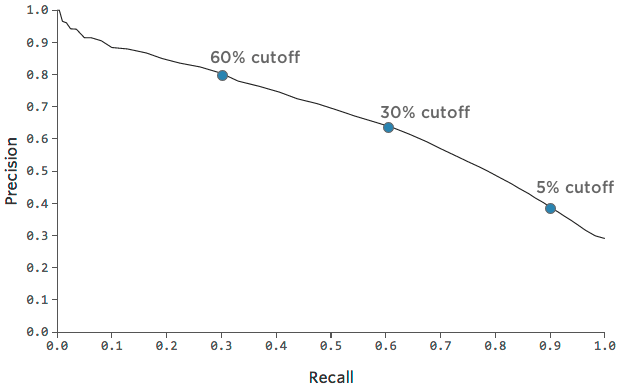
It can be helpful to pick a point on the chart that represents a nice mix of precision and recall, and then get a sense of how accurate the model is at that point.