
Ticket Reporting Datasets
What's on this page
About Ticket Reporting Datasets
Ticket reporting datasets are the ticket fields you can report on in your dashboards; this includes information like status, ticket owner, priority, and so on, but it also includes various ticket data.
Based on your organization’s needs, you can make multiple, separate ticket reporting datasets. This is so you can separate ticket data by the different programs or teams working out of your Qualtrics brand, limit the number of fields each team has to navigate through, and restrict a user’s access to data based on the program they belong to.
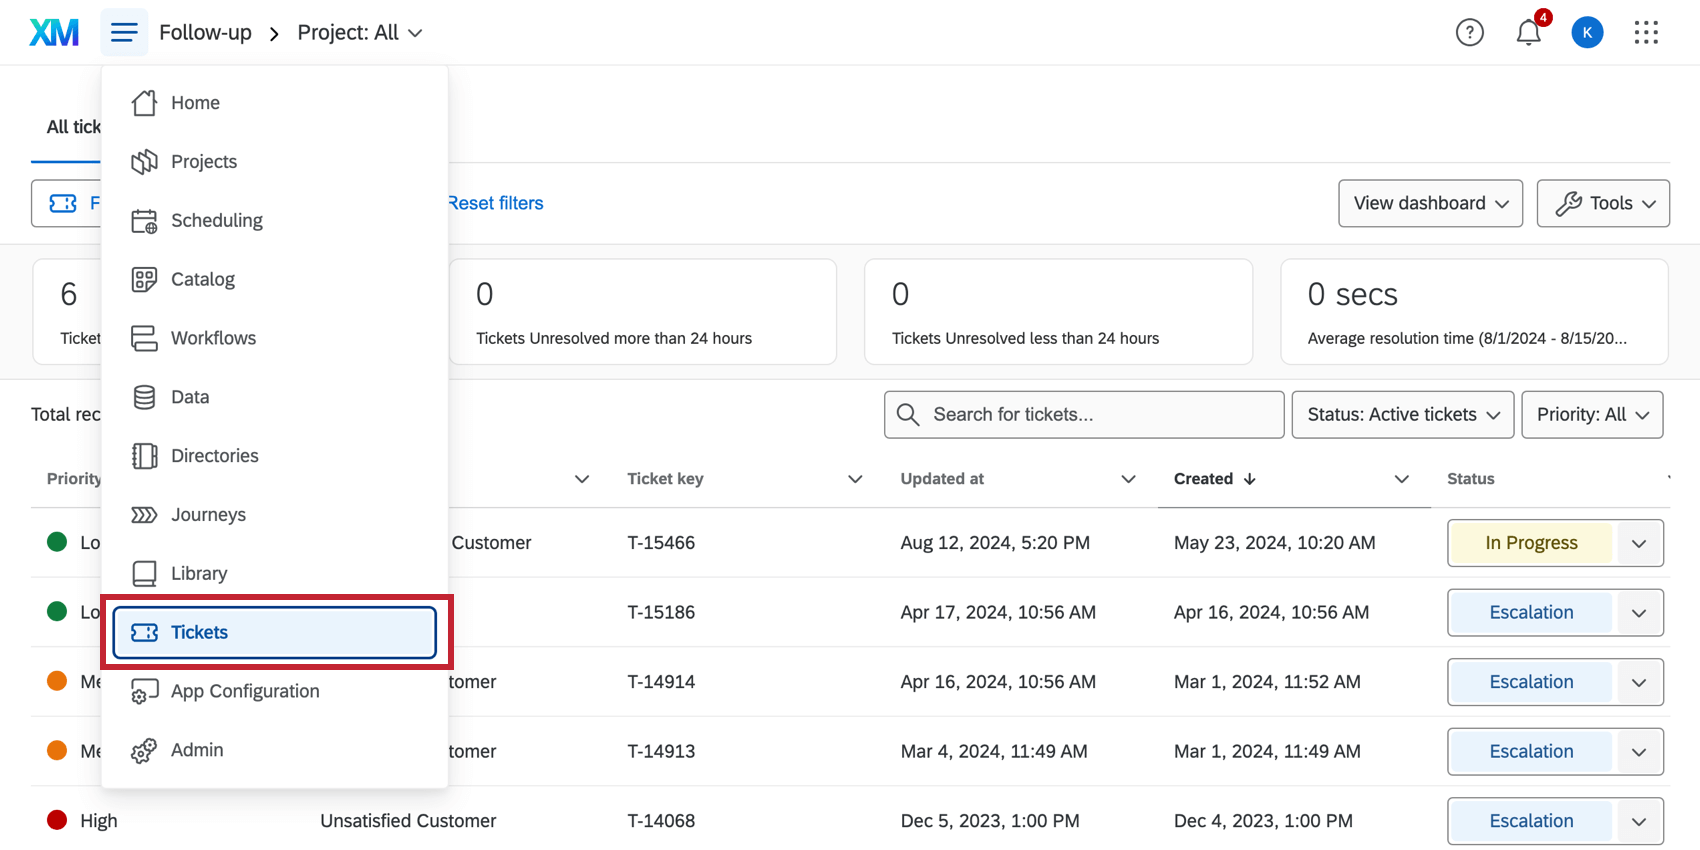
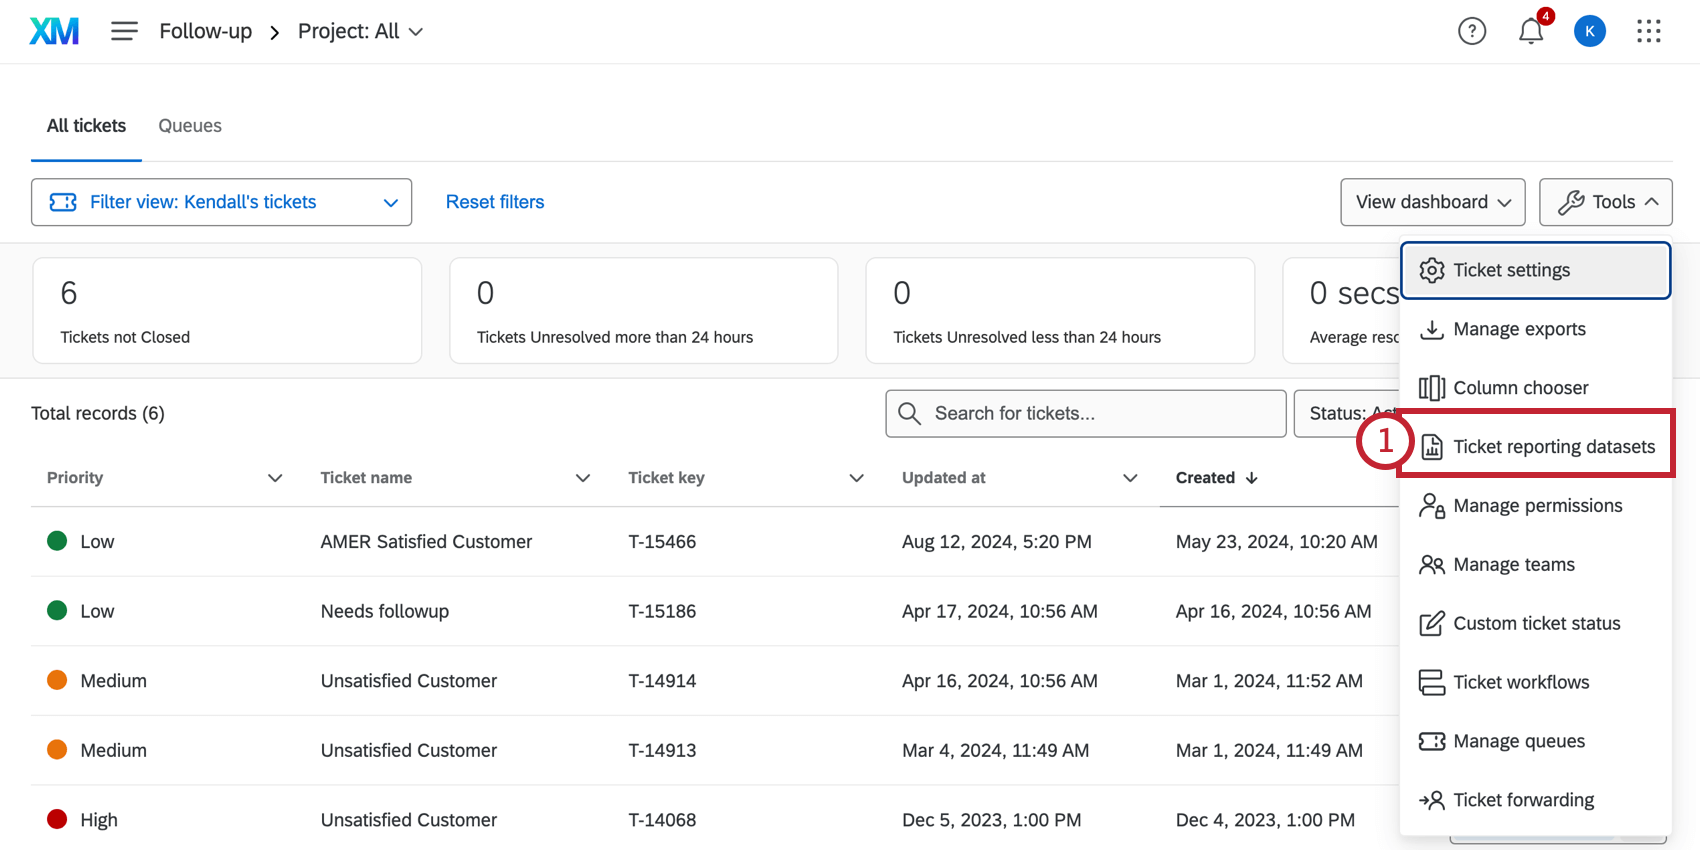
This feature is only available to Brand Administrators, CX Administrators, or users with Qualtrics Ticket Admin permission enabled.
Qtip: This feature moved ticket data mapping from the dashboard to the Follow Up page.
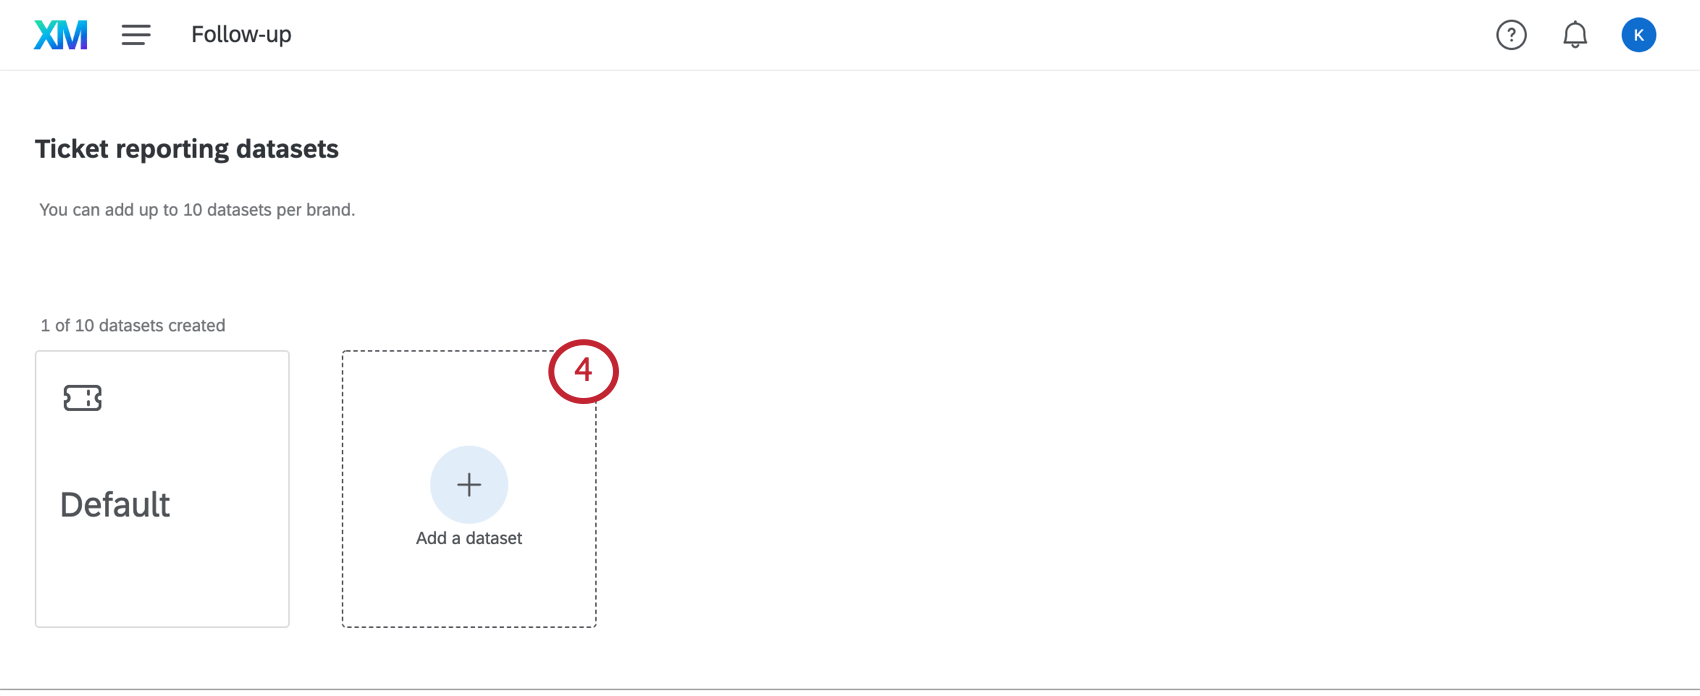
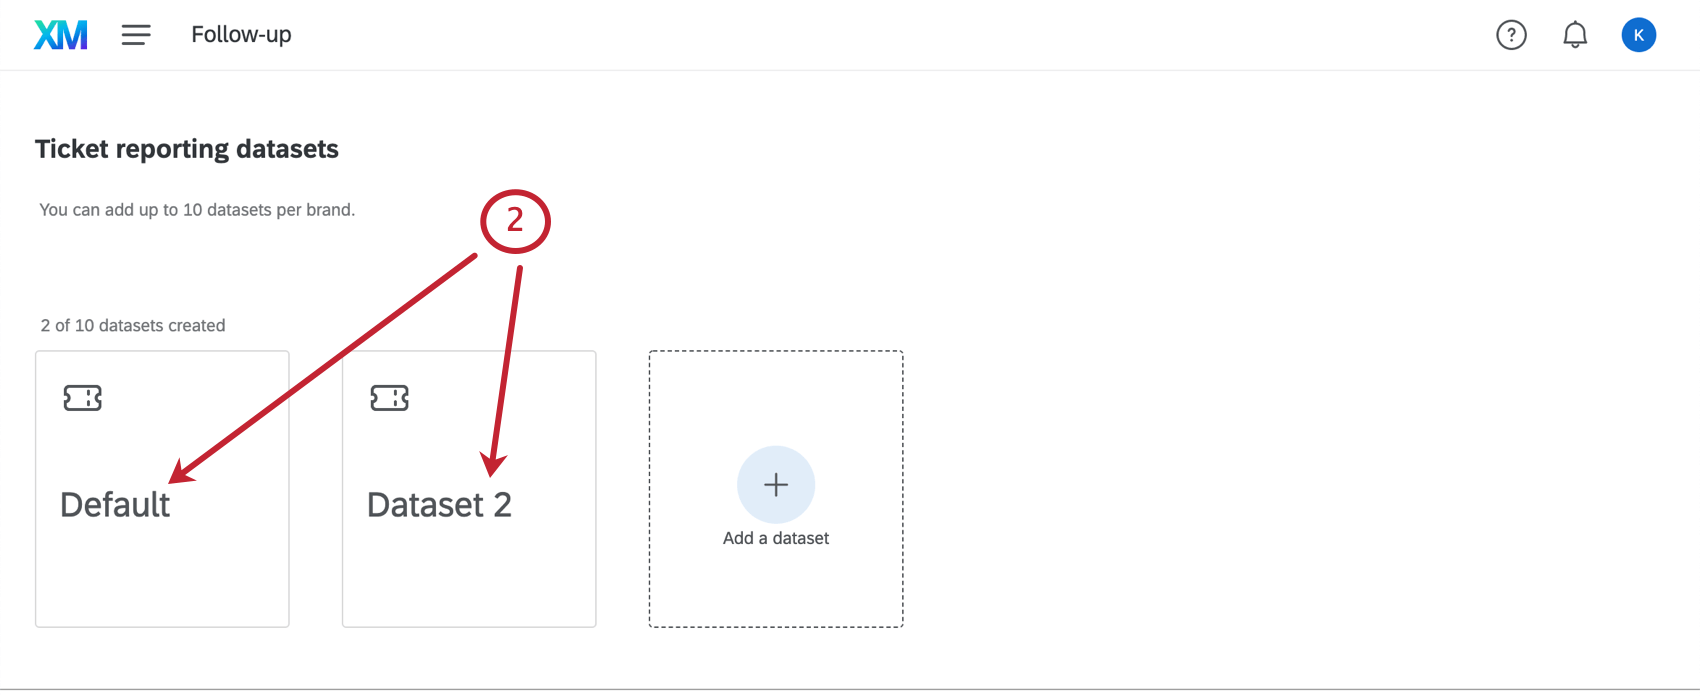
Attention: You can have a maximum of 10 ticket reporting datasets across your organization.
Creating Ticket Reporting Datasets
Using the Default Dataset
The default dataset is created when ticket reporting is enabled for your brand. If your brand had ticketing enabled but not ticket reporting, then any tickets created before ticket reporting was enabled will not be included in the default dataset. To incorporate tickets created before the dataset was generated, you can adjust the tickets’ statuses.
You can use the default dataset in your dashboard if it contains all the fields you need for your reporting. However, if you need to display additional fields in your dashboard, then create a custom dataset.
Using Custom Datasets
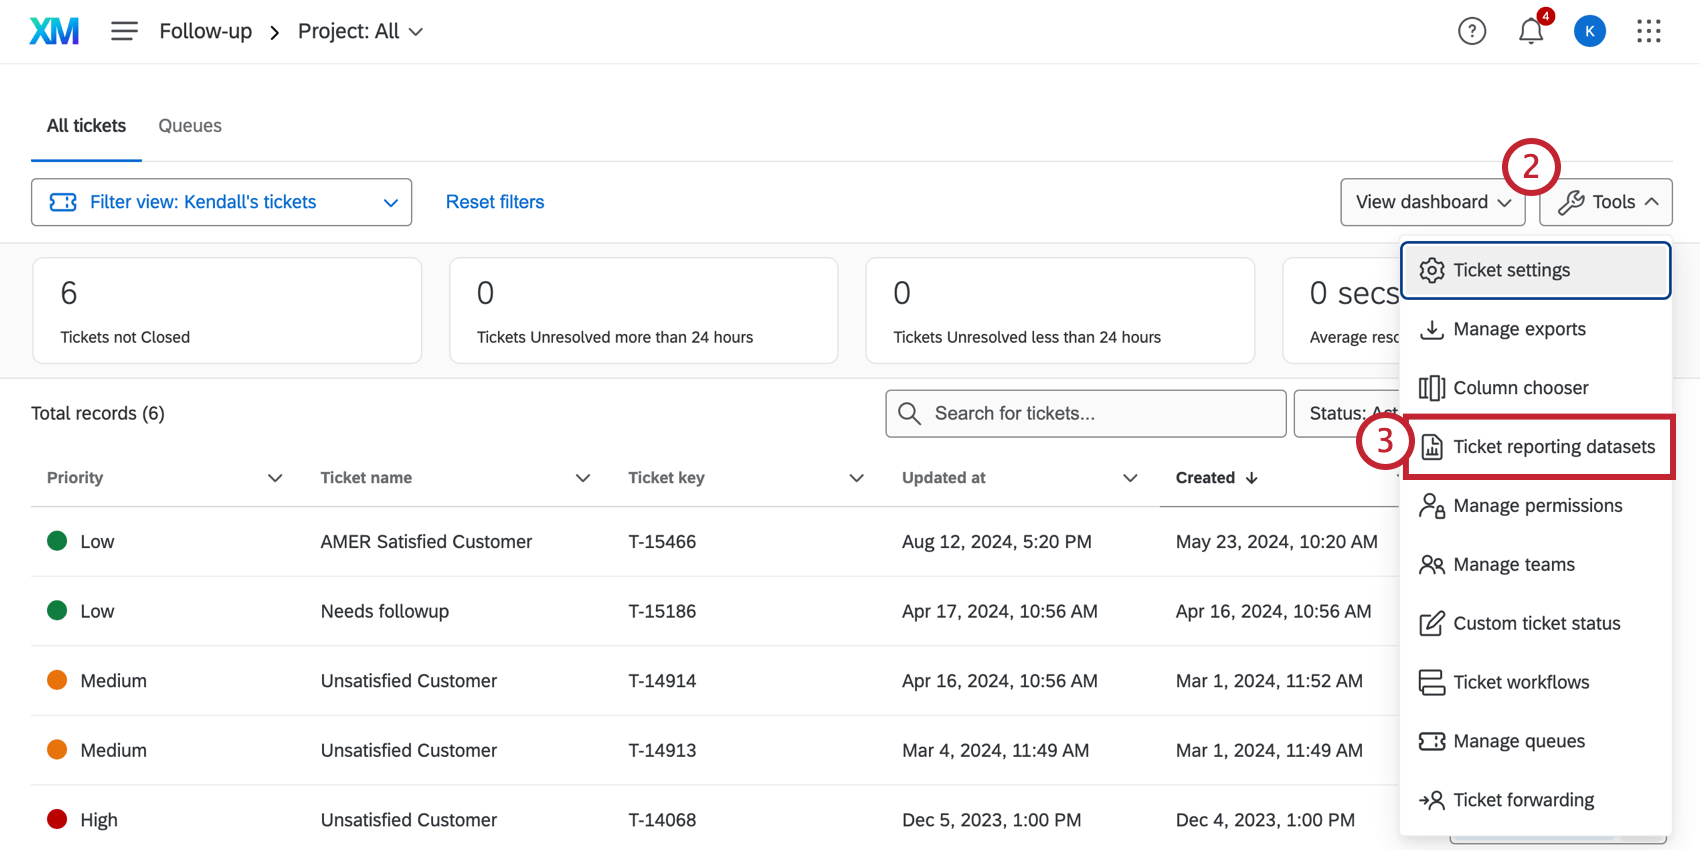
Before you can set up ticket reporting, you must create a ticket reporting dataset.
Ticket data starts being recorded the moment the first dataset is created, meaning that when this is mapped to a dashboard, the data starts on the date of dataset creation. Once a dataset is created, the ticket data for all fields in the dataset will be available to use in a dashboard. If you create additional datasets and those datasets reuse fields from a previous dataset, then the data from those fields will be readily available to use in a dashboard. Any newly added fields that do not exist in any other datasets will not have data available to use in the dashboard until a ticket with that field is created or updated.
Qtip: If you have used ticket reporting before, there will be at least one ticket reporting dataset to start.
Qtip: See the Ticket Data Restrictions section for more detailed steps.
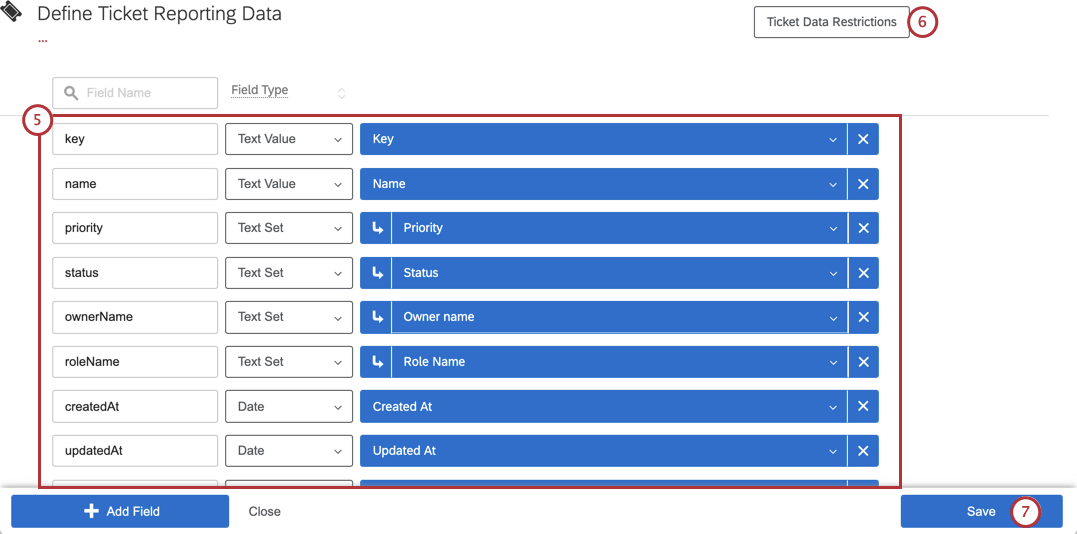
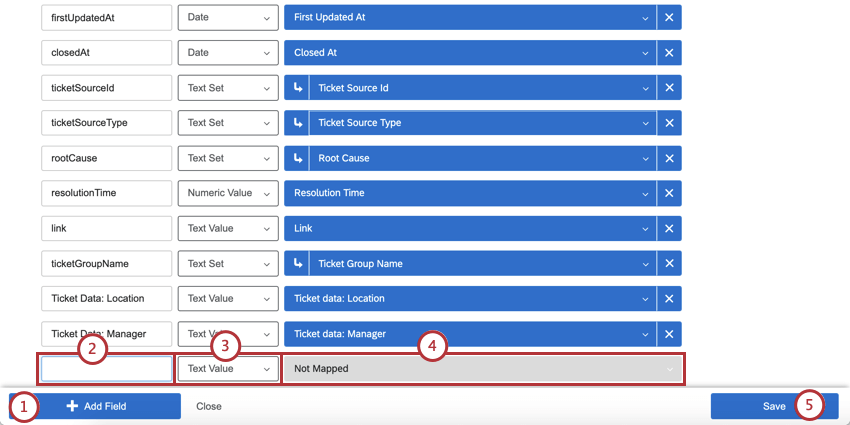
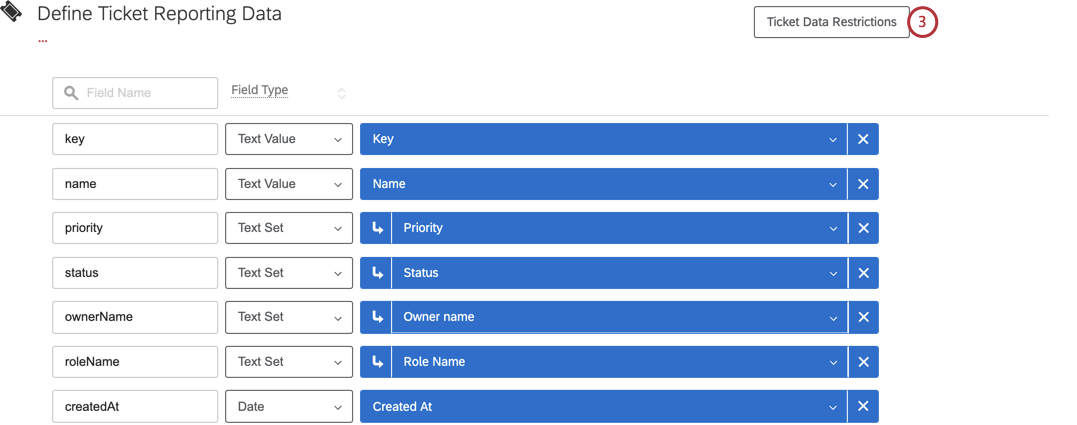
Mapping Ticket Fields
See a list of all available metadata fields.
Qtip: Any edits you make to a field will not be reflected in other datasets where that field occurs. Edits are always dataset-exclusive.
Attention: A ticket must be created with your new ticket data field before you will be able to add it to a ticket reporting dataset. For example, if you add a ticket data field to a ticket and immediately try to map it to a ticket dataset, you will not be able to select the new ticket data field. Once a ticket using the new ticket data field is created, you’ll be able to add it to a ticket reporting dataset.
Qtip: Field types define the type of data mapped into the field and consequently determine which widgets will be available for each field. If you don’t see your desired Field Name when selecting the source of a widget, you may need to change the field type or use a different widget. Be aware that changing Field Types can break widgets on any Dashboard using the affected fields. As such, we often recommend adding a new field that maps to the same question rather than editing the Field Type or Field Mapping of existing Fields (e.g., you may have a Text Set field for a NPS group as well as a separate Number Set field for a NPS value).
Moving and Removing Fields
Hover over a field. The move icon to the left can be used to drag and drop the field around the mapper. The delete icon ( X ) can be used to remove the field from the ticket reporting dataset.
Qtip: Removing fields from your mapper will affect all widgets using fields from that dataset. You will also affect which users are able to edit, use, or view those fields in that dataset. It will not affect the data saved with tickets themselves.
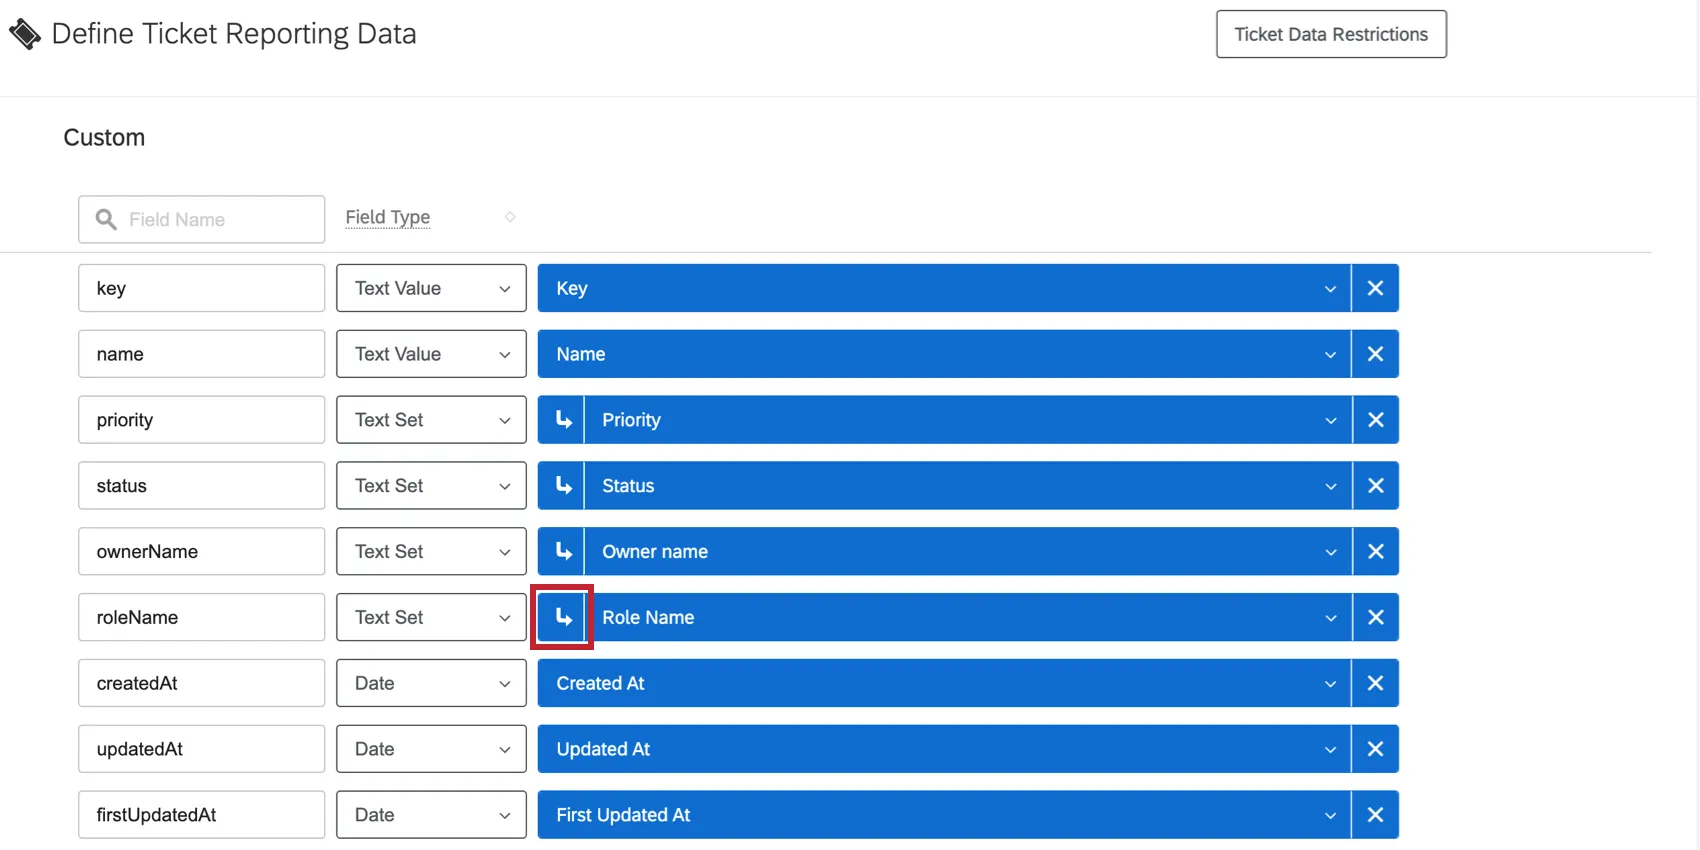
Recoding Ticket Data
If the values of your ticket fields don’t look correct – for example, labels being misspelled or wrongly capitalized on the dashboard, or numeric values not aligning as expected – you can recode them. To do so, open a ticket reporting dataset, find the field that you want to recode, and click the arrow to open the recode editor. Note that not all fields can be recoded.
In the Recode Editor window that opens, specify the fields and their values. On the left, under Label, include the value as it currently appears in the ticket data (i.e., on the dashboard). On the right, under Recode, enter what you want to correct the value to.
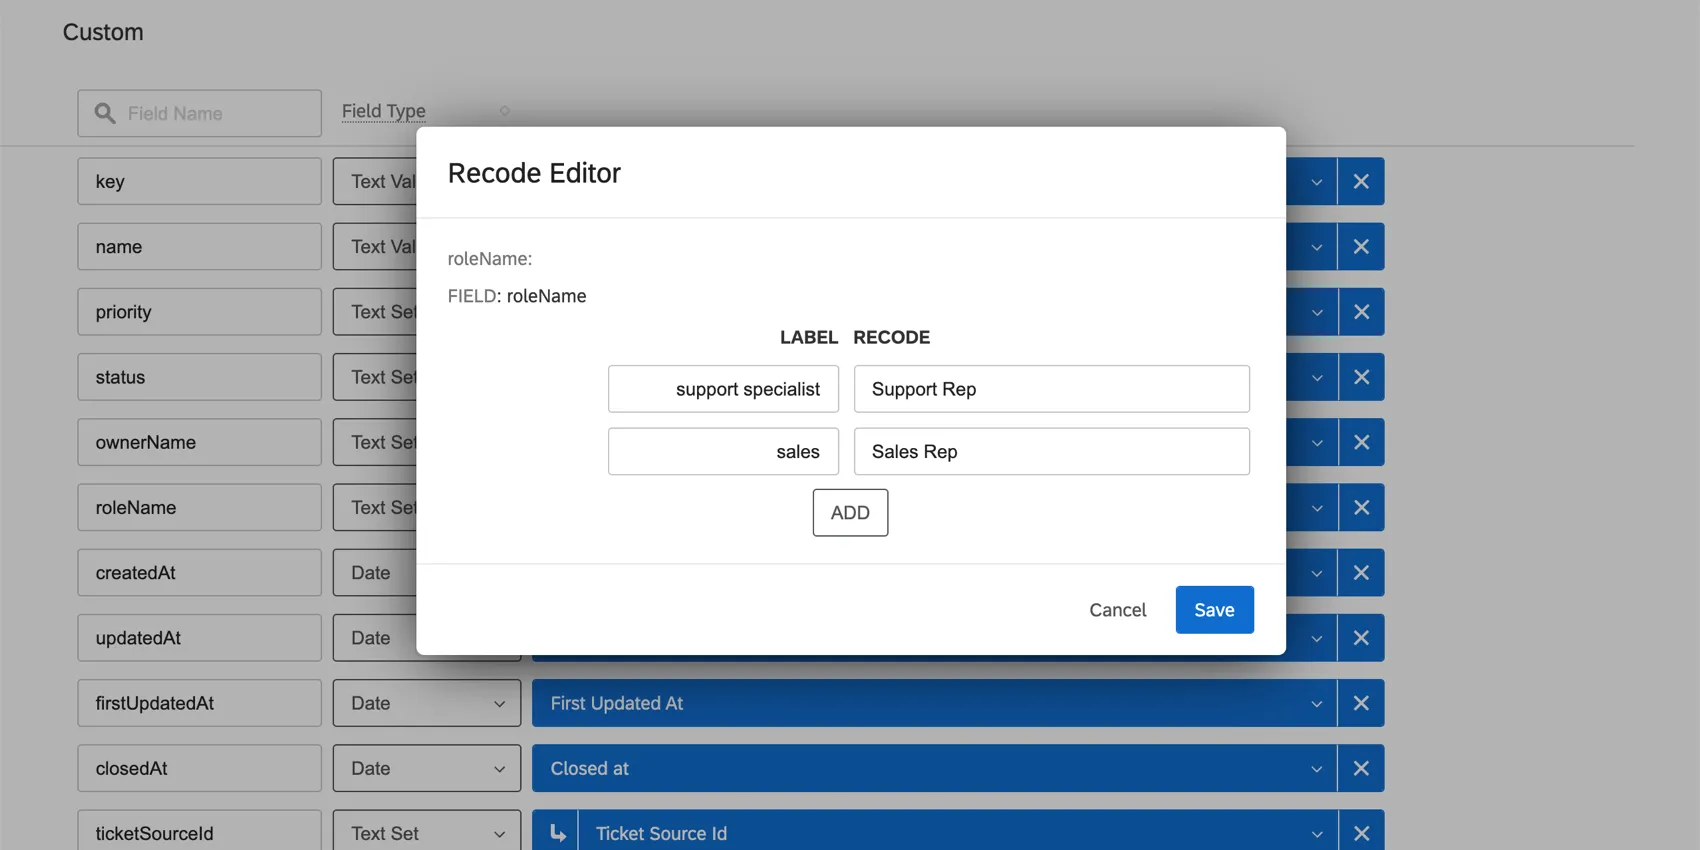
Recoding ticket fields works similarly to recoding fields in the Dashboard Data tab.
Ticket Data Field Types
Field types help you define the format of the data so the dashboard knows what widgets it can be added to. Field types for ticket data are similar to the field types for other dashboard data, but with a few key differences.
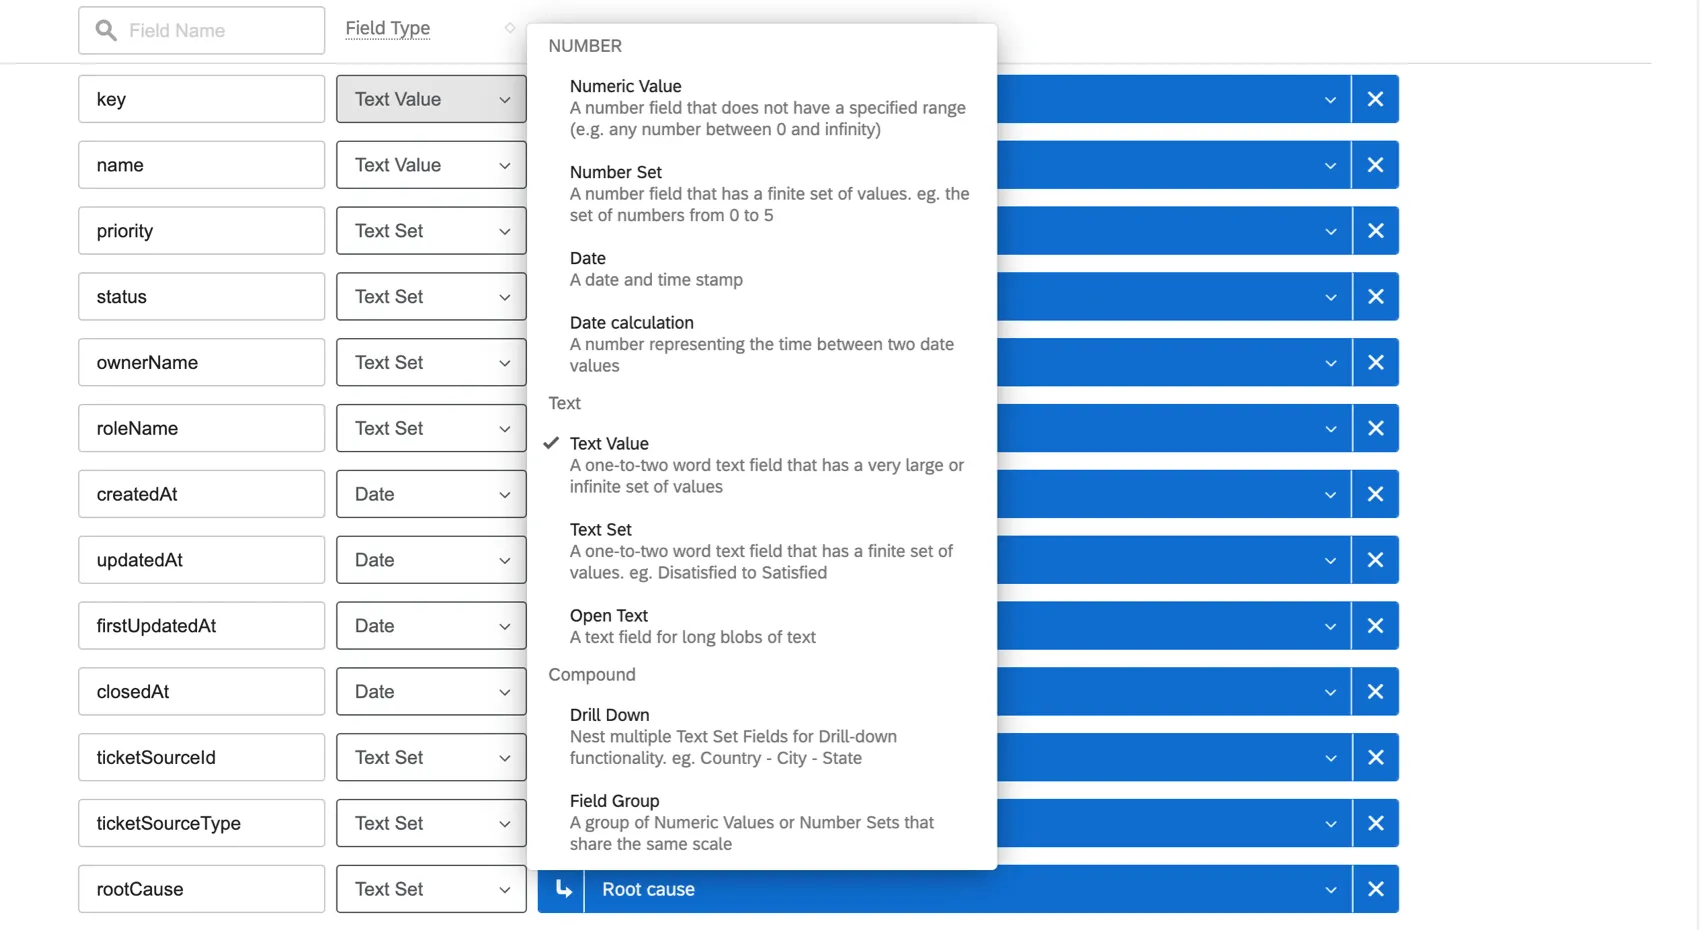
- Date Calculation: Create custom fields that allow you to measure the time between different ticket statuses. See Time Between Ticket Statuses for more details. Anything you create here will generally have the same widget compatibilities as regular date fields.
- Drill Down: Nests multiple text set fields to allow you to drill into multiple levels of data. Corresponds to drill down field groups in the dashboard data editor.
- Field Group: A group of numeric values or number sets with the same scale. Corresponds to measure groups in the dashboard data editor.
- No Multi-Answer Text Set option.
You can consult the Field Type & Widget Compatibility Table when deciding what widgets to build with the data available.
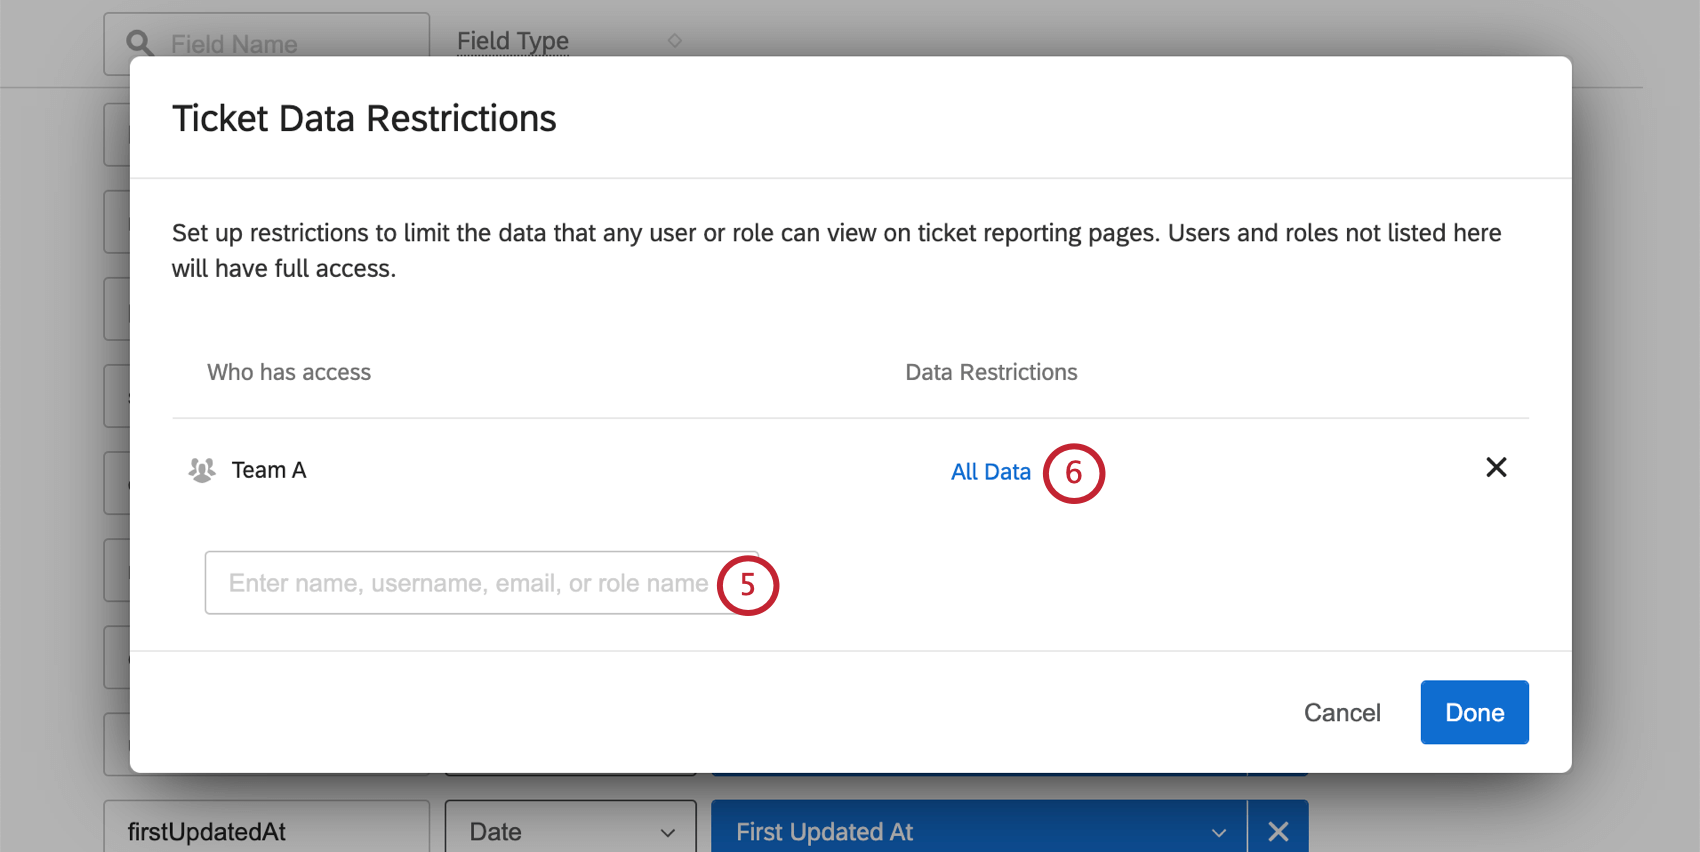
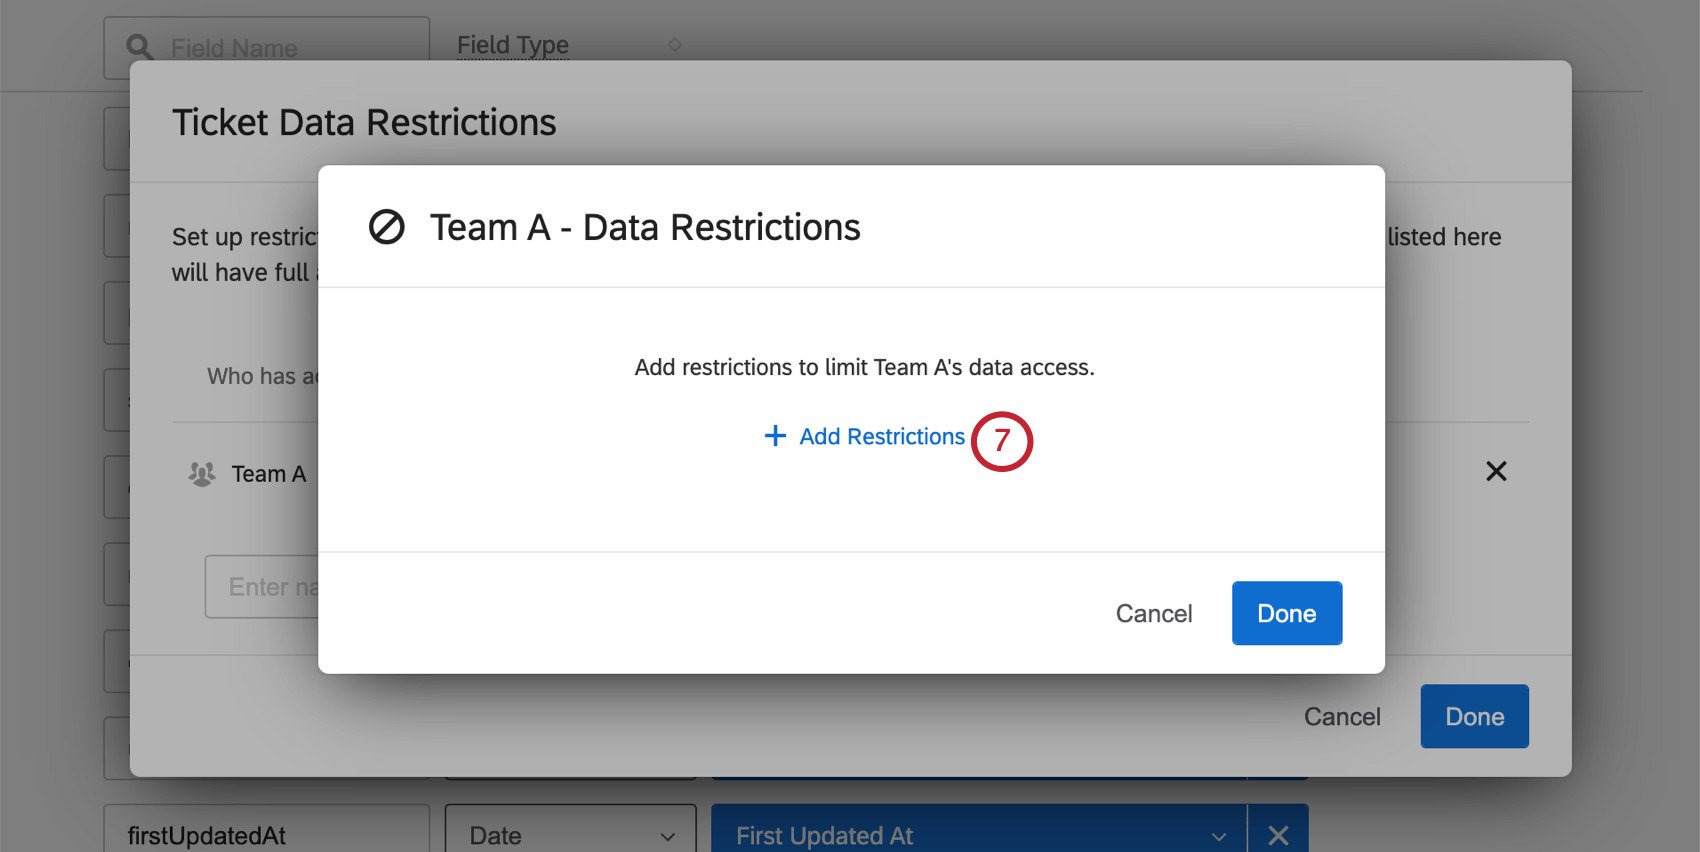
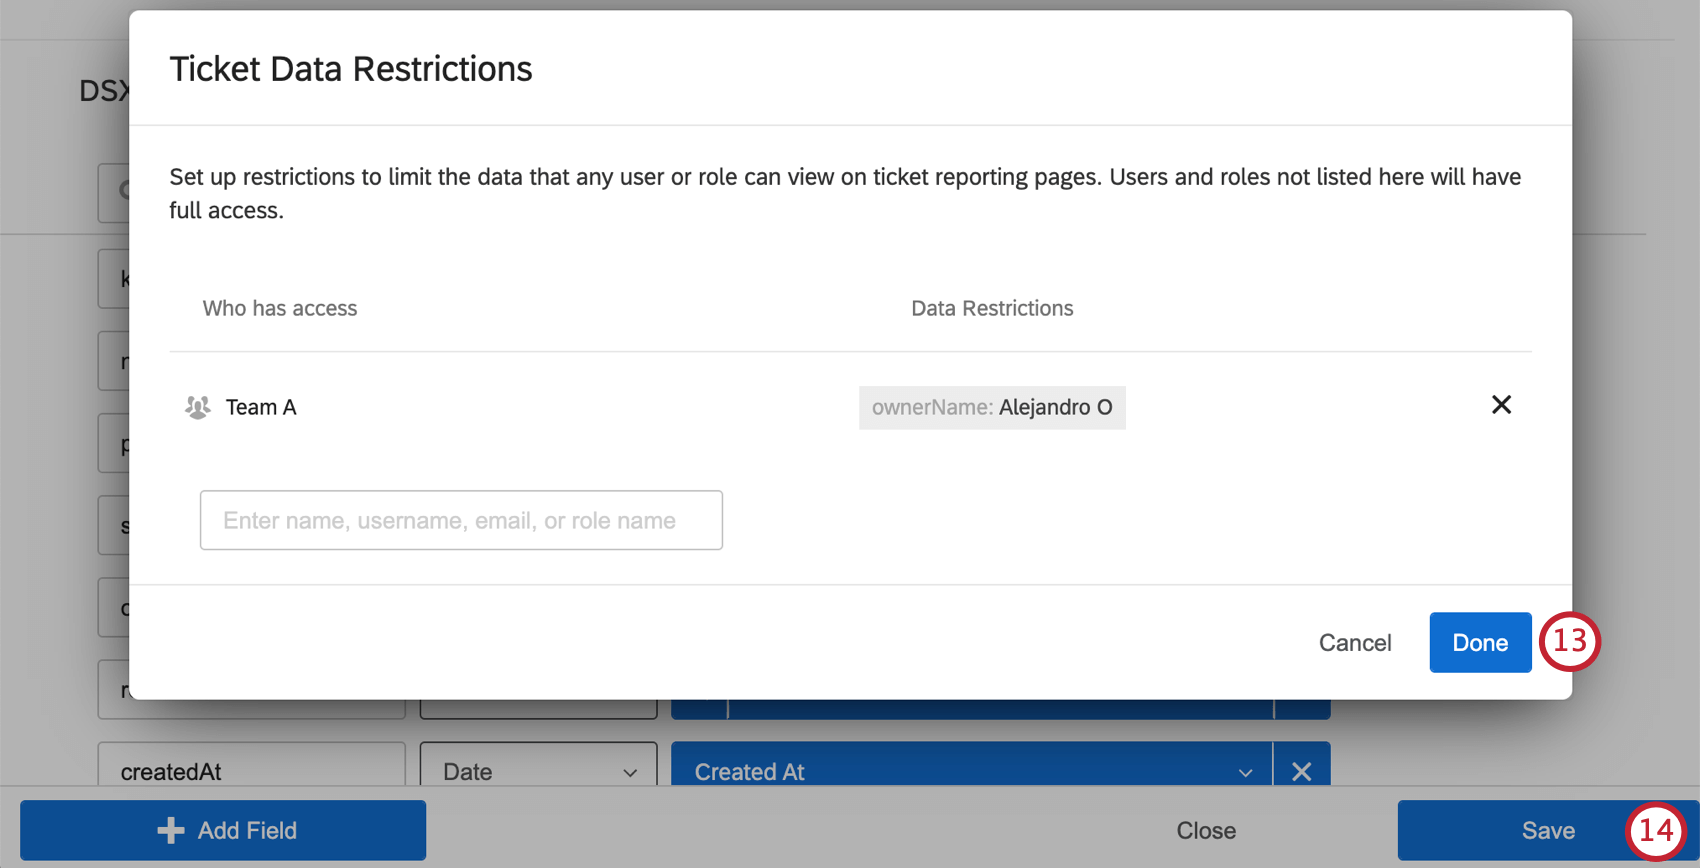
Ticket Data Restrictions
By default, all users and roles have access to all ticket reporting data. However, you can create ticket data restrictions to limit access to this data.
Attention: All users in the brand are able to export ticket reporting data. Changing export permissions for the dashboard will only affect exports of dashboard data and will not affect the ability to export ticket data.
Qtip: This works similarly to other data restrictions.
Qtip: Be thoughtful about the ticket data you allow users to access. If there are sensitive ticket fields you don’t want shown to users, consider limiting access with ticket data restrictions.
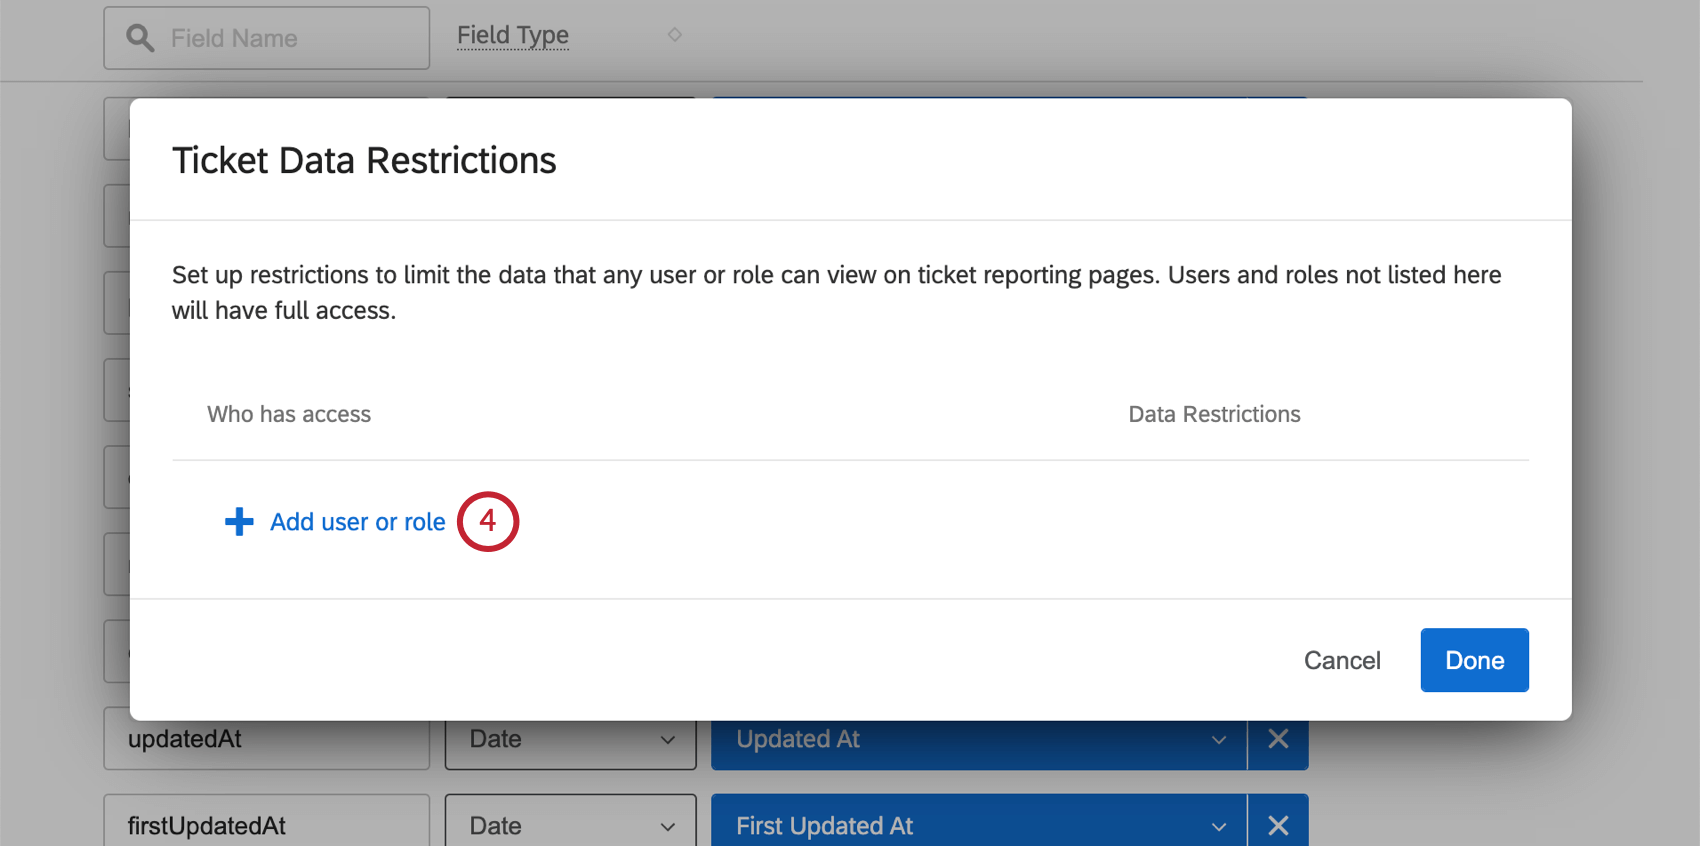
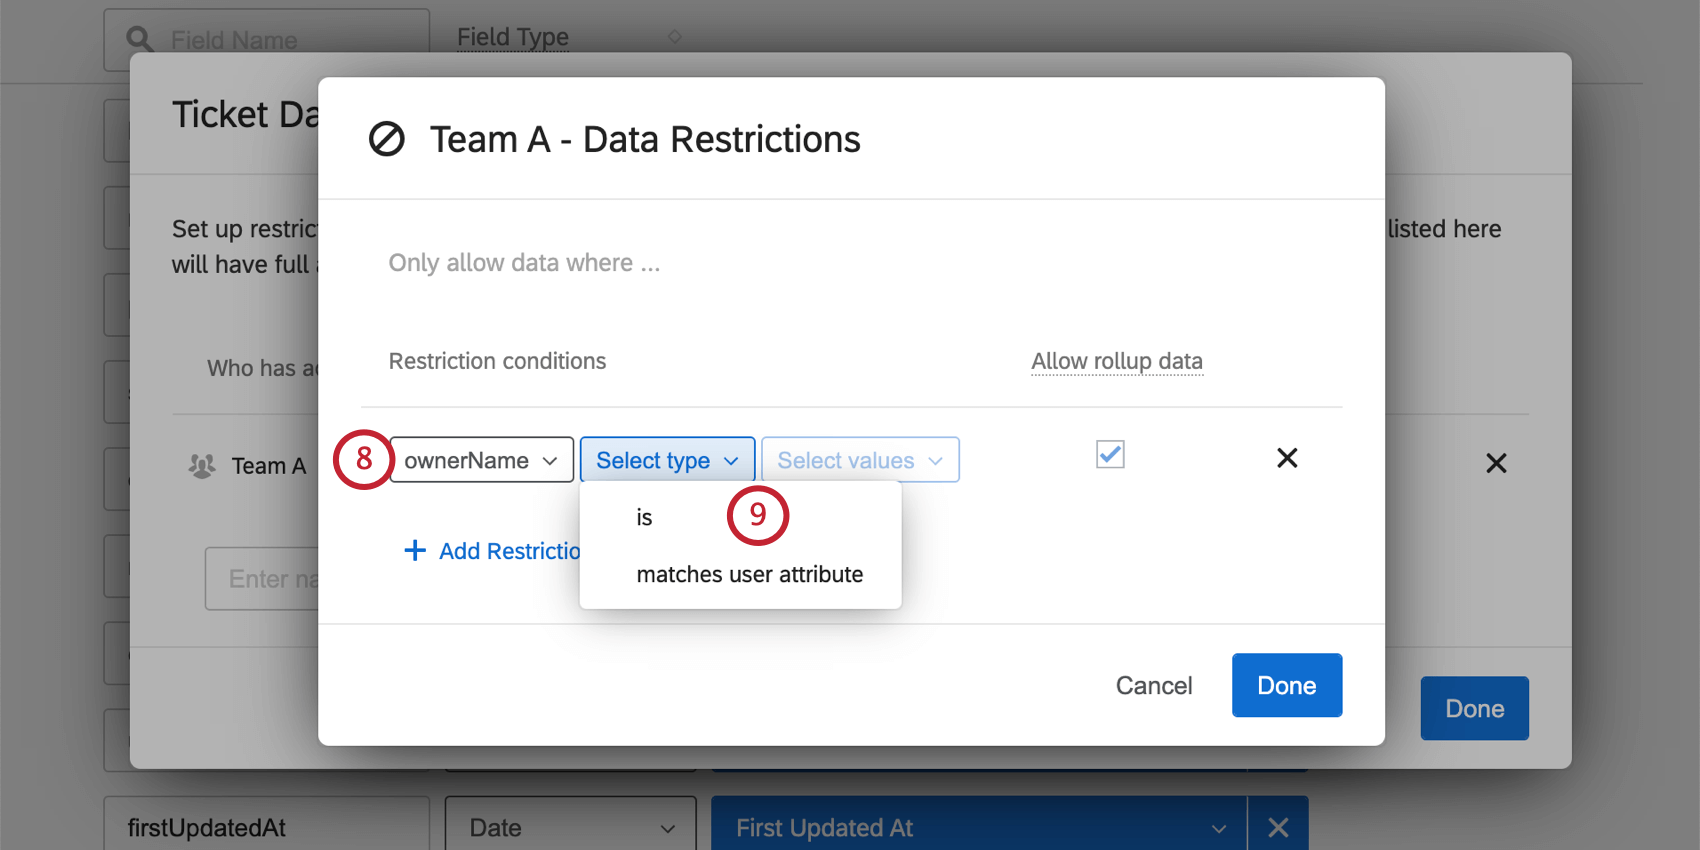
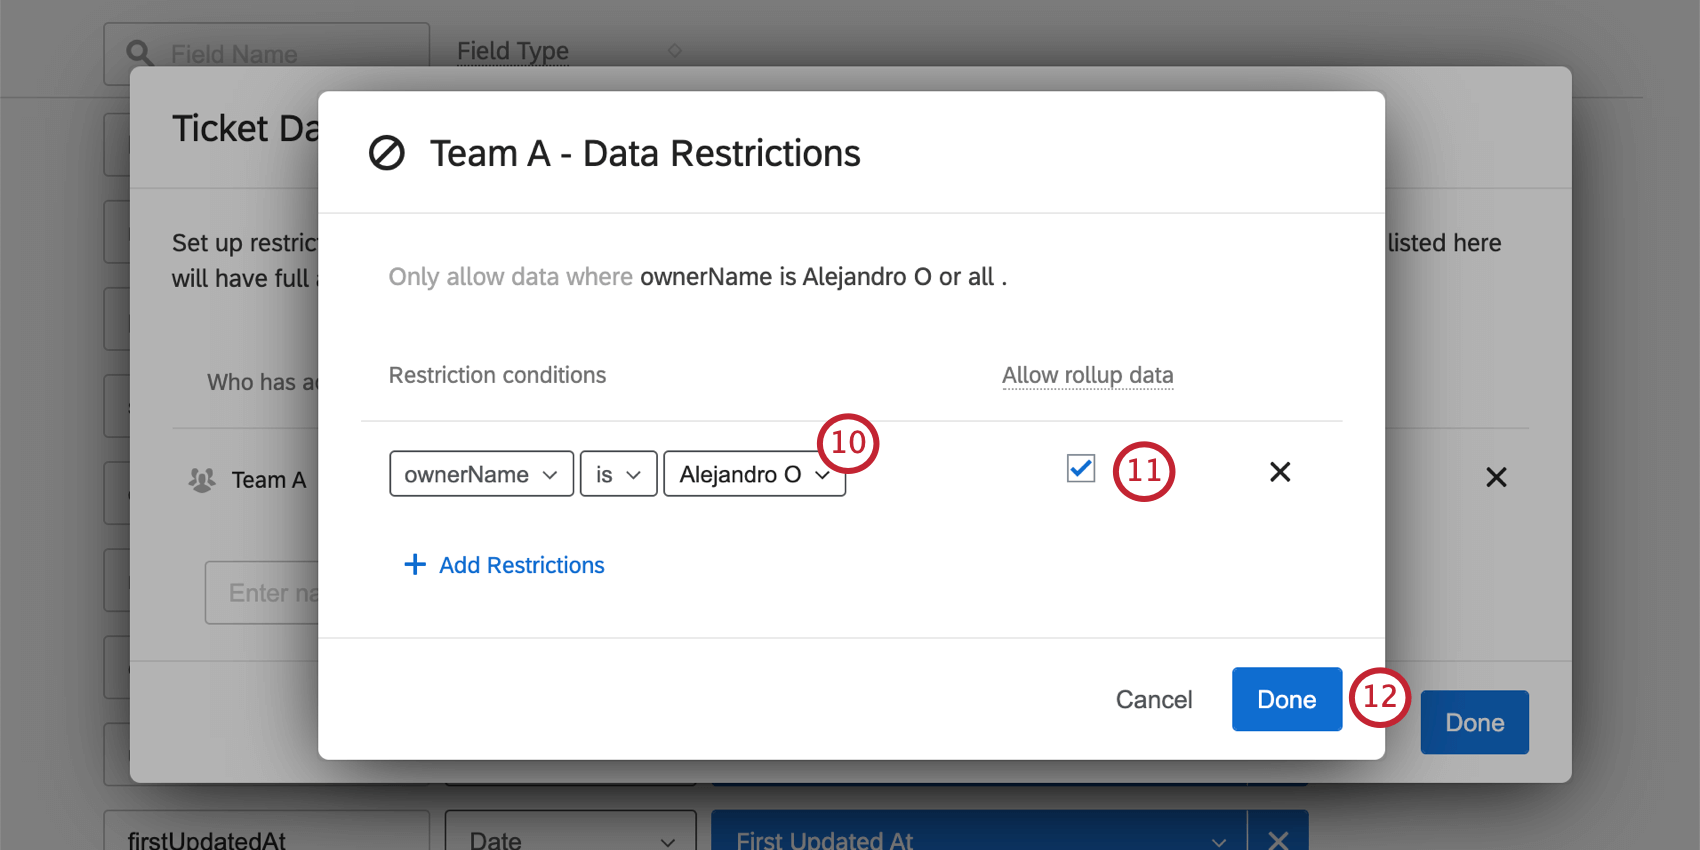
- Is: Enter a static value the ticket field has to match.
- Matches user attribute: Determine a User Attribute that the ticket field has to match. This is best for values that vary by user.
Using Ticket Reporting Datasets in Dashboards
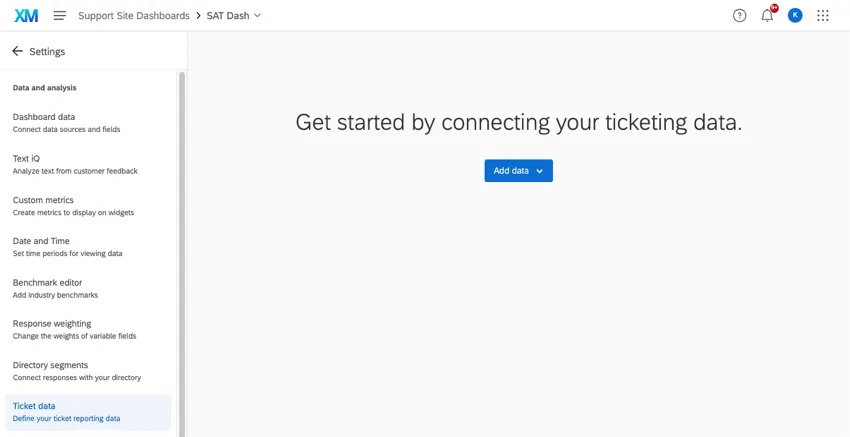
Once ticket reporting datasets have been assigned to a user, they can go to the Ticket Data section of the dashboard settings to select the dataset they’d like to use in their dashboard. Click Add data to get started.
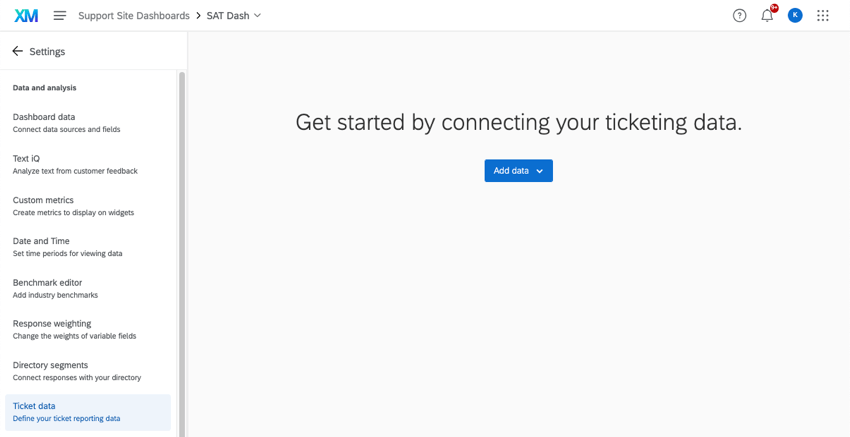
The user can then proceed to create a ticket reporting page and add widgets to it.
Qtip: If a ticket dataset you were using is deleted, you’ll have the opportunity to choose a new dataset, and will once again see the “Get started” screen shown above. If the previous ticket dataset is deleted, you will need to manually fix any widgets you added to ticket reporting pages so they match the new dataset.
Swapping and Editing Datasets
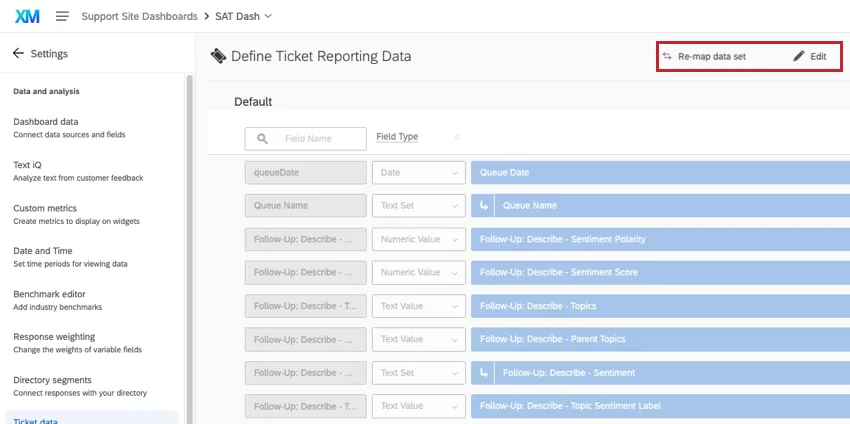
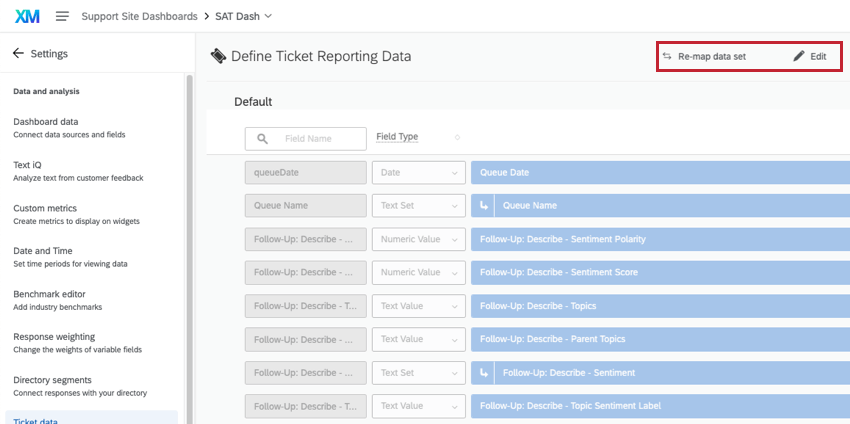
Once you’ve selected a dataset, you’ll be able to see the list of fields, but not edit them. To edit fields, use the Edit button in the upper-right. You’ll be taken to the dataset editor on the Follow Up page.
To switch your dashboard to a different ticket dataset, click Re-map the data set.
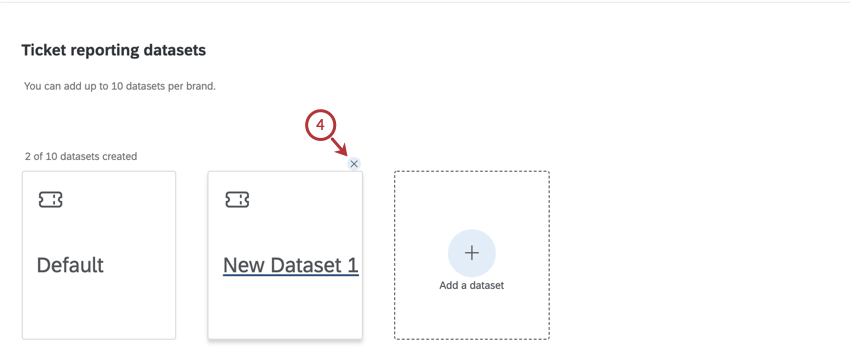
Removing Ticket Reporting Datasets
Warning: Once you delete a dataset, its restrictions and customization cannot be retrieved. Only delete a dataset if you’re absolutely sure that’s what you want to do. You cannot delete the default dataset.
Editing Existing Ticket Reporting Datasets

That's great! Thank you for your feedback!
Thank you for your feedback!