
Simple Table (Results)
What's on this page
Qtip: There is a new version of Results available. To opt in to the new Results Dashboards, navigate to the Results tab and click Try it now.

About Simple Tables
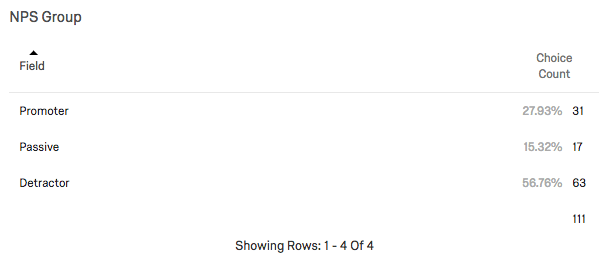
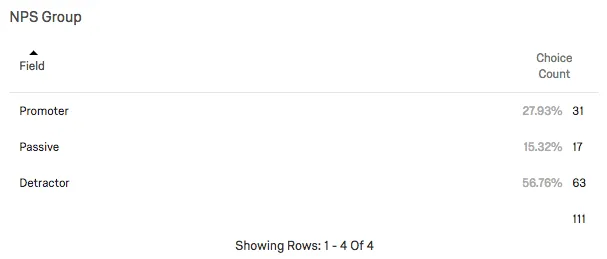
Simple Table visualizations allow you to view basic information about a selected metric for a given data source. By default, the Simple Table displays the name of each answer option, the percentage, count of the number of respondents who selected or were assigned the option, and the total number of responses.
Qtip: Depending on the type of question or field being displayed, the Simple Table might already have a breakout or you might be able to add one.
Customization Options
For general settings, see the Visualizations Overview support page. Read on for settings specific to the Simple Table.
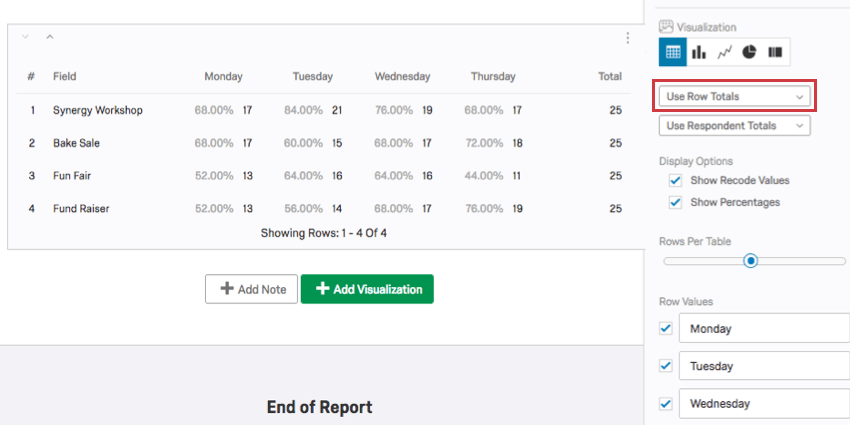
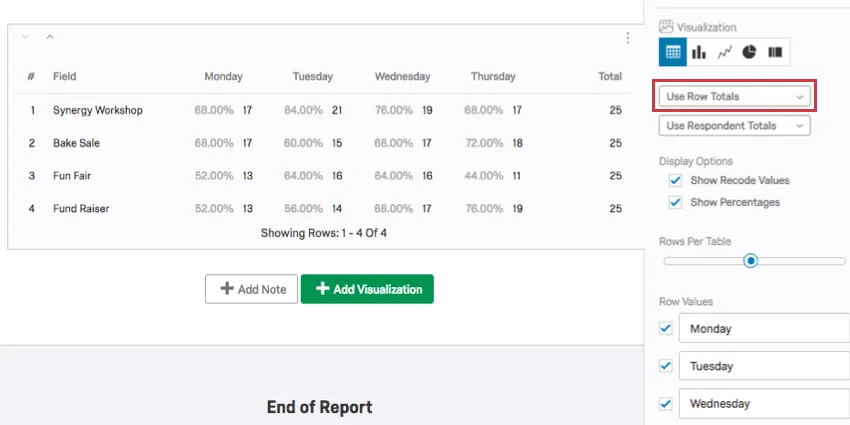
Use Row or Column Totals
This setting can only be changed for questions with two dimensions. For example, Matrix Tables (which have statements and scales), Pick Group and Rank (which have items and groups), and visualizations with a breakout applied.
Selecting Use Row Totals displays totals at the end of the rows.
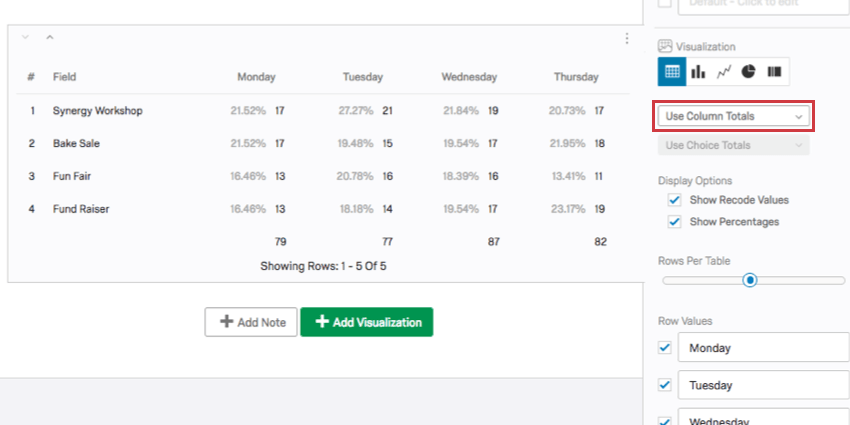
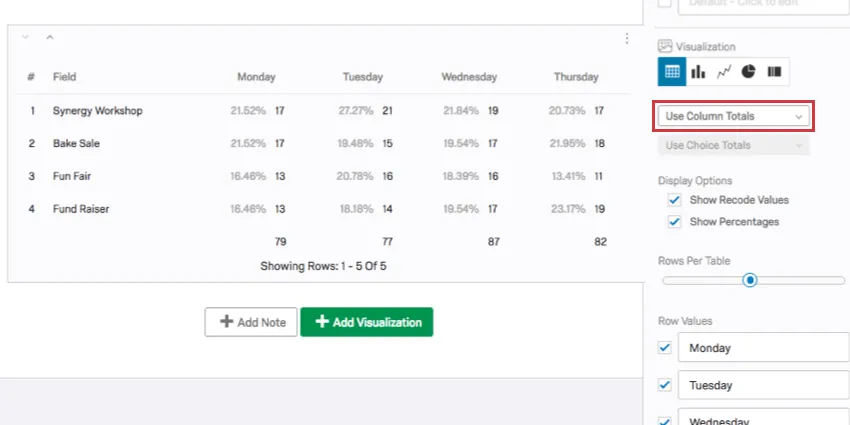
Selecting Use Column Totals displays totals at the bottom of the columns.
Qtip: If your metric is set to Response Count, this option will disappear.
Use Choice or Response Totals
This setting can only be changed for questions with a Multi-Answer setting. For example, if you build a Multiple Choice question where respondents can “select all that apply.”
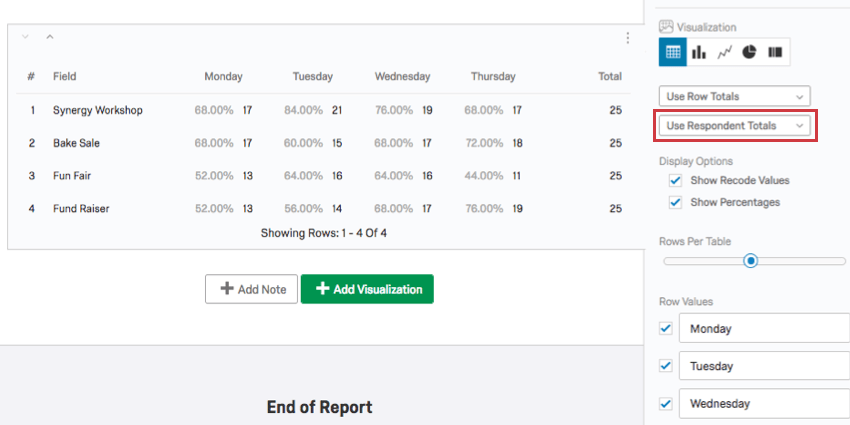
In a question where each respondent can select more than one answer, the percentage of times a choice is selected will differ widely from the percentage of respondents who choose an answer. This dropdown gives you the opportunity to choose between two options: Use Respondent Totals or Use Choice Totals.
- Selecting Use Respondent Totals will use the number of respondents who answered your survey as the denominator when calculating the percentage.
- Selecting Use Choice Totals will use the number of selected choices across all responses as the denominator when calculating the percentage.

Qtip: If your metric is set to Response Count, this option will disappear.
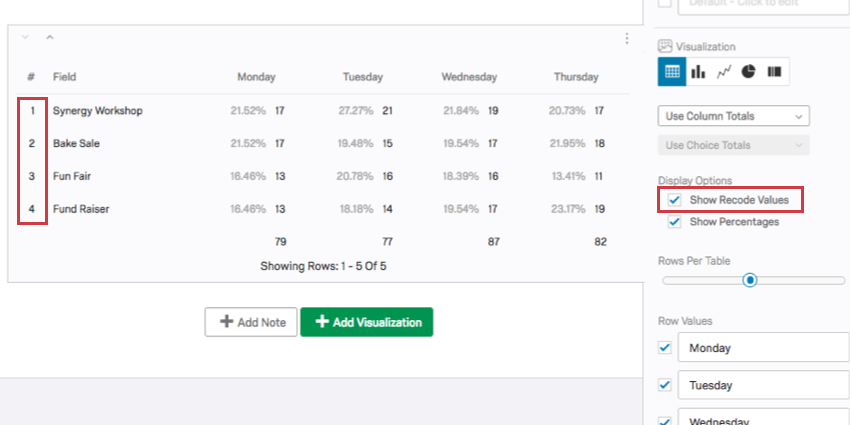
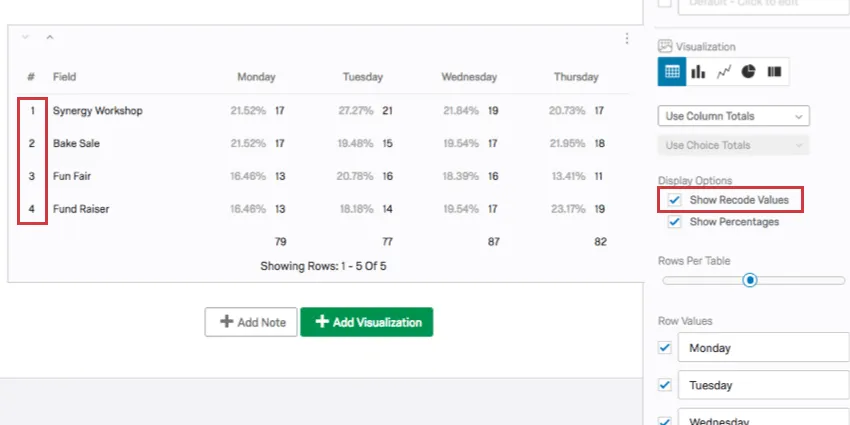
Show Recode Values
The recode value for each answer choice will be displayed when enabled.
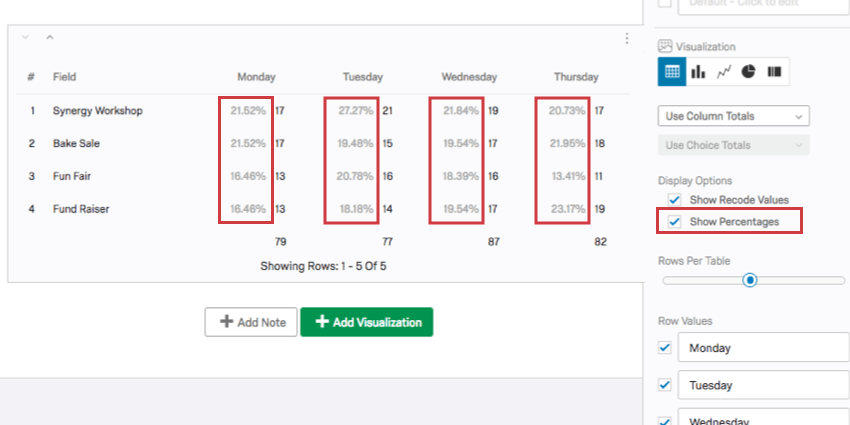
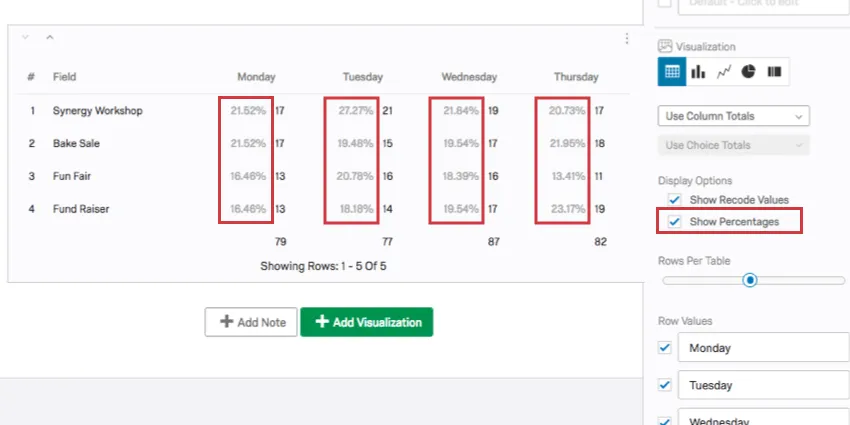
Show Percentages
Each answer choices option will be shown as a percent of the total responses. This option goes away if your metric is set to Percentage.
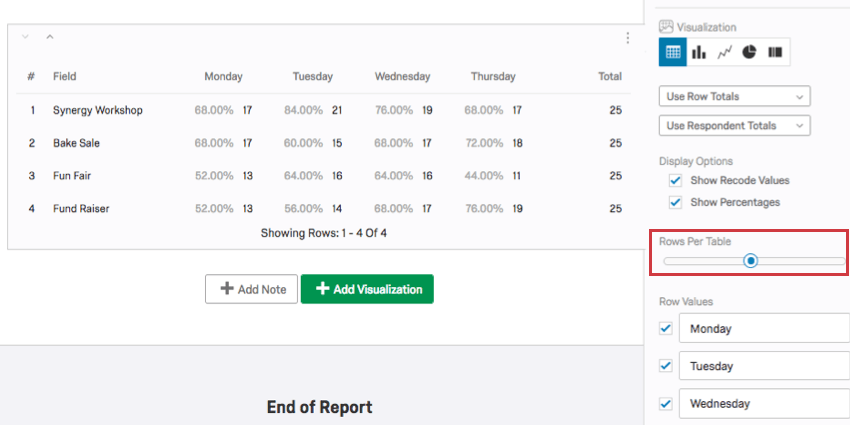
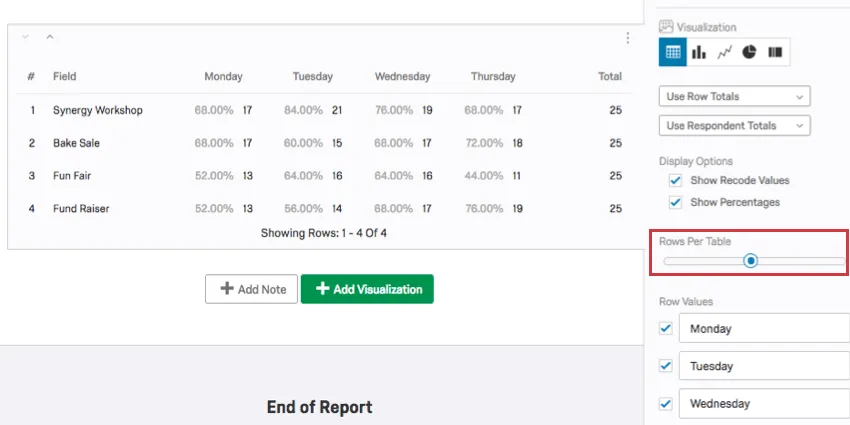
Rows Per Table
For longer tables, you can adjust how many rows display by dragging the slider.
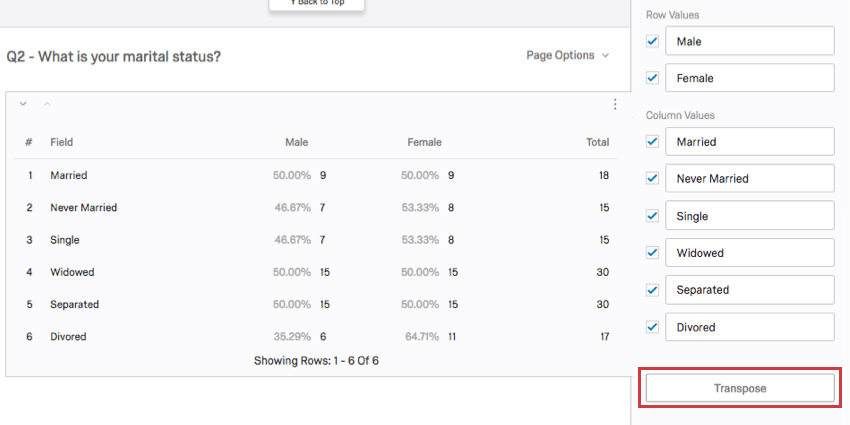
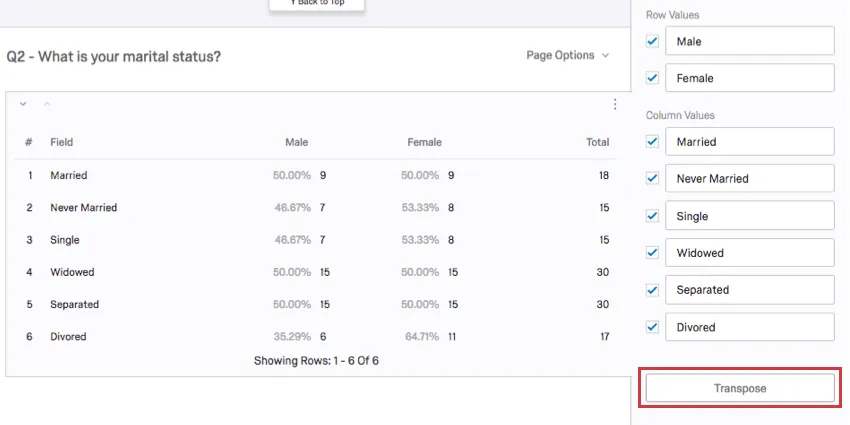
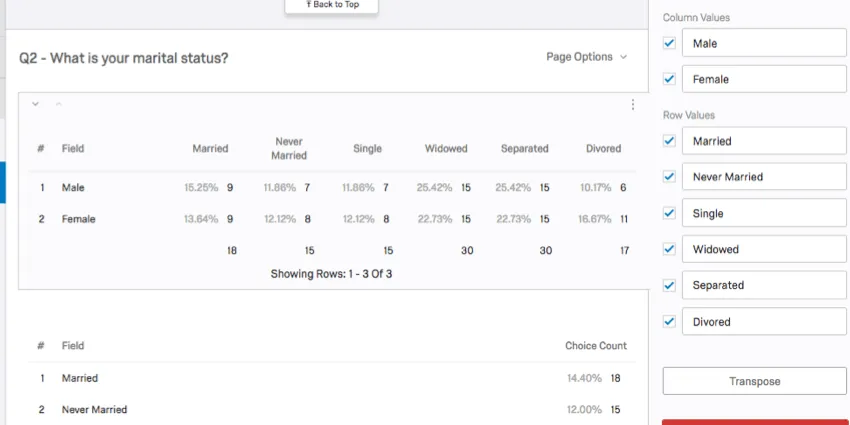
Transpose
Whenever you apply a breakout to a Simple Table, the visualization is broken into columns (the question set in the data source) and rows (question you break out by). Questions with two dimensions, such as Matrix Tables, which have statements and scale points, will also have rows and columns.
To switch your rows and columns, click the Transpose button.
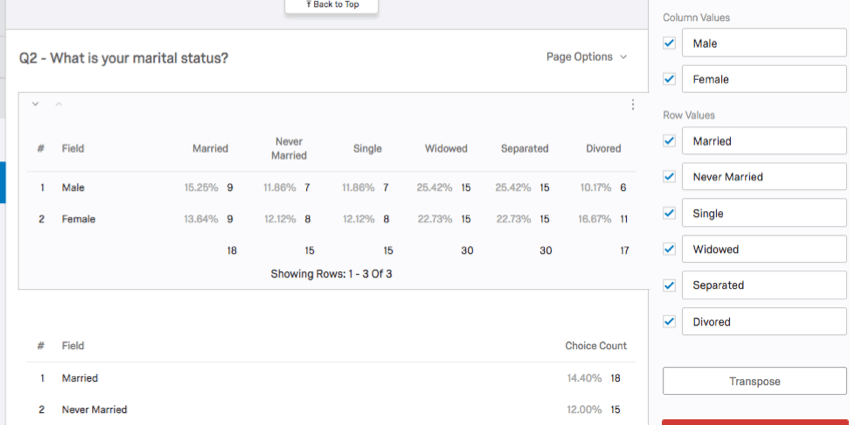
Incompatible Fields
Simple Tables are compatible with almost every kind of variable in Qualtrics because they can display both discrete data (e.g., a finite, five point scale) and continuous data (e.g., a question where respondents type in their age). This includes most question types, survey metadata, Embedded Data, and custom variables, such as Formulas or Bucketed variables.
Below are the few variables Simple Tables are not compatible with:
- Text Entry questions lacking numeric validation
- Form field questions lacking numeric validation
- Open text fields on other questions, such as Text Entry Matrix Tables, text entry columns on Side by Sides, and “Other” text boxes lacking numeric validation
- Heat Maps with no regions defined
- Signature question
- File Upload
- Filter Only Embedded Data
- Text Embedded Data
- Text manual variables
In general, Simple Tables are incompatible with open text content that is not numeric.
Qtip: Be careful with numeric data collected from open-ended questions and with finite scales that have hundreds of choices. A Simple Table cannot comfortably display hundreds of choices, so for variables like these, it might be better to set your metric as mean or use filters so fewer results are included.
That's great! Thank you for your feedback!
Thank you for your feedback!