Loading...
Skip to article
  • Qualtrics Platform
    Qualtrics Platform
  • Customer Journey Optimizer
    Customer Journey Optimizer
  • XM Discover
    XM Discover
  • Qualtrics Social Connect
    Qualtrics Social Connect

Step 3: Planning Your Dashboard Design (CX)


Was this helpful?


This site is protected by reCAPTCHA and the Google Privacy Policy and Terms of Service apply.

The feedback you submit here is used only to help improve this page.

That’s great! Thank you for your feedback!

Thank you for your feedback!


Dashboards vs. Pages vs. Widgets

A screenshot of a customized dashboard. The pages are listed along the left, where you can navigate between them. The widgets are the different charts and graphs on the page

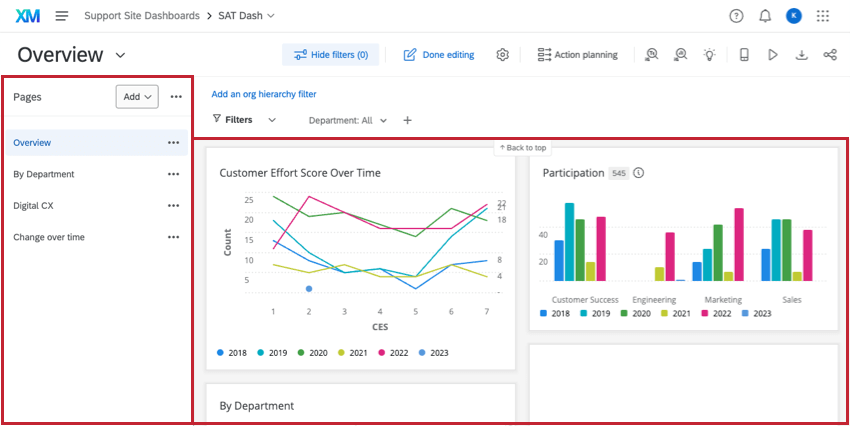
Dashboards pull data sources into charts, tables, and other visualizations called widgets (shown right). These widgets can be organized onto pages of the dashboard (shown left). From there, you can create unlimited dashboards, unlimited pages, and unlimited widgets for any CX Dashboards project.

But should you? You may be asking yourself the following:

  • How many dashboards are too many for a single project?
  • How many pages are too many for a single dashboard?
  • Can a page get so saturated with widgets that a new page is preferable?
  • How do I know if the widgets I want to add are necessary, or if there’s another way to organize my data?

For guidance, we asked an expert at Qualtrics. She has built some of the most complex CX Dashboards projects imaginable. She believes it varies based on the needs of your research program, and has given us insight into her approach.

“I start by gathering the perspectives of the stakeholders and considering the design of their dashboards based on the data sources and the drivers. To get things started, it often makes sense to create:

  • One dashboard per project with a maximum of 5-7 pages, assuming:
    • 1 page for executives
    • 1 page for directors/managers
    • 1 page for the managers’/directors’ direct reports
  • Beyond that, there may be 1 page for ticket reporting

This brings us to five pages and gives some wiggle room for extra pages based on unique reporting objectives and key drivers. For example, it may make sense to roll up several CX Dashboards projects into a single dashboard to better represent a substantial business driver. If a widget, or a page, doesn’t represent a driver, then rethink the element.

Some other common page types to consider:

  • 1 page per touchpoint in a customer journey
  • Different levels of geographical drilldowns per page (for example, a page for region views, vs. another for country views)
  • An overall summary (which could include links out to other dashboards)
  • Scorecards
  • Deep dive into text analysis (especially if you use Text iQ)

Avoid widget overload so the impact isn’t reduced, particularly for your C-Suite stakeholders. You can’t be afraid to purge pages and widgets. But if you’re having trouble killing your darlings, here are some ways you can start to narrow widgets down:

  1. Be thoughtful about your widgets. Challenge yourself to build a page that conveys your intended message with the fewest amount of widgets possible. Evaluate if a widget that has a breakdown really needs its own widget, or if it can just be a page filter.
  2. Be intentional about the layout of your widgets on a page. Widgets should be put in priority order from left to right and top to bottom (AKA, the most important in the top-left). Make key metrics and the most actionable insights discoverable above the fold.
  3. Think of the people you’re building the dashboard for, and what information is most important to them.”

Who is Your Dashboard For?

As we learned in the previous section, it’s important to think about the audience of your dashboard before you start building. By thinking about the personas that will be using the dashboard, you can take into account the kind of information you should try to communicate with your dashboard.

Qtip: Be thoughtful about what information you include within your dashboard. If you have sensitive fields you don’t want shown to users, don’t include them within your dashboard data.

As an example, let’s go over some of the personas that are commonly found in a CX Program, and what job goals they can accomplish by using a dashboard. On the rightmost column, we speculate on the kind of widgets (charts and tables) that might benefit these users.

Role Dashboard Objectives How Frequently They Will Use Dashboards Widgets and Features They Need
CX Manager
  • Report to Executives
  • Track NPS over time
  • Benchmarking
  • Identify actionable insights
  • Understand detractors
Once a month
  • NPS over time in simple charts
  • Various metrics benchmarked in Gauge Charts
Analyst
  • Analyze data
  • Identify key drivers
  • Custom reporting to various teams / managers
  • Track trends over time
Every day
  • Metrics over time in simple charts
  • Pages for each key stakeholder
  • Editing access
Operations Manager
  • Manage ticket assignment
  • Monitor follow-ups
  • Track ticket status
  • Track each operator’s performance
  • Improve resolution time
  • Ticket trends and benchmarking
  • Reporting on ticket root cause
Every day
  • Ticket reporting page
  • Gauge charts reporting on ticket benchmarks
  • Pivot tables reporting volume trends
  • Response ticker with customer verbatims and sentiment scores
Closed Loop Operator
  • Close tickets
  • Monitor resolution time
  • Update ticket info & status
  • Track own performance
  • Identify which customer interactions require follow-up / escalation
Every day
  • Ticket reporting page
  • Response ticker with customer verbatims and sentiment scores
Executives
  • Identify issues that require top-down or cross-functional action
  • Drive an overall positive customer experience and improve financial performance
Once a month or quarter
  • Minimal information and unrestricted data access
  • Key metrics at a glance
  • Trended and segmented performance views of key metrics


Of course, this isn’t an exhaustive list – as you build your dashboard, you may find that your personas have needs that would be better filled by other widgets and reporting features. In the next lesson, we’ll go over how to build the widgets we list here, in addition to some other common ones.

FAQs