
Distribution Reporting (CX)
What's on this page
Attention: The XM Directory Respondent Funnel can accomplish the same analysis as distribution reporting with an easier setup. After August 31, 2022 users will not be able to add new data sources or create new dashboard pages from the Directory Respondent page template. Additionally, we are currently not enabling distribution reporting for any new customers at this time. Reach out to your Account Executive or Account Services if you don’t have access to the respondent funnel and are interested in this feature.
About Distribution Reporting
Distribution reporting enables users to report on response and completion rates over one or more surveys using any CX Dashboards widget. Additionally, the feature allows data from distributions to be filtered by embedded data stored in the contact list.
Qtip: If you have also purchased access to the Salesforce Extension, you can report on your Salesforce distributions with distribution reporting. This includes Salesforce emails triggered in the Tools and in the Workflows tab.
Qtip: Distribution data is only accessible for email distributions that are sent after you’ve set up distribution reporting. Distribution reporting will only report distribution data from the past 15 months. If you’d like to report distribution data older than this, you must export the data and import it as a dataset.
Attention: Distribution reporting will not pull in distributions that were sent via automations.
Setting Up Distribution Reporting
Attention: You can no longer set up distribution reporting for the first time. Use the improved XM Directory Respondent Funnel instead.
The distribution fieldset must be mapped before a dashboard can utilize distribution reporting.
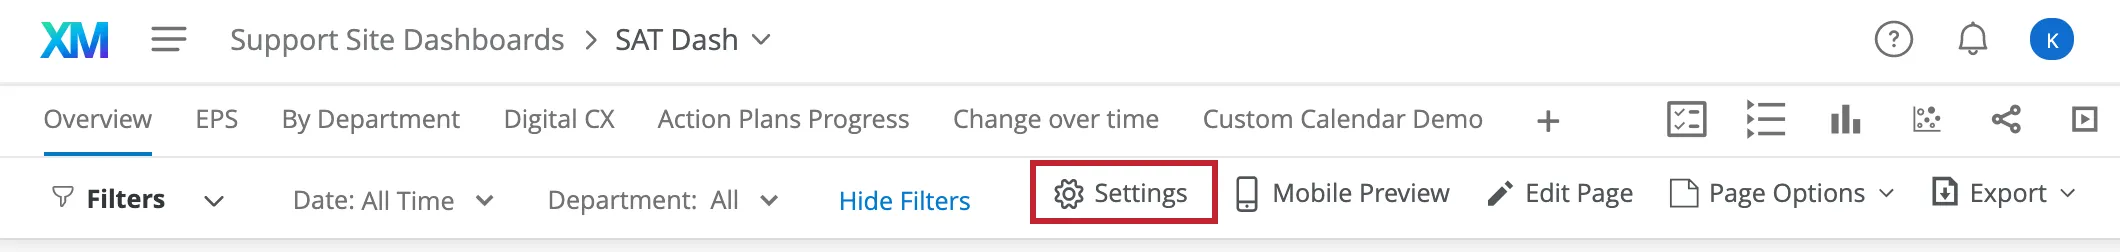
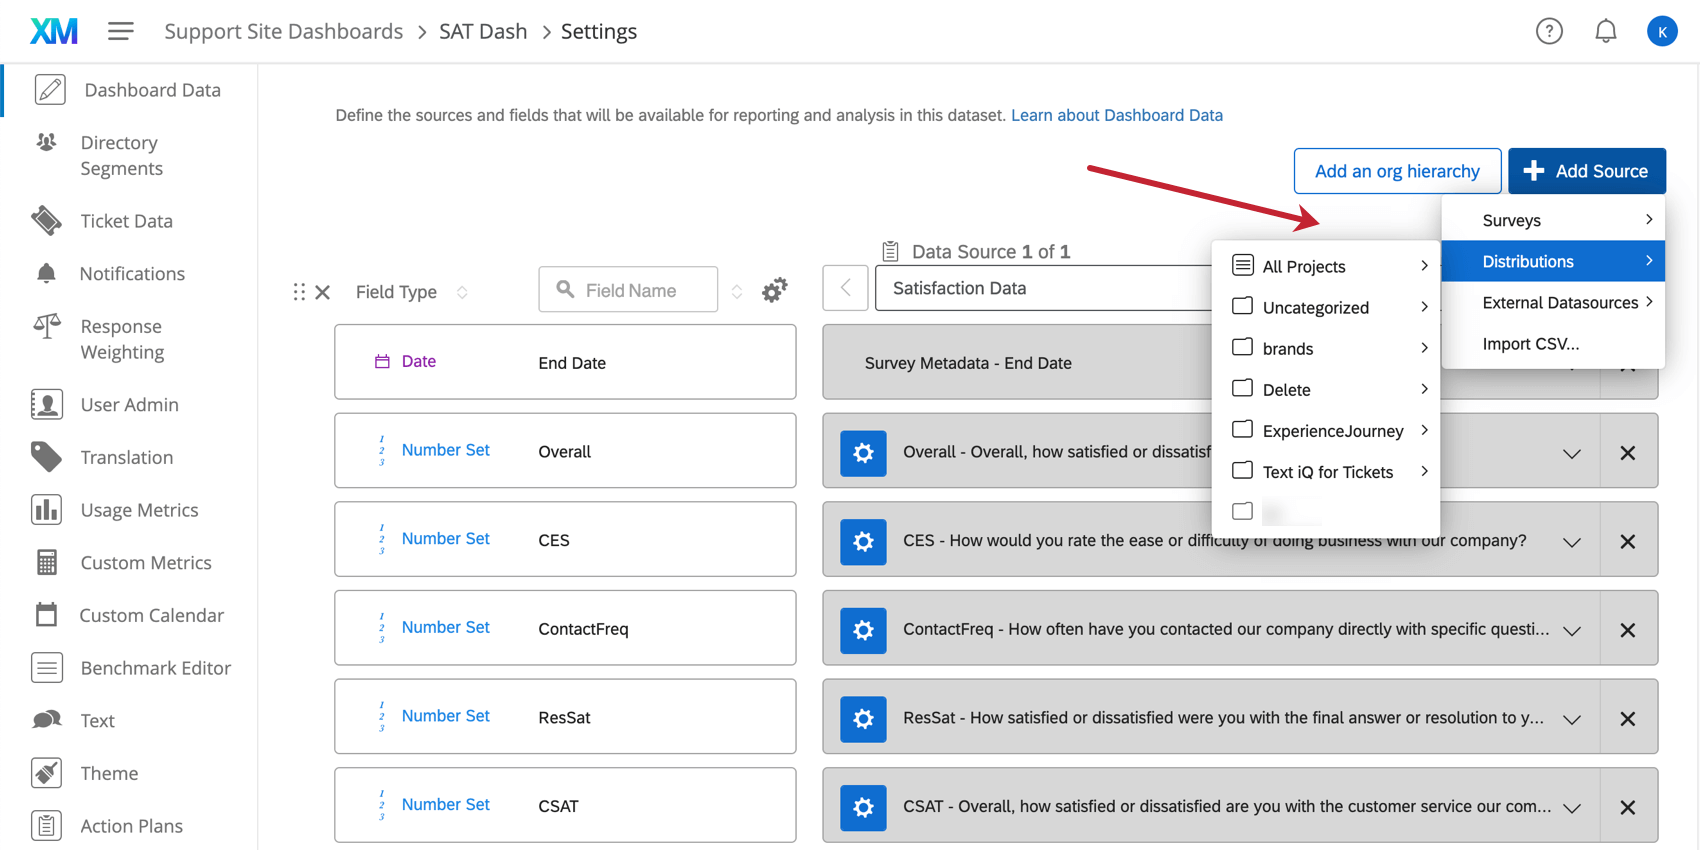
Navigate to the dashboard settings.
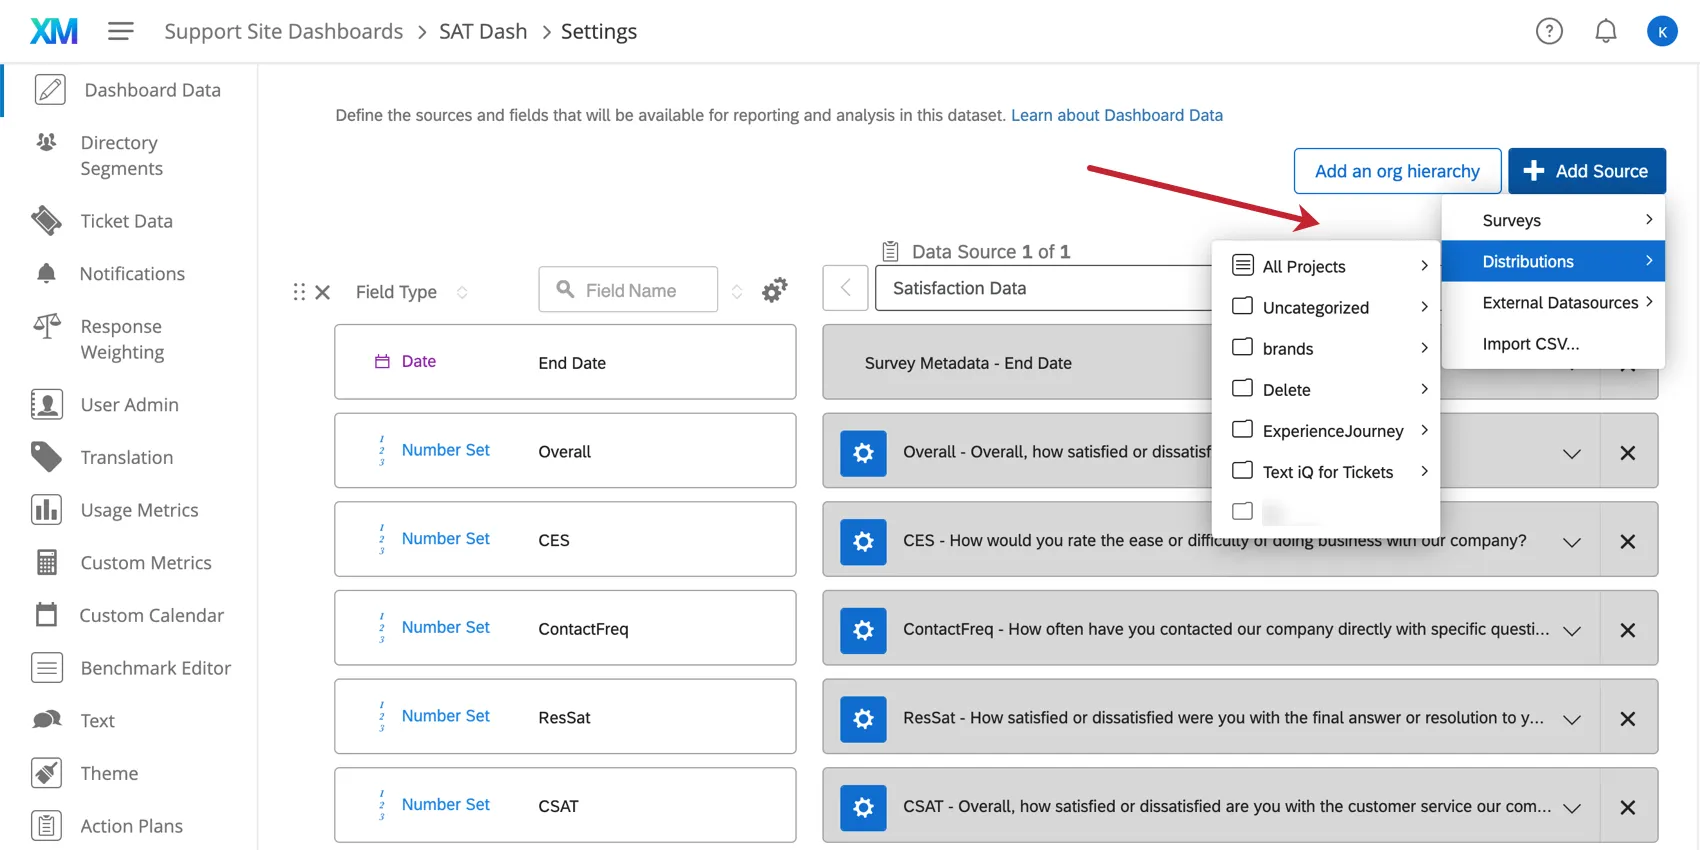
In the Dashboard Data page, click on Add Source, hover over Distributions, and select the survey that contains the distribution on which you want to report.
If the distribution source is the first source added to the dashboard, it will automatically add 12 fields to the data mapping. If there is already a survey mapped alongside the new distribution source, you will need to manually add the following fields.
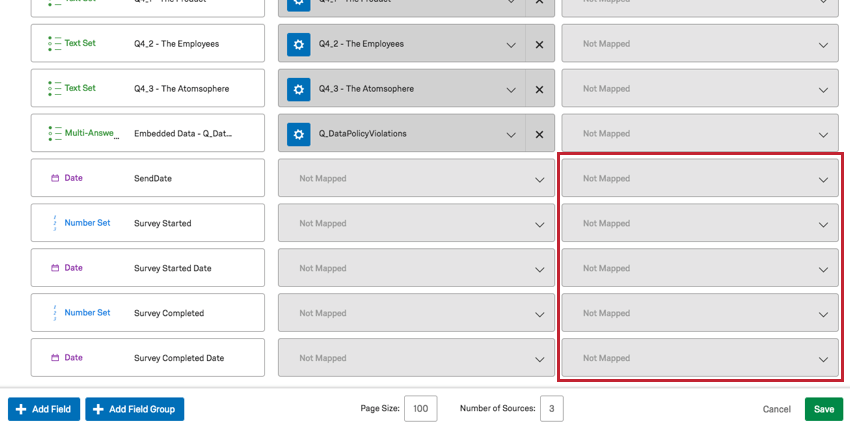
Manually Adding Distribution Data
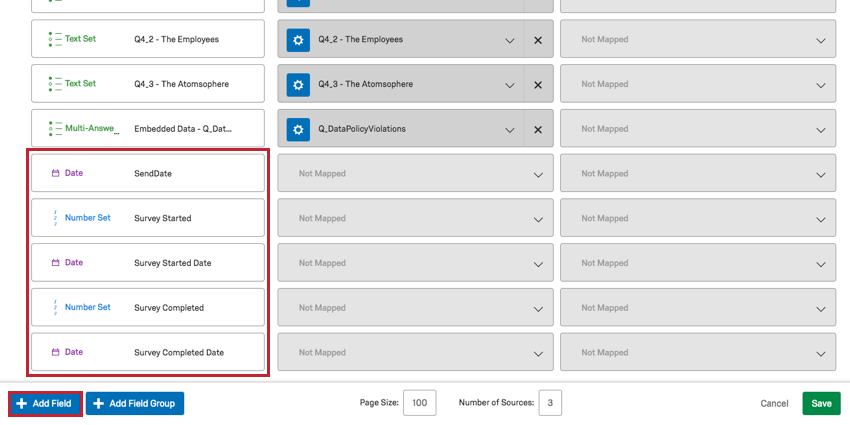
- Send Date (Date): The date that the distribution sent.
- Survey Started (Number Set): The number of surveys responses that were started by clicking the survey link.
- Survey Started Date (Date): The date a survey response started.
- Survey Completed (Number Set): The number of completed survey responses that have been recorded. This does not include recorded incomplete responses.
- Survey Completed Date (Date): The date that a survey response was recorded.
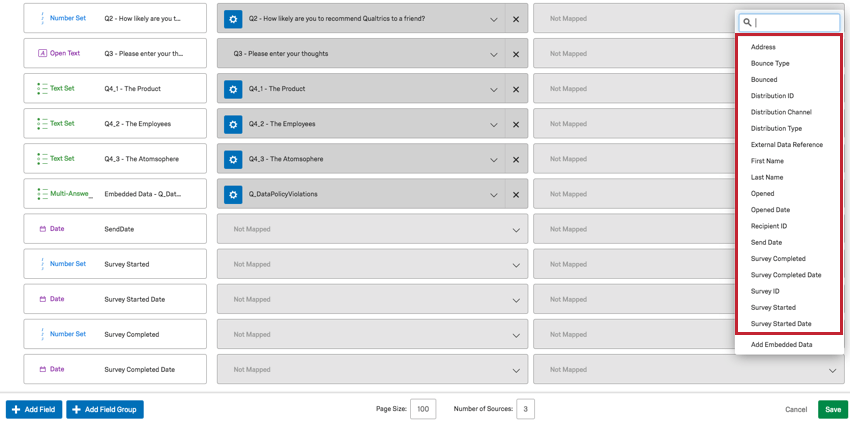
Qtip: In addition to the five required fields, distribution reporting has 11 additional fields on which you can report: Survey ID, Distribution ID, Distribution Channel, Recipient ID, Address, First Name, Last Name, Bounced, Bounce Type, Opened, and Open Date.
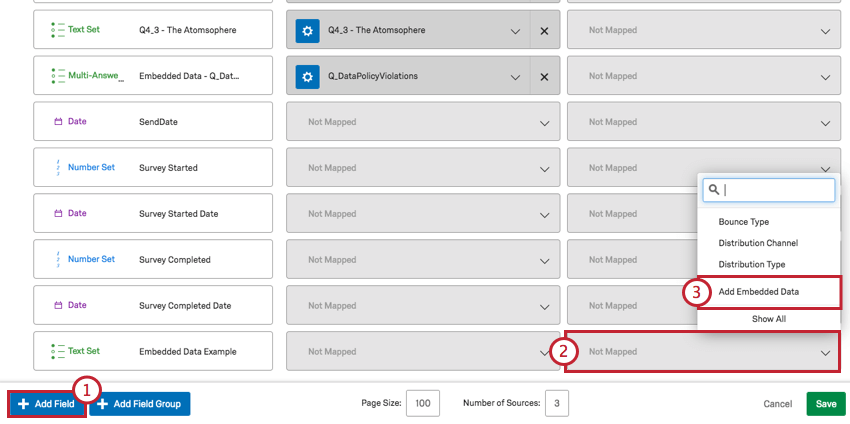
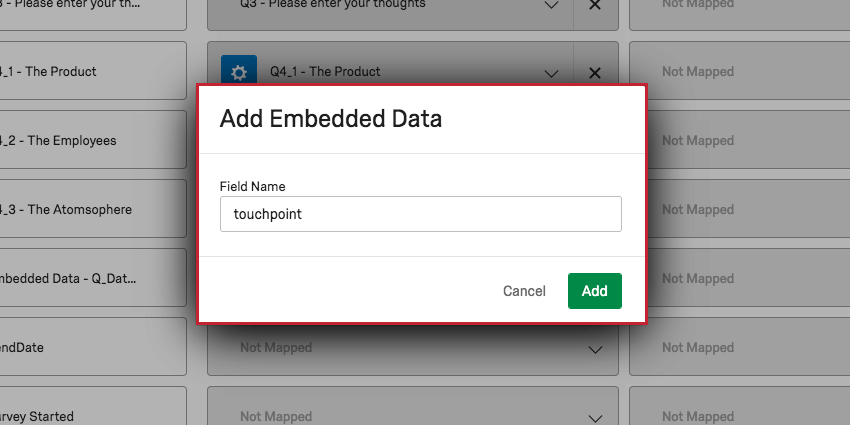
Adding Embedded Data
Qtip: When mapping fields using embedded data, remember that special characters such as period (.) and hashtag (#) are unsupported. See Best Practices and Troubleshooting Embedded Data for more tips on setting embedded data values.
You can also add embedded data that is stored in the contact list associated with your distributions.
Distribution Reporting Fields
By default, there are 18 fields you can map. Each field’s meaning is listed with what field type you should map it as.
- Address: Text Value. Email addresses of the contacts who received the email.
- Bounce Type: When an email bounces, there are two types of bounce. Qtip: Hard and Soft bounces are meant to serve as estimates to get you started troubleshooting. They are reliant on signals sent by the recipient server, and are therefore only as precise as the message sent to Qualtrics.

- Hard: The email or its domain doesn’t exist.
- Soft: The mailbox is full, the message is too large, or the server you sent the distribution to is down.
- Empty: Emails that did not bounce.
- Bounced: Number Set. How many emails bounced.
- Distribution ID: Text Value. The internal ID of the distribution you just mapped.
- Distribution Channel: Text Set. How the distribution was sent. For example, email or SMS.
- Distribution Type: Text Set. Includes invite, interactive, and SF Trigger (Salesforce trigger).
- External Data Reference: This element allows you to see the External Data Reference field from the contact list. This can be useful if the contact list has been deleted.
- First Name: Text Value. First names of the contacts who received the email.
- Last Name: Text Value. Last names of the contacts who received the email.
- Opened: Number Set. Whether an email was opened (1) or not (0). Qtip: Qualtrics uses a pixel embedded in the email to gauge when an email is opened. When the pixel is loaded, the email is marked as opened. The number of opened emails is approximate as it relies on the recipient’s email server automatically loading the pixel.
- Open Date: Date. When the email was opened.
- Recipient ID: Text Value. The internal IDs of the contacts who received the email.
- Send Date: Date. The date that the distribution sent.
- Survey Completed: Number Set. The number of survey responses that have been recorded. This does not include recorded incomplete responses or manually closed responses in progress.
- Survey Completed Date (Date): The date that a survey response was recorded.
- Survey ID: Text Value. The internal ID of the survey the distribution was sent out for.
- Survey Started: Number Set. The number of surveys responses that were started by clicking the survey link.
- Survey Started Date: Date. The date a survey response started.
Attention: Response rate and completion rate are not included as default fields. In order to add add these to your dashboard, follow the instructions in the next section!
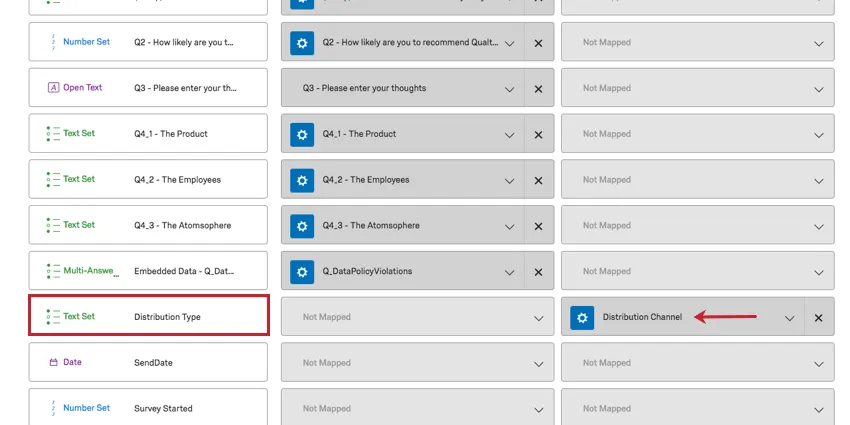
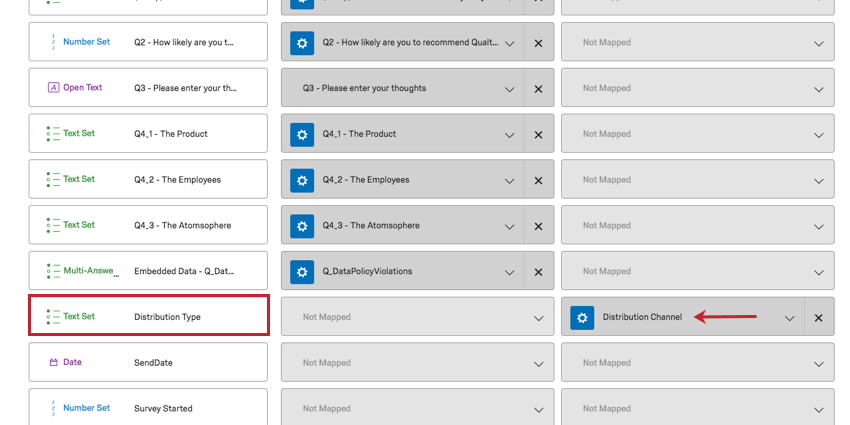
Distribution Channel
Distribution Channel used to be called Distribution Type. If you are still seeing the wrong name with the wrong information on your dashboard and would like to change it, modify the field name in the data mapper.
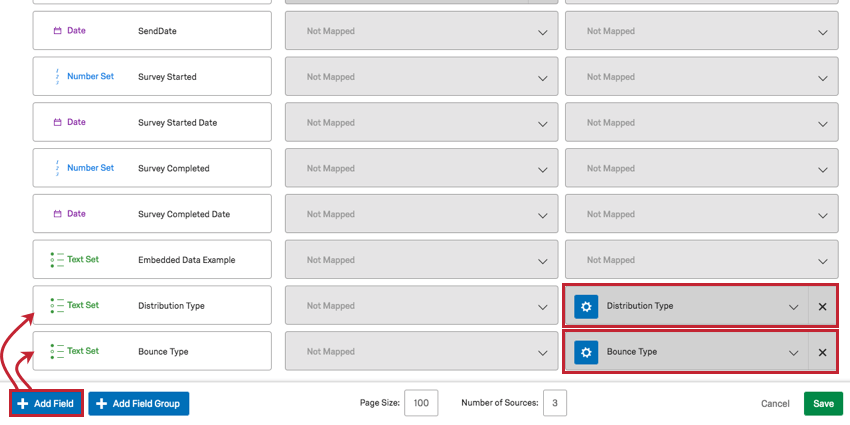
Bounce Type & Distribution Type
If you do not have Bounce Type or Distribution Type in your dashboard, you will need to add a field. You may need to click Show All before they appear as an option. Set these fields to Text Set.

Response Rate & Completion Rate
Qtip: Response rate is calculated differently for the XM Respondent Funnel. See the XM Respondent Funnel page for details.
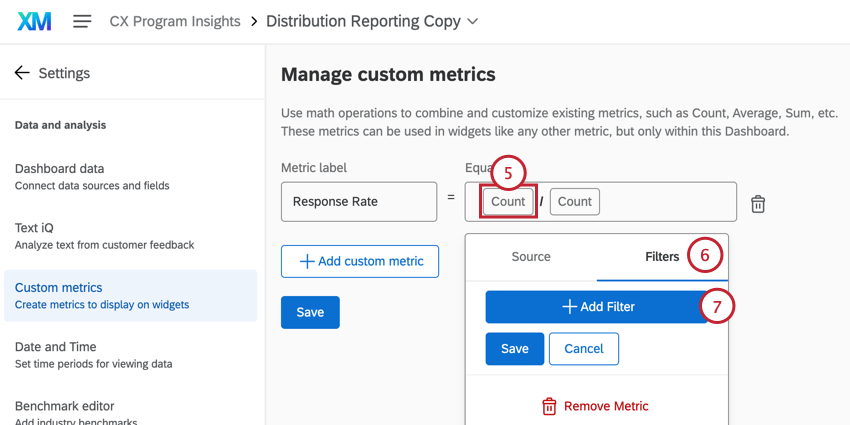
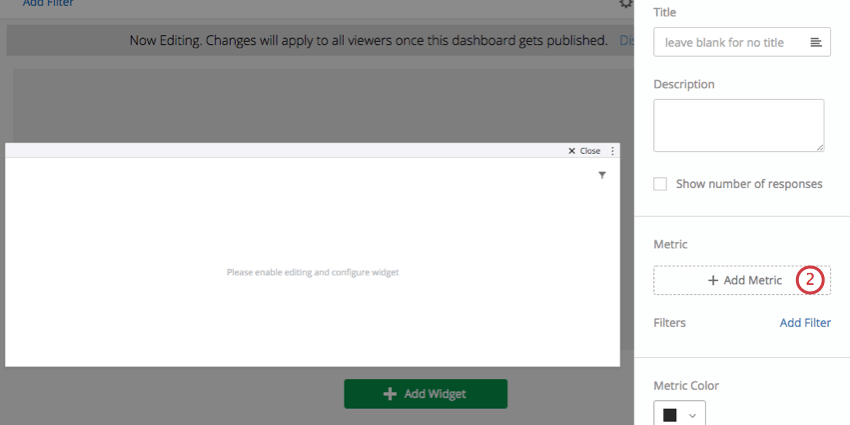
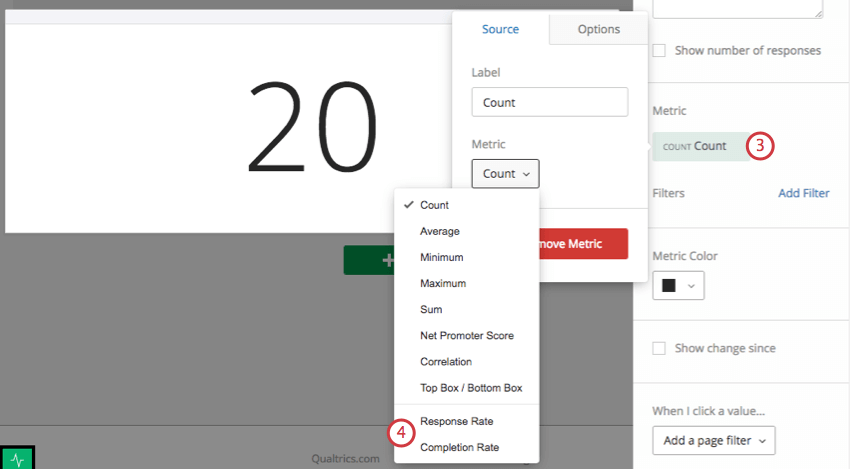
Before you can report on response rate and completion rate in your dashboard, you will need to add two custom metrics.
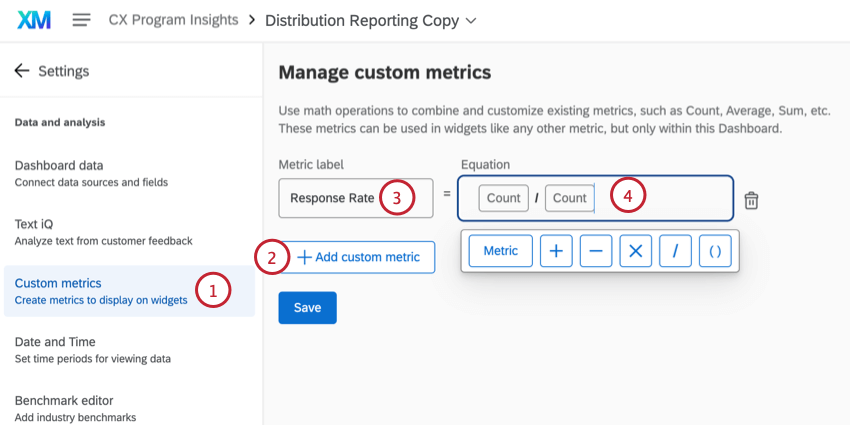
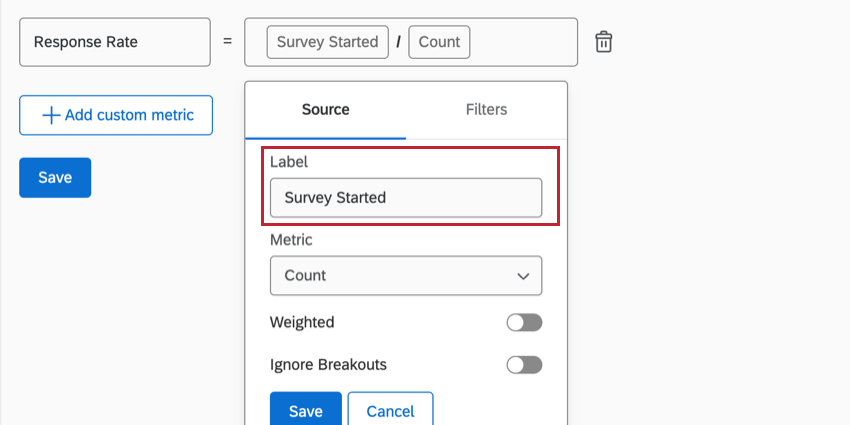
Qtip: To build the equation, click Metric, then the division symbol ( / ), and then Metric again.
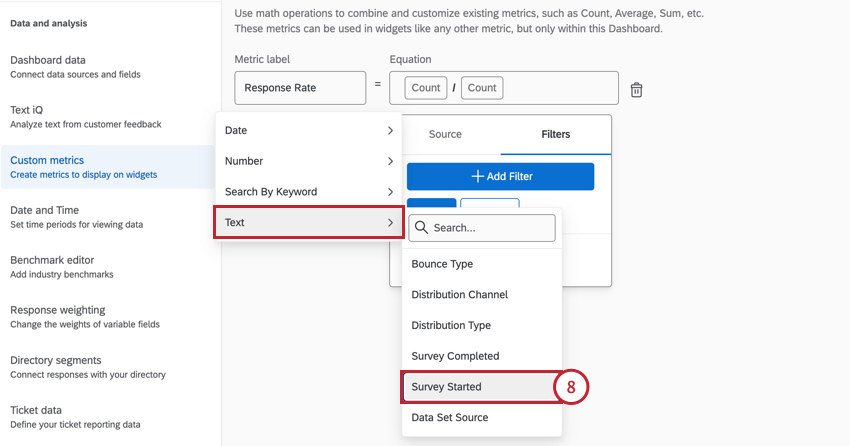
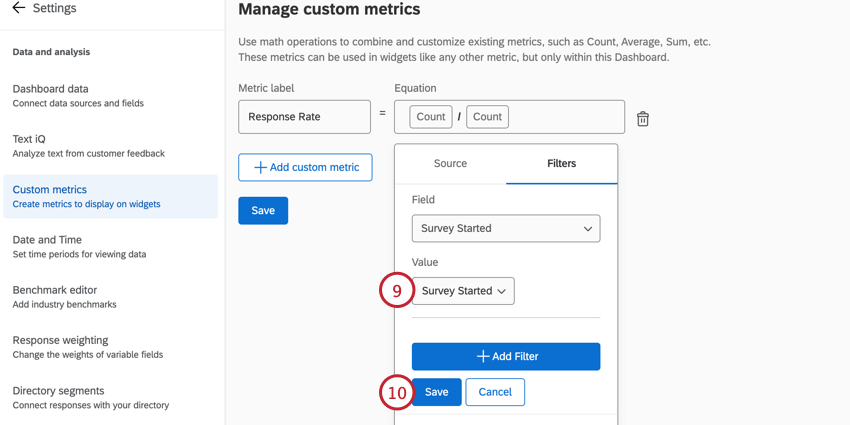
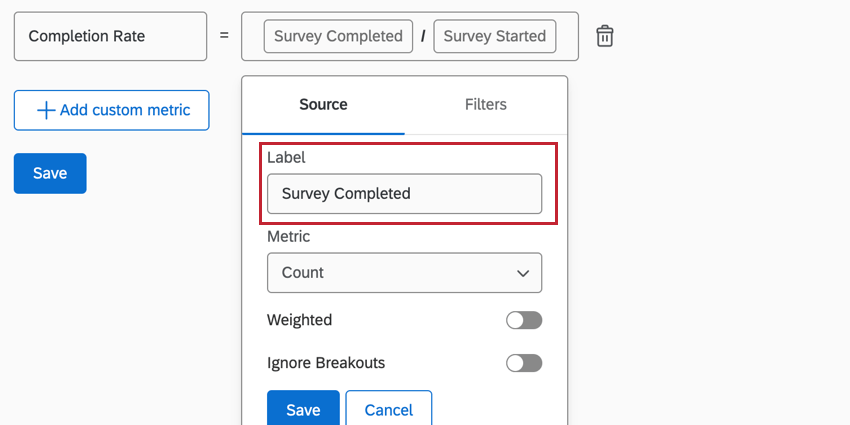
Qtip: If desired, you can relabel your metrics by clicking on them and entering a new Label in the Source tab. For Response Rate, the equation is “Survey Started / Count”.
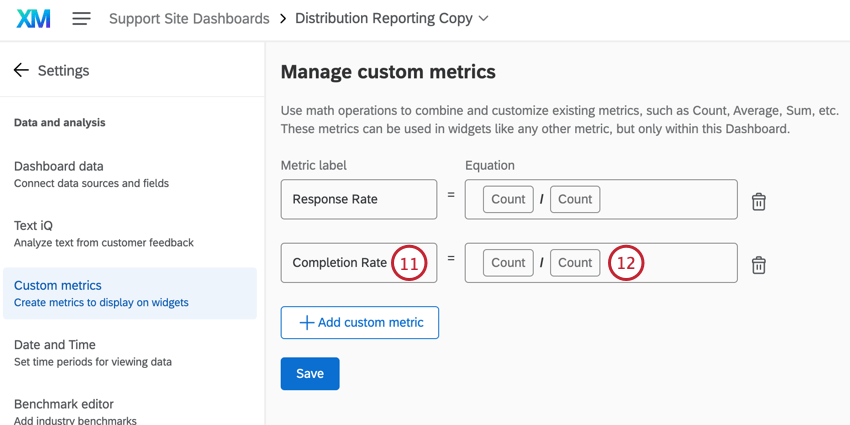
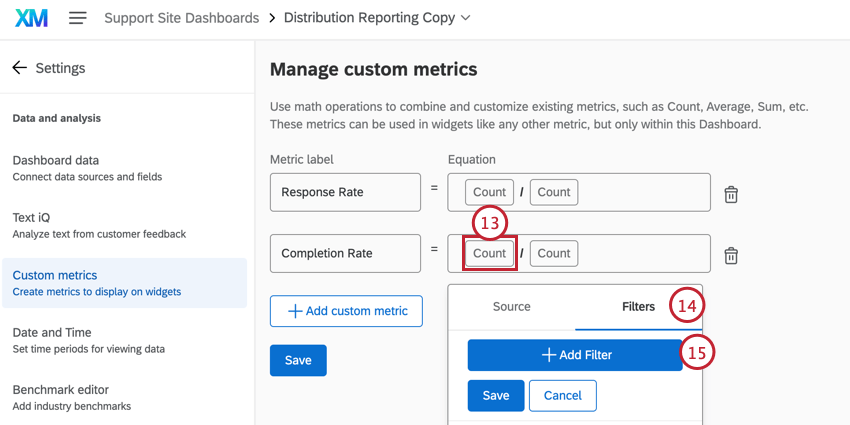
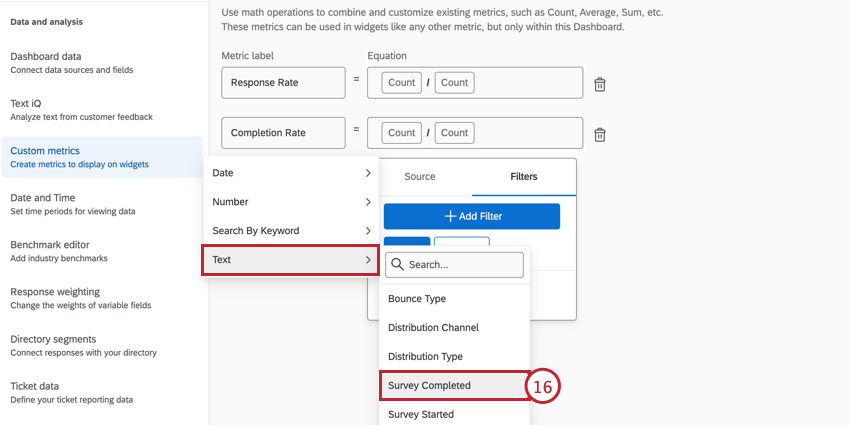
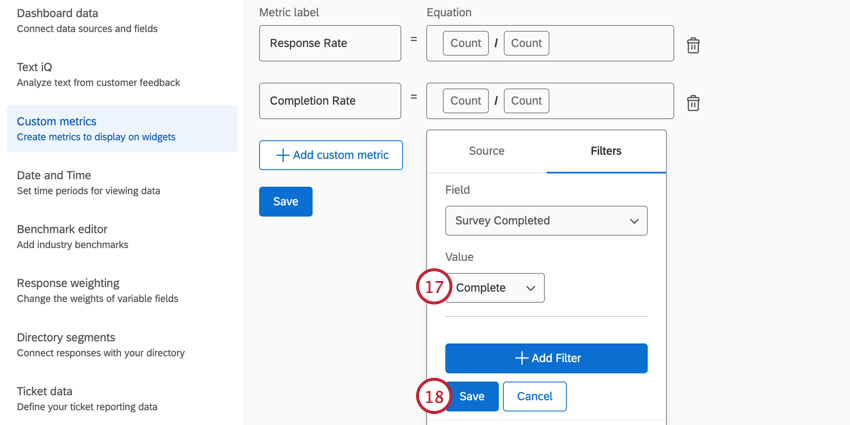
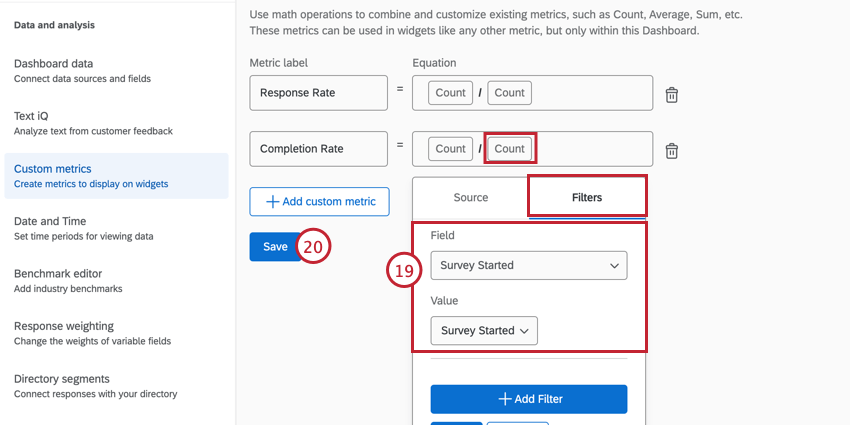
Qtip: If desired, you can relabel your metrics by clicking on them and entering a new Label in the Source tab. For Completion Rate, the equation is “Survey Completed / Survey Started”.
Attention: Responses will only be recorded as “Survey Completed” if their progress is 100%.
Attention: If you are reporting on distributions and surveys in the same dashboard, you will need to add a filter for “Data Set Source” at the widget or page level to distinguish between distributions from different surveys.
Reporting on Distributions
Qtip: Don’t want to set up distribution reporting all by yourself? Check out our distribution page templates!
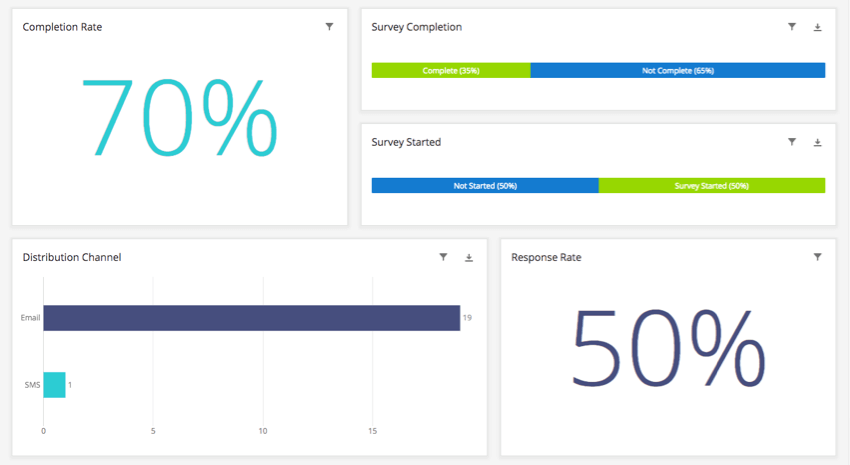
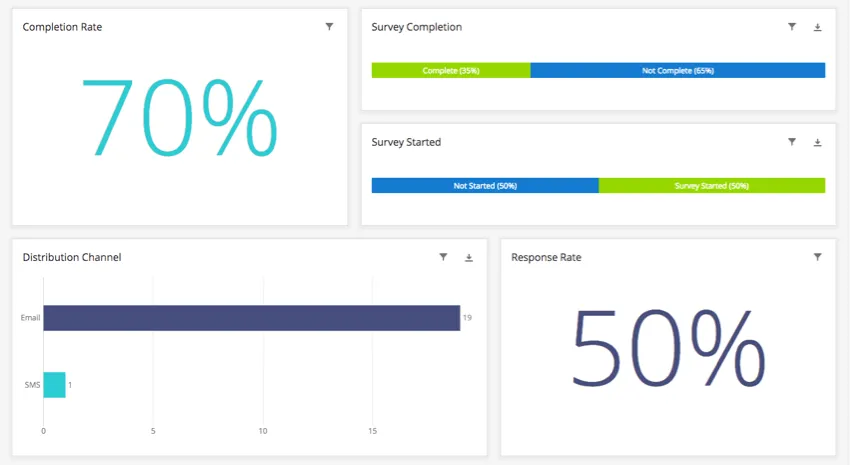
Now that you have your fields mapped, you can add them to widgets like any other field!
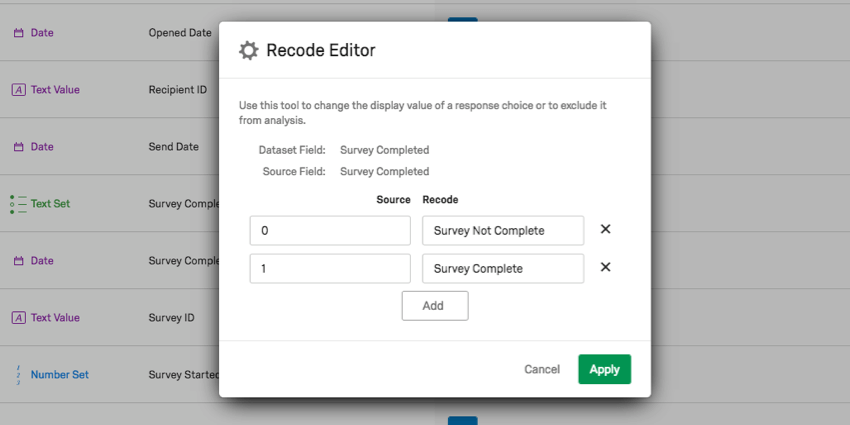
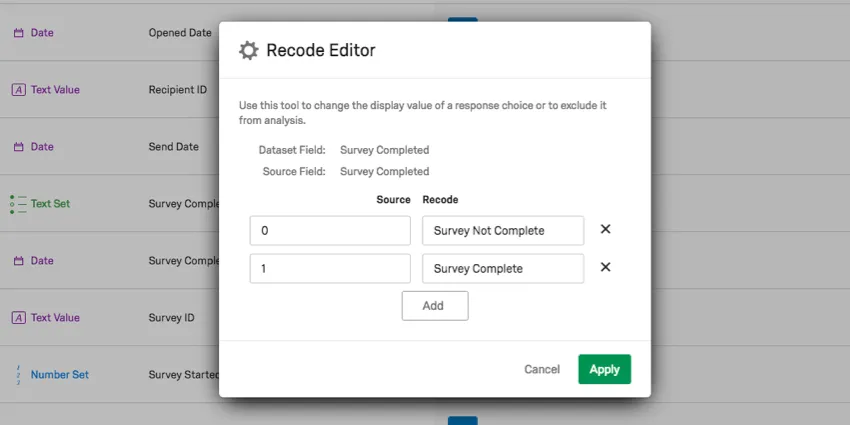
Qtip: For the fields Survey Started, Survey Completed, Opened, and Bounced, values will be either 0 or 1, where 0 is false and 1 is true. You can recode these fields as Text Sets and set the recode values to plain text to make your dashboard easier to understand.
Distribution Methods Available for Distribution Reporting
When analyzing your distribution reporting data, you may notice slight differences between the data displayed in your dashboard and other similar features in Qualtrics, such as the distribution statistics available for survey email invitations. These differences occur because of how distribution events are recorded in the various parts of the Qualtrics platform. For distribution reporting in CX Dashboards, responses will only appear when the response has both an associated Distribution ID and Recipient ID. This means the response has an identifiable contact it can be linked to as well as a unique distribution event in Qualtrics. Below is a table of each distribution method in Qualtrics and if their responses are available in distribution reporting.
| Distribution Method | Available in Distribution Reporting? |
|---|---|
| Email Invitation with Individual Link | Yes |
| Email Reminder with Individual Link | No |
| Email Invitation/Reminder with Anonymous Link | No |
| Email Invitation/Reminder with Multiple Completes Link | No |
| Personal Links | No |
| Marketo Distributions | No |
| SMS Invitations | Yes |
| 2-Way SMS Surveys Sent to a Contact List | Yes |
| SMS Access Codes | No |
| Anonymous Survey Link | No |
| QR Codes | No |
| Social Media Distributions | No |
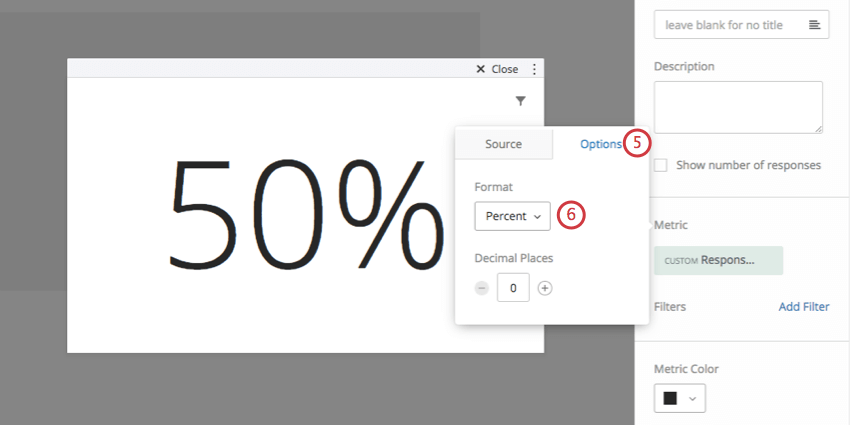
Reporting Response Rates and Completion Rates as Percentages
When creating the response rate and completion rate custom metrics, these fields are generally reported as an exact number. However, you can report these values as percentages with just a few simple steps.
FAQs
What dashboard widgets can I use with my distribution data in CX Dashboards?
What dashboard widgets can I use with my distribution data in CX Dashboards?
Does the response rate factor in bounced emails for my Distribution Reporting in CX Dashboards?
Does the response rate factor in bounced emails for my Distribution Reporting in CX Dashboards?
Is this feature compatible with data models?
Is this feature compatible with data models?
That's great! Thank you for your feedback!
Thank you for your feedback!