
Creating a Website & App Insights Project
What's on this page
Qtip: If you don’t have access to any of the features described on this page, reach out to your Account Executive. For more information about the differences between Digital Feedback and CustomerXM for Digital, see Digital Feedback vs. CustomerXM for Digital.
About Website & App Insights Projects
Website & App Insights projects help you collect feedback and analyze browsing behavior on your websites and mobile apps, empowering you to design the best digital experience possible.
To get started on your digital experience program, first you need to make a Website & App Insights project. From there, decide whether you want to collect feedback using graphics like overlays and feedback buttons, or whether you want to dive deep into session analytics. If you choose to start with feedback collection, you can choose between a guided or a more complex, customizable approach.
Creating a Website & App Insights Project
Projects are how you organize your creatives, intercepts, and session analyses. When you create these different elements in the same project, that usually implies they’ll be deployed on the same website together, since they all share the same project deployment code snippet.
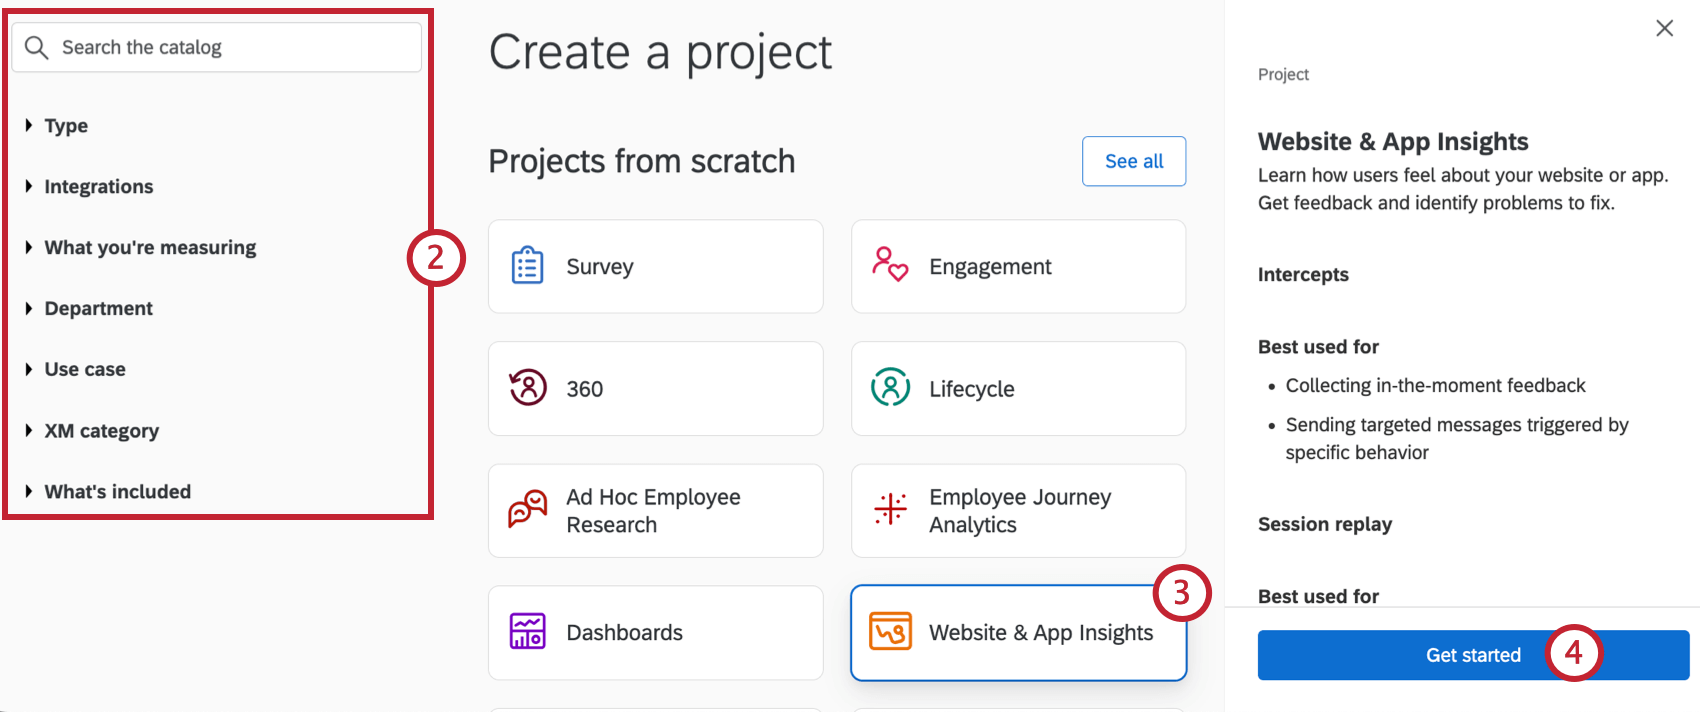
Every project can contain more than one creative and more than one intercept. The session replay analysis is shared amongst the entire project, so you can see behavioral tracking for one website or app in one place.
Attention: You cannot transfer ownership of the project, zones, intercepts, or creatives to another Qualtrics user once a Website & App Insights project is created.
Attention: Each brand can have up to 50 Website & App Insights projects and 100 intercepts per project.
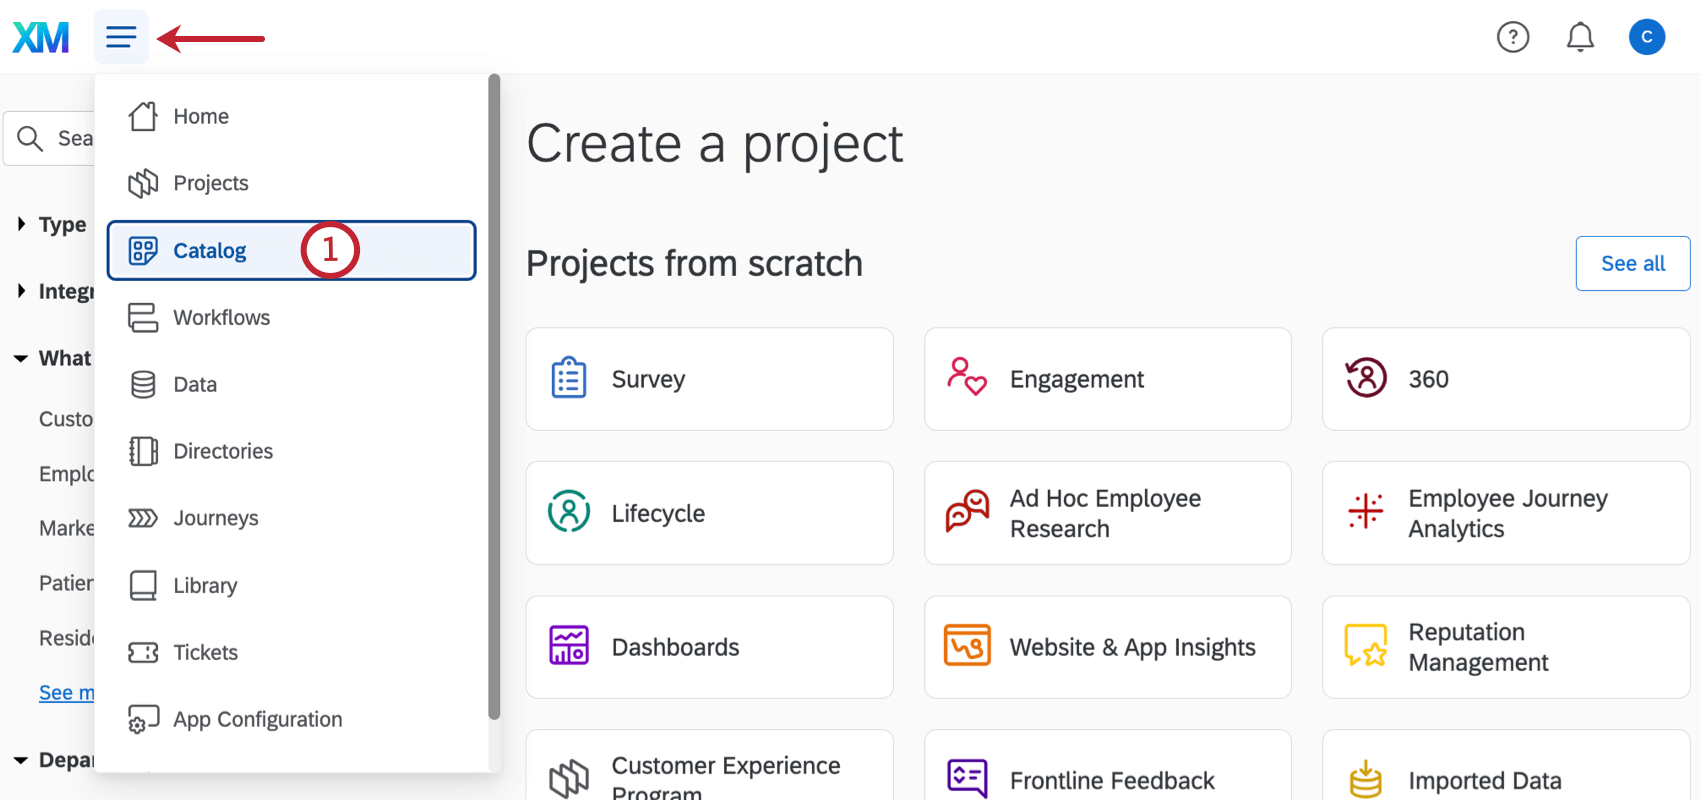
Qtip: A project can also be created from the Projects or Homepage.
Qtip: This choice does not affect the Website & App Insights features you have access to.
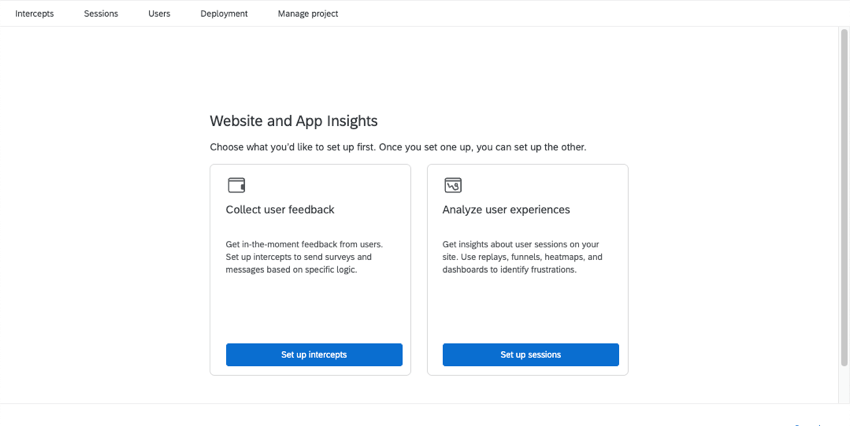
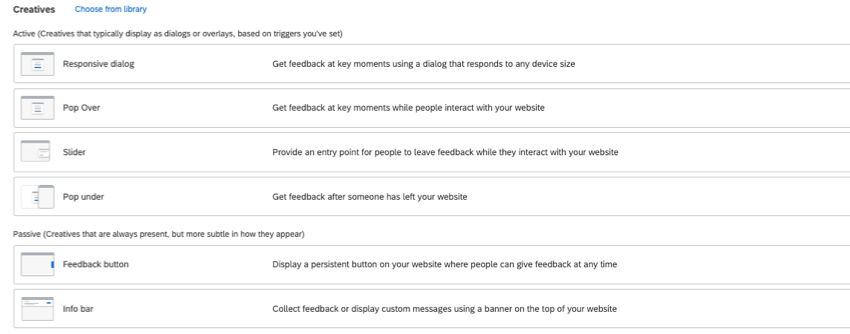
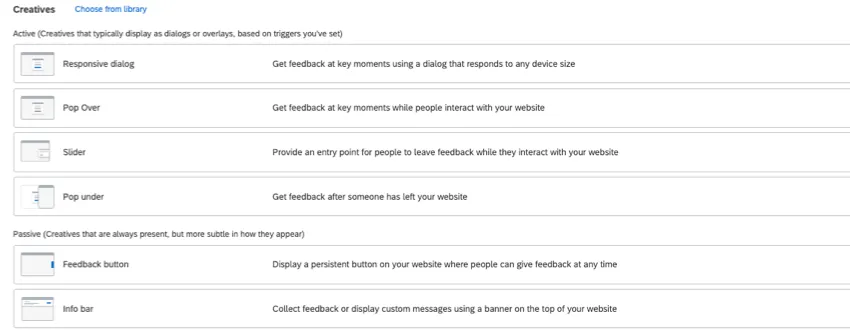
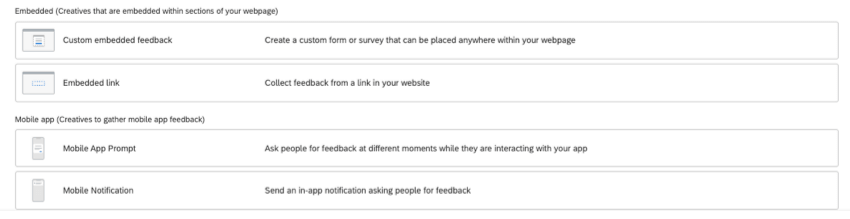
- Collect user feedback: Collect feedback from website and app visitors by displaying dynamic graphics, such as overlays, feedback buttons, and embedded content.
- Follow a guided digital setup: With a guided setup, we’ll walk you through the steps to get started. Fewer but more refined options are available through a guided setup, designed with user friendliness, flexibility for mobile screens, easy translation, and accessibility in mind.
- Make standalone intercepts and creatives: A more manual setup gives you the freedom to combine different display criteria and graphics. For example, you may prefer this approach if you want to use a banner or a pop under. Manual intercepts also allow you to create more complex action sets, such as different types of creatives appearing based on different criteria.
- Analyze user experiences: Learn more about your visitors’ website habits with Digital Experience Analytics. Use features like session replay capture and frustration detection to help identify where your visitors are struggling and improve their digital experience. This feature is only available to certain licenses and is not included with all Digital packages; reach out to Account Services if you are interested.
Qtip: Any of these items you don’t choose first, you can always do later. Keep in mind not all features are included with all licenses.
Following a Guided Digital Setup
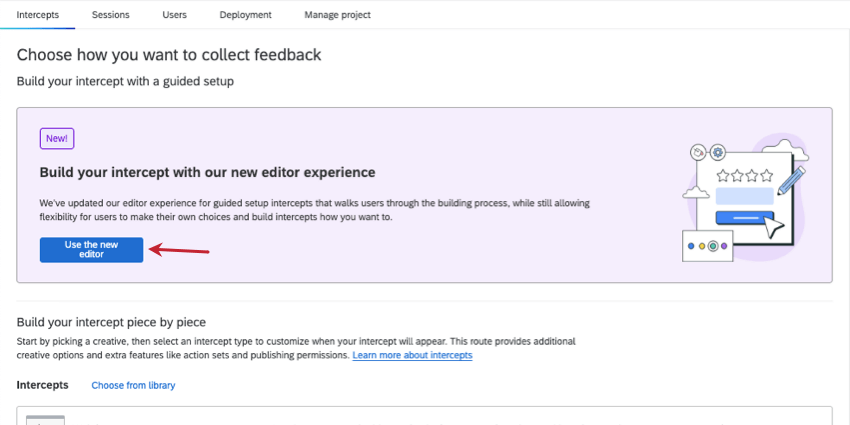
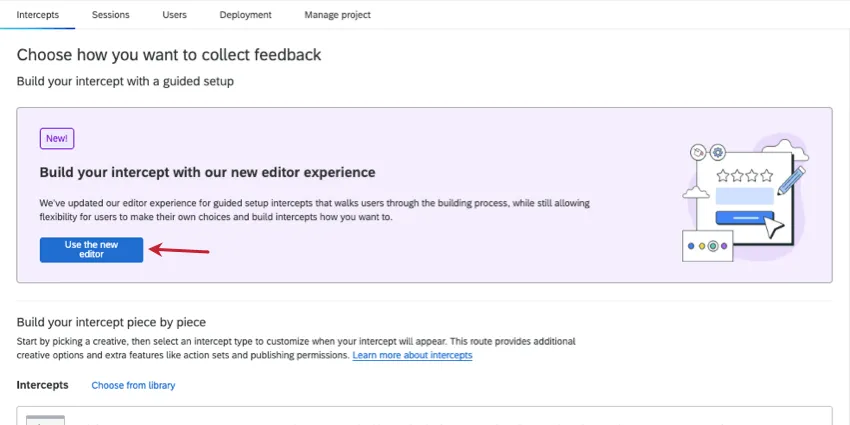
We highly recommend selecting one of our guided intercepts, especially if you are new to Website & App Insights, since they have a faster and easier setup. Create a great website or app experience complete with mobile-friendly views, website targeting, and translations, all in the same editor.
To get started with the guided setup, select Use the new editor.
For step-by-step details, see Creating Guided Intercepts.
Creating Standalone Intercepts and Creatives
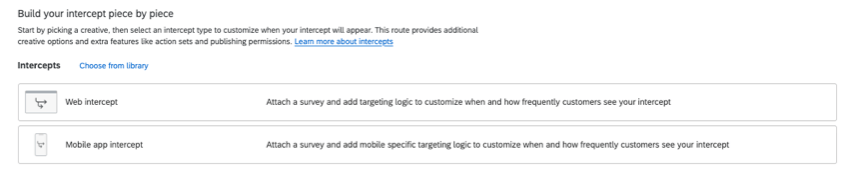
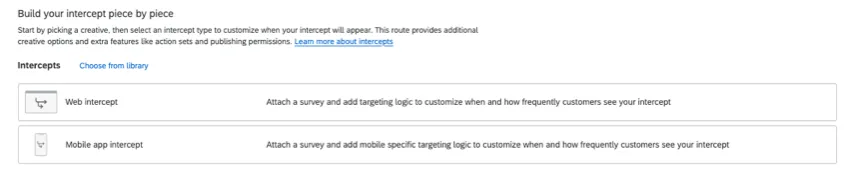
If you already have experience with Website & App Insights, you can scroll down to Build your intercept piece by piece. There, you’ll be able to make standalone creatives and intercepts that can be connected together.
You may prefer standalone creatives if you want to use graphics not yet supported by our guided setup, such as a banner or a pop under. Meanwhile, standalone intercepts allow you to create more complex action sets, such as different types of creatives appearing based on different criteria.
Intercepts can be thought of as the rules that determine when and how your project will be displayed on a website or an app. For example, you can show different elements depending on user information or portions of the URL. The intercept is where you define how your target survey, creative(s), and the conditions of a visitor’s session come together. See more on how to make an intercept.

Creatives can be thought of as the visual element of your Website & App Insights project; for example, a banner, a window that opens over a webpage, or even a link. Creatives let you reach your customers while aligning with your organization’s personal style. See more on how to make a creative.
Analyzing User Experiences
By selecting Analyze user experiences, you’ll find yourself on the Sessions page, where you’ll set up Digital Experience Analytics.
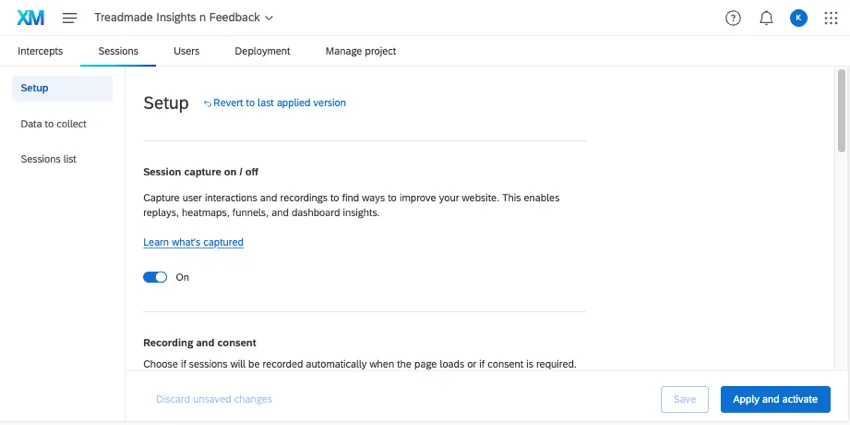
Digital Experience Analytics empowers you to find and close experience gaps through session replay capture and frustration detection. Understand how your customers are interacting with your digital presence, whether through a website. You can then use dashboards to analyze and share this data, even combining your digital performance data with surveys and other sources.
For step-by-steps, see the following:
Managing Website & App Insights Projects
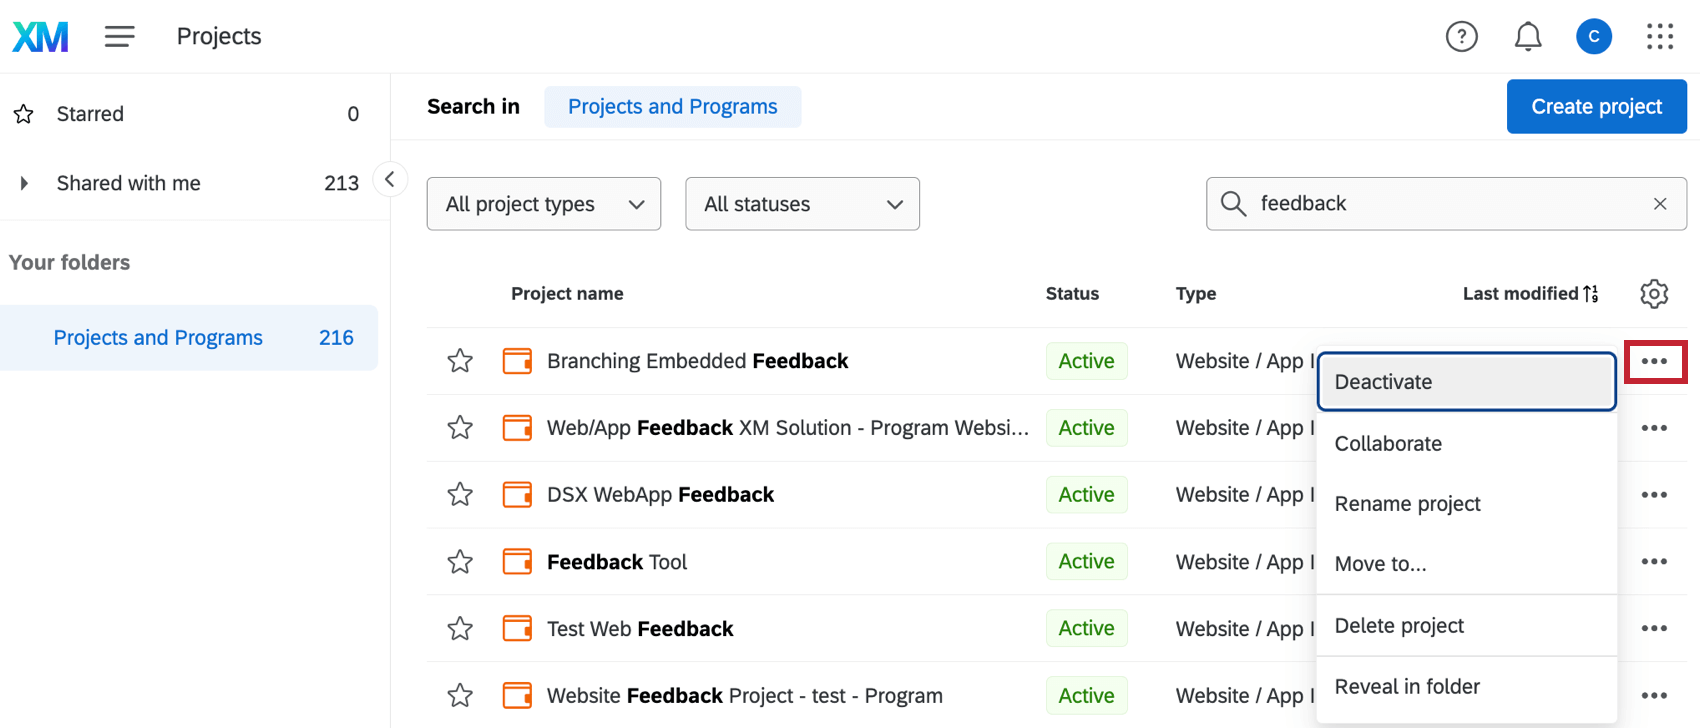
On the Projects page, there are additional actions you can perform with your projects.

- Deactivate/Activate: When a project is active, all the Intercepts and Creatives inside it (that haven’t been individually deactivated) will continue to function on whatever website you paste your project’s deployment code to. When a project is deactivated, all the Intercepts and Creatives inside it are shut off. This lets you remove Website / App Insights projects from your webpage without having to remove the code, and it allows you to deactivate many Creatives and Intercepts at once without having to individually edit them. Attention: Testing bookmarklets does not work with inactive projects.

- Collaborate: Determine which users can help you edit your Website & App Insights project.
- Rename Project: Change the name of the project.
- Delete Project: Delete the project. Attention: This will permanently delete all Creatives and Intercepts within the project. Proceed with caution.
- Reveal in Folder: Navigate to the folder the project is stored in. This option won’t appear if you project hasn’t been sorted into a folder or if you’re in the project’s home folder.
FAQs
What’s the difference between standalone intercepts, guided intercepts, and guided creatives?
What’s the difference between standalone intercepts, guided intercepts, and guided creatives?
Guided intercepts are when you create features like responsive dialogs, templated embedded feedback, feedback buttons, and embedded app feedback using these steps. Also known as guided setups, guided intercepts combine the visual element of a creative and the settings of a creative into one easy-to-follow flow that will guide you from start to finish.
Guided creatives are when you create features like responsive dialogs, templated embedded feedback, feedback buttons, and embedded app feedback using these steps instead. With a guided creative, you need to create a separate intercept to pair it with. You still get the improved creative editor, but not the rest of the guided setup.
Can I save guided setups to the library?
Can I save guided setups to the library?
That's great! Thank you for your feedback!
Thank you for your feedback!