
Using Widgets as Filters (Studio)
What's on this page
About Using a Widget as a Filter
You can use a widget as a filter, which lets you use data points in one widget as filters for other widgets.
To use this feature, you must first connect several widgets in a parent-to-child relationship where a parent is used as a filter for its children. The following connections are possible:
- Single parent to single child (One widget filters one other widget)
- Single parent to multiple children (One widget filters multiple other widgets)
- Multiple parents to multiple children (Multiple widgets filter multiple other widgets)
- Multi-level connection (Widget A filters widget B, and widget B filters widget C)
All widgets can be parents or children, except for metric widgets, which can only be children.
Understanding Widgets as Filters
A parent widget can have 2 connected children widgets.
Qtip: Hover over any widgets that are connected, and you will notice that all related widgets are highlighted with a border.

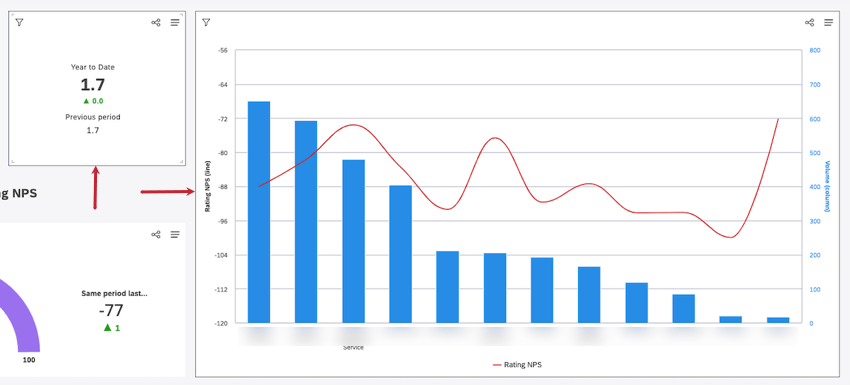
Children widgets are filtered by the data point selected in a parent widget. When a user selects one data point in a parent widget, all connected children widgets are automatically filtered by that item.
Selecting another data point changes the filters. Clicking the same data point one more time or clicking the empty space inside the parent widget removes the filters from the children.
When using a widget as a filter, keep in mind the following:
- In case any widget-level filters are applied to the parent widget, they will not be honored by the child widgets.
- For children, drilling works as usual.
- For parents, drilling works when right-clicking.
- When period over period reporting is used in a parent widget, it does not matter whether you select a report item to filter by from the current period or from the historic period—only the primary grouping is used to filter a child widget.
- When the secondary axis is enabled in a parent widget, you can use either the primary or the secondary axis to select the report item to filter by.
- When using the Map widget as a parent, children are only filtered by the geographic object selected. Secondary groupings are ignored.
Connecting and Disconnecting Widgets for Filtering
Qtip: The Edit Dashboard permission is required to create links between widgets. Anyone with view access to a dashboard can use the links after they are created.
Qtip: Only widgets with data from the same project can be linked.
Qtip: The number of connections in a widget-as-filter hierarchy is only limited by the maximum number of widgets that can be added to a dashboard.
Qtip: Selector widgets are common parent widget choices, with a flexible design ideal for this use.
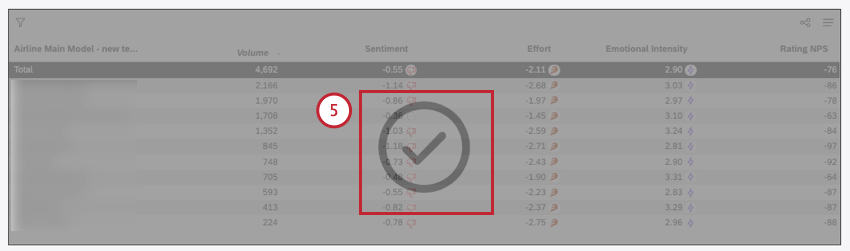
Qtip: A black check mark means the widget is selected. A white check mark means the widget is not selected.

Creating Multi-Level Connections
Children widgets can also be used as parents for other widgets. For example, when widget A is a parent of widget B, and widget B is a parent of widget C, widget A automatically becomes a parent for widget C. In this scenario, even if widget B is deleted, widget A remains a parent for widget C.
If widget B is made a parent of widget C, widget B selections will filter the content of widget C.
If widget A is made a parent of widget B, any selection in widget A will filter the content of both widgets B and C. Any selection in widget B will additionally filter widget C’s content.
Qtip: To remove the automatic connection between widgets A and C, go to widget A, click Use as Filter, and click the black check mark on widget C to deselect it.
You can create circular references, but a parent of a widget cannot be a child of the same widget.
Resolving Mutually Exclusive Selections
If you see an error message saying “There are no results for these mutually exclusive selections,” it means that mutually exclusive filters are selected in a multi-parent Widget as Filter relationship. You can either click the Clear selection link to clear that widget’s selection and get back to available items, or select a different, non-mutually exclusive report item higher up in the multi-parent hierarchy.
Example: Widget A shows continents, widget B shows countries, widget C shows cities, and they filter each other in the following order: A filters B which filters C. If North America is selected in widget A, and Canada is then selected in widget B, widget C shows Toronto and Vancouver. If Asia is selected in widget A, widget B will show an error message, because Canada is not in Asia. Click Clear selection to clear Canada in widget B.
Switching Between Topic Filters and Topic Inclusion List Modes
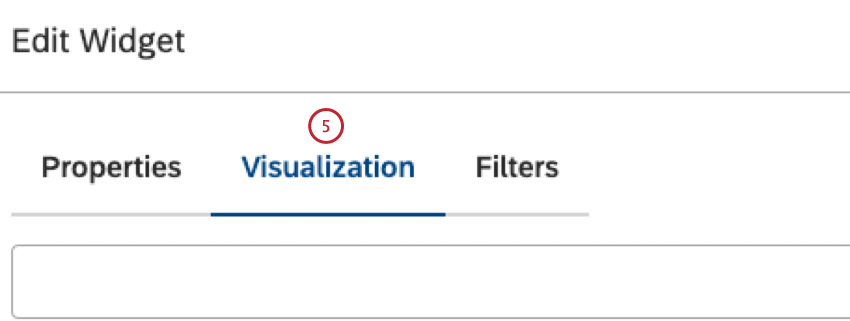
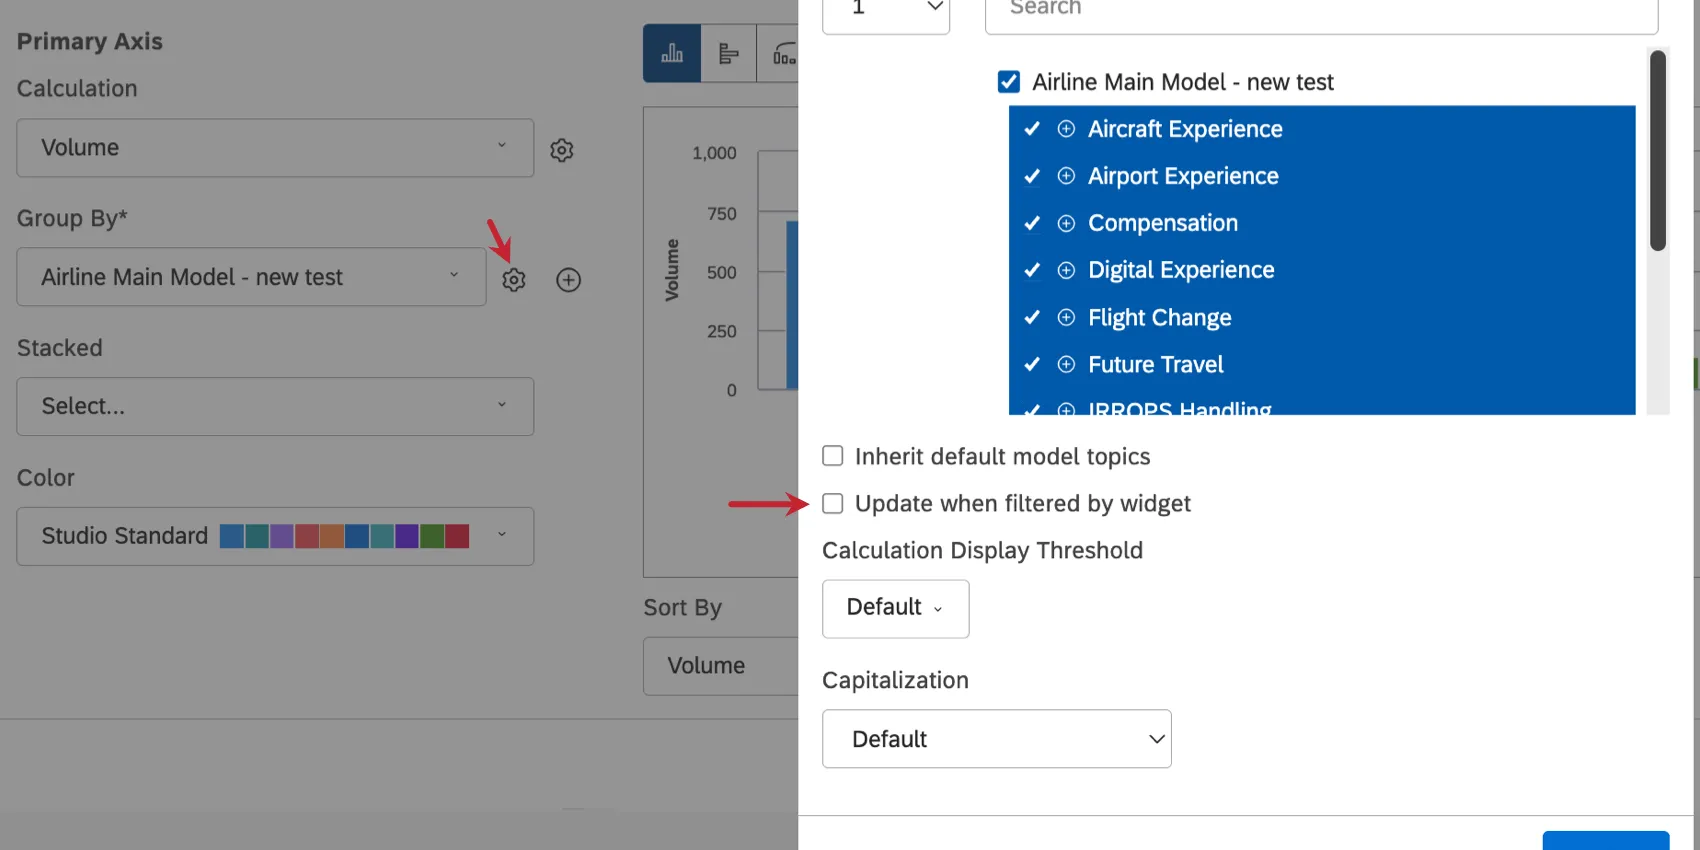
When parent and child widgets group data by topics from the same category model, you can choose whether to apply the parent widget’s topic selection as a regular topic filter or as a drilldown to subtopics via an inclusion list.
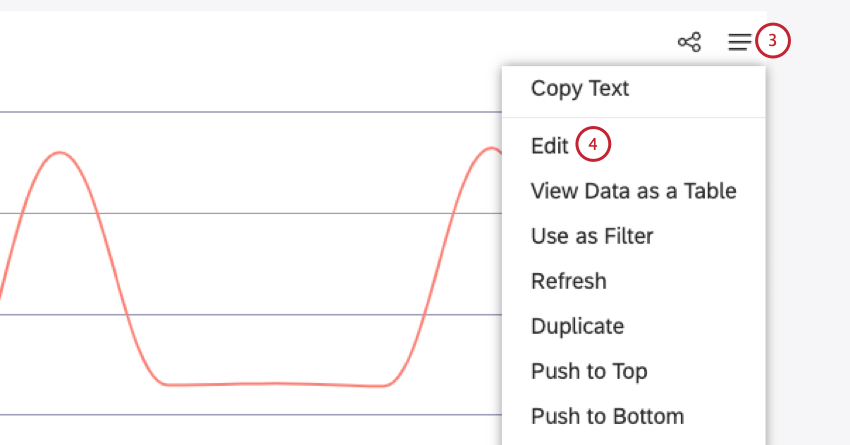
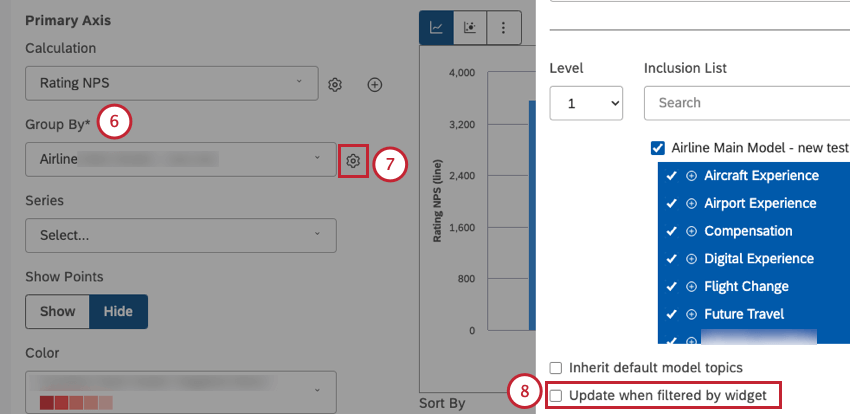
Qtip: Alternatively, select Update when filtered by widget to limit the child widget to subtopics of a parent selection.
Examples of Widgets as Filters
Using widgets as filters allows you to create an interactive dashboard experience. Here, we’ll show you a few examples of how this is commonly used.
Side-by-side Analysis
Widgets as filters can help with side-by-side analyses of data. We can use this feature to compare key performance indicators for different business segments without creating too many widgets with hard-coded filters.
Example: We created 2 rows of identical widgets. On the left, the list of top 5 cities acts as the parent of all the widgets to its right. (In this example, we used a selector widget.)
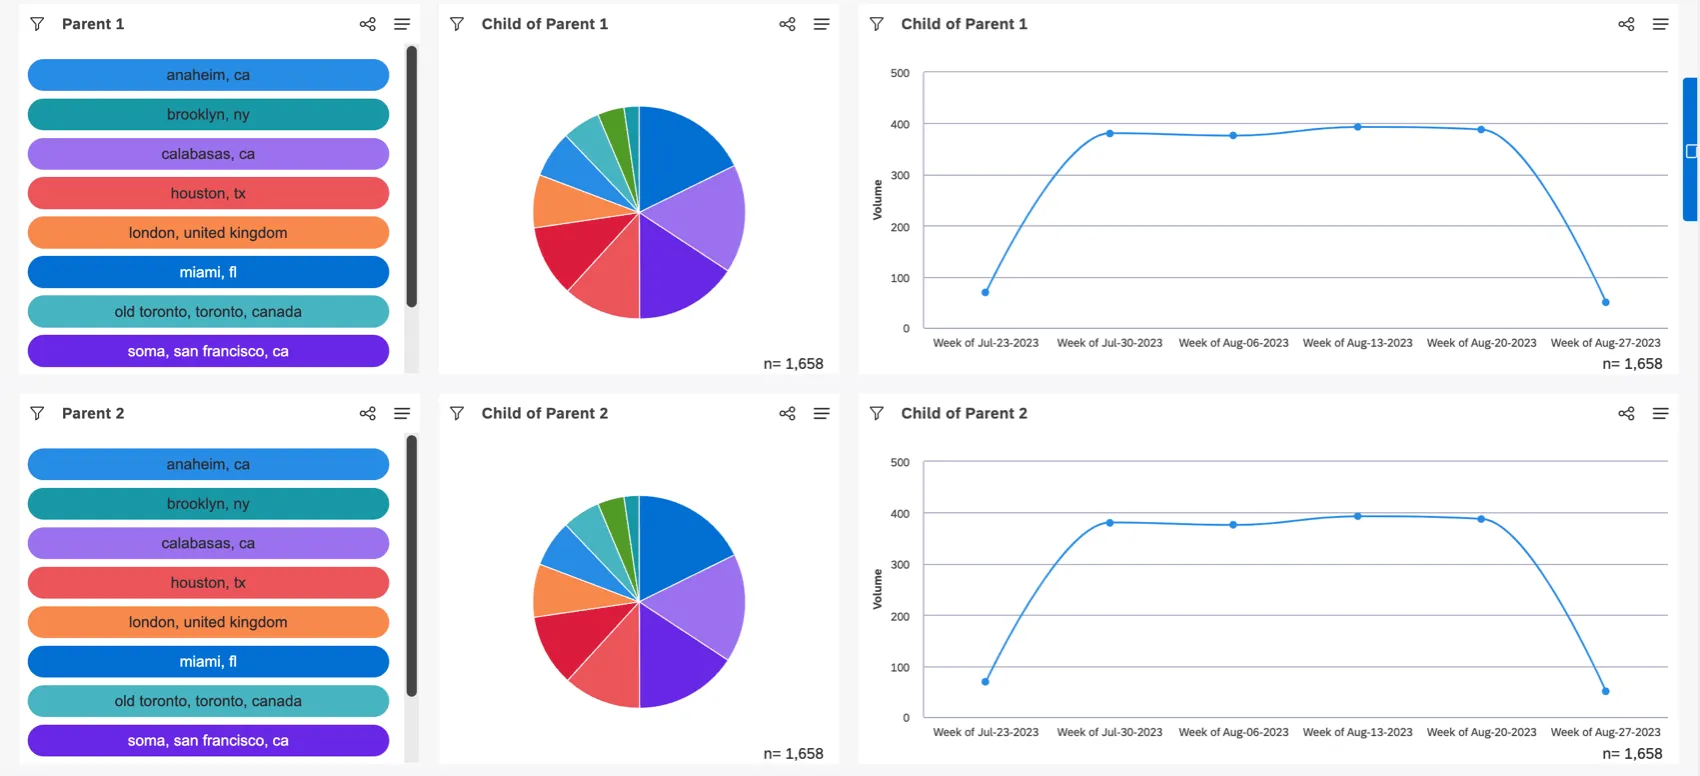
Whenever you click a city, the widgets to the right change to match. This lets you compare cities across 2 rows of data.
Co-Occurrence Analysis
Using a widget as a filter helps us find the most frequent co-occurrences between different topics to reveal unseen relationships in our data.
Qtip: For co-occurrence analysis, the Update when filtered by widget grouping setting must be disabled in the child widget. Otherwise the parent selection will be used to drill down to its subtopics instead of being applied as a filter.

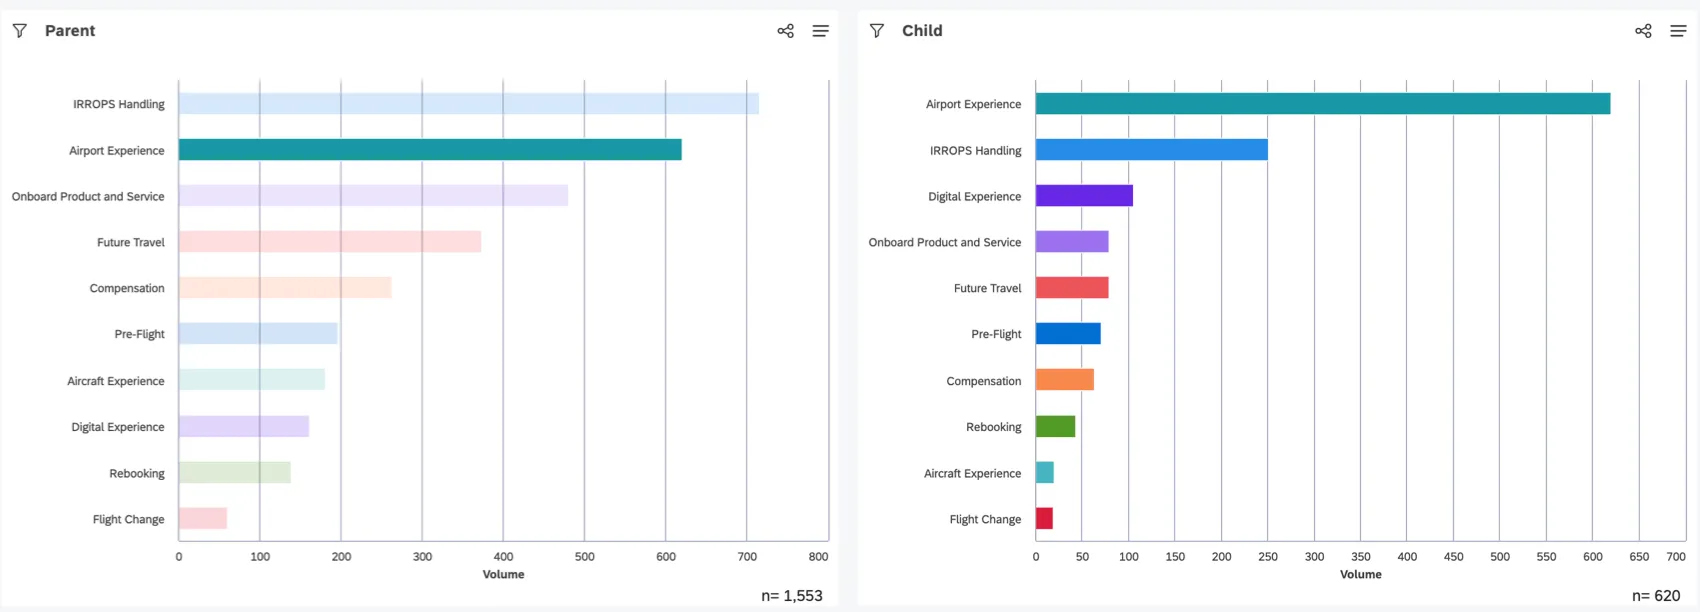
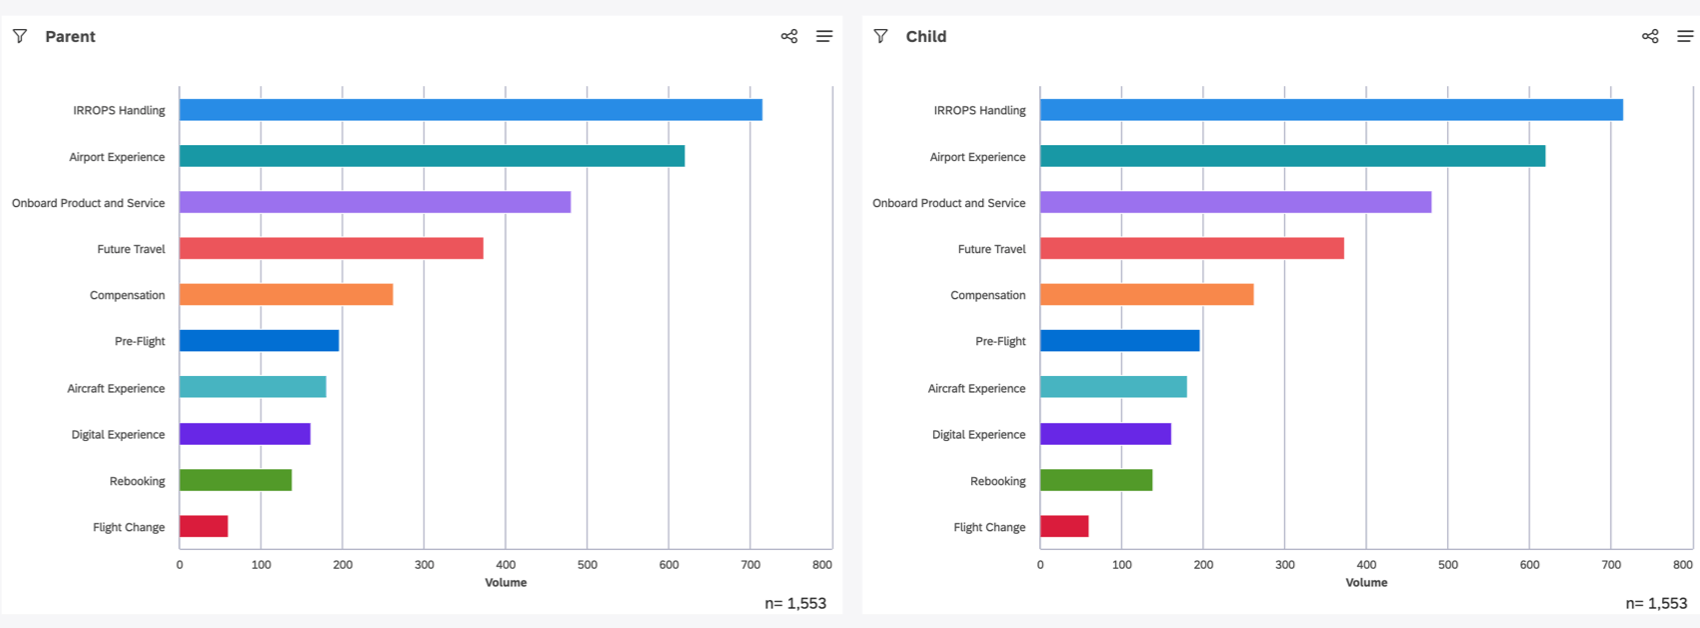
Example: We create a bar chart showing the volume for our top 10 topics. As its child, we create a duplicate of the same bar chart.

Now when we select a topic in the parent widget on the left, the widget on the right is filtered by that topic, revealing which other topics are mentioned most frequently along with it. The top topic will be the same topic you selected in the parent (since it has a 100% co-occurrence with itself), but you can see the other 9 most common co-occurrences.
In summary, filtering provides the ability to narrow the sample set of data being considered. Filtering topics by other topics results in a co-occurrence report, even when filtering and displaying topics within the same model. This is true no matter how the filter is applied: either manually or dynamically, by using widgets as filters.
Qtip: Use a heatmap widget with Box Size set to Constant size for a parent widget with equal-sized buttons.
Side-By-Side Drilling
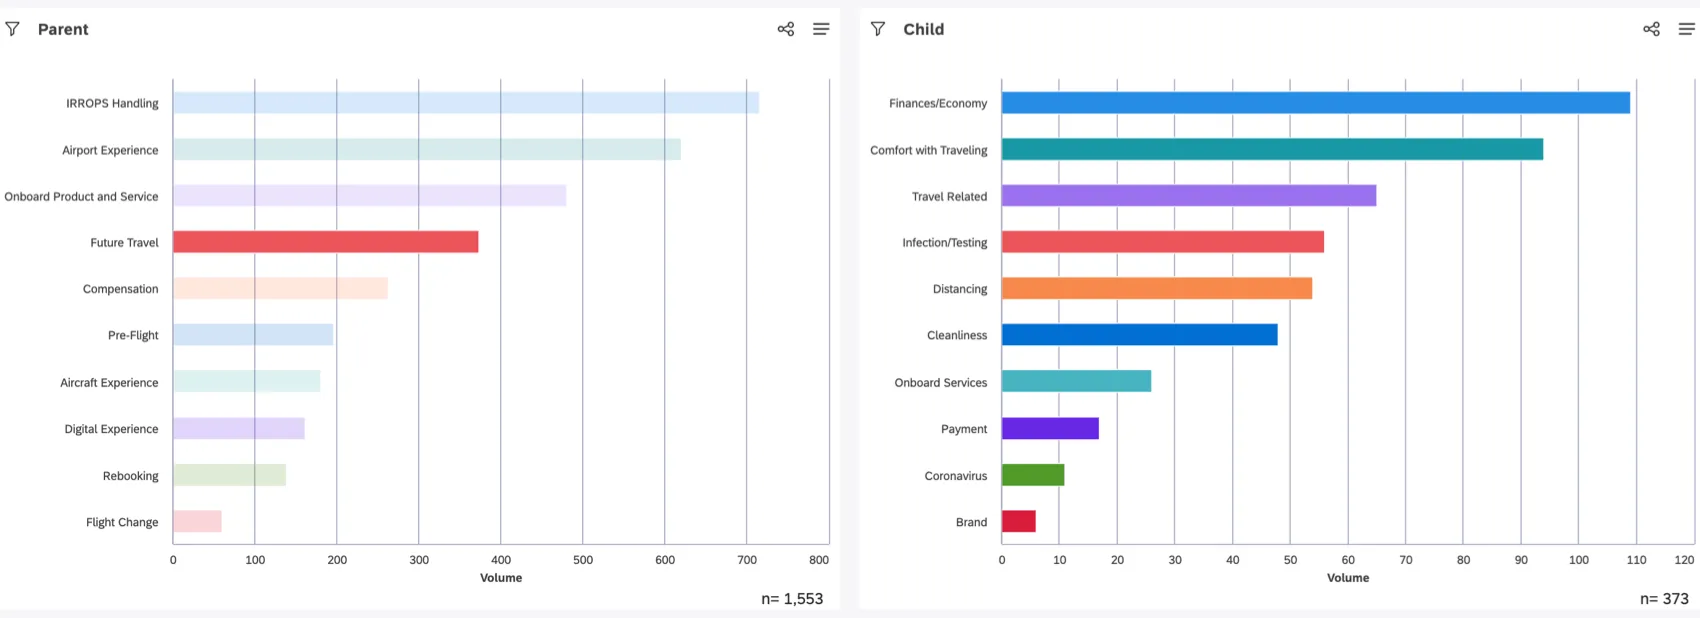
In addition to analyzing co-occurrences between different topics, you can use widgets as filters for side-by-side drilling, where you select a topic in a parent widget and view its subtopics in a child widget.
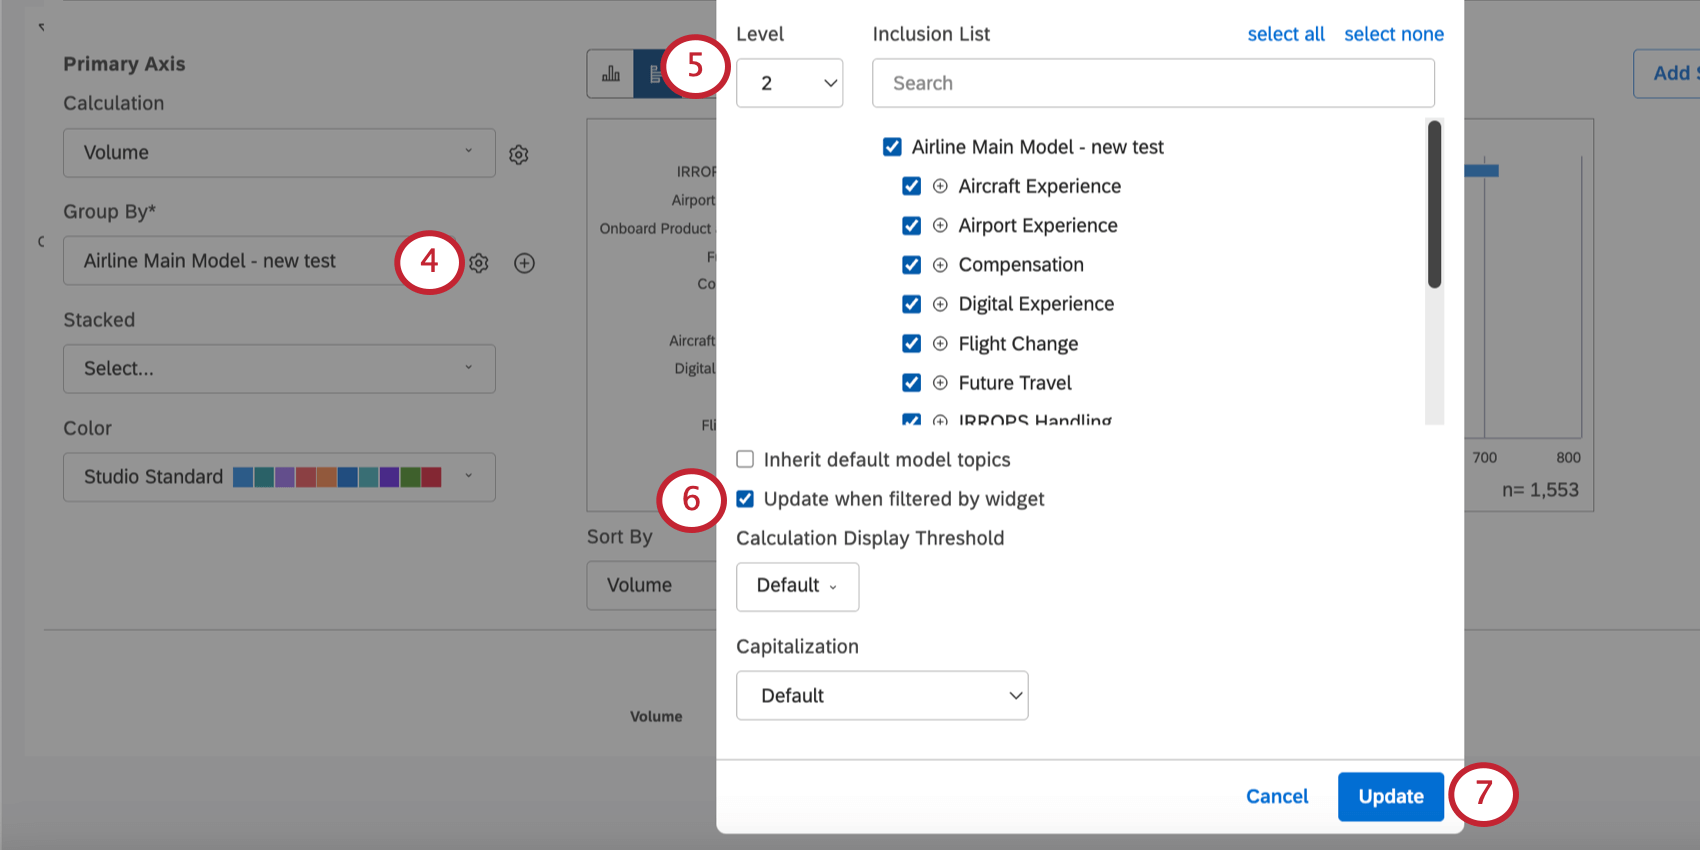
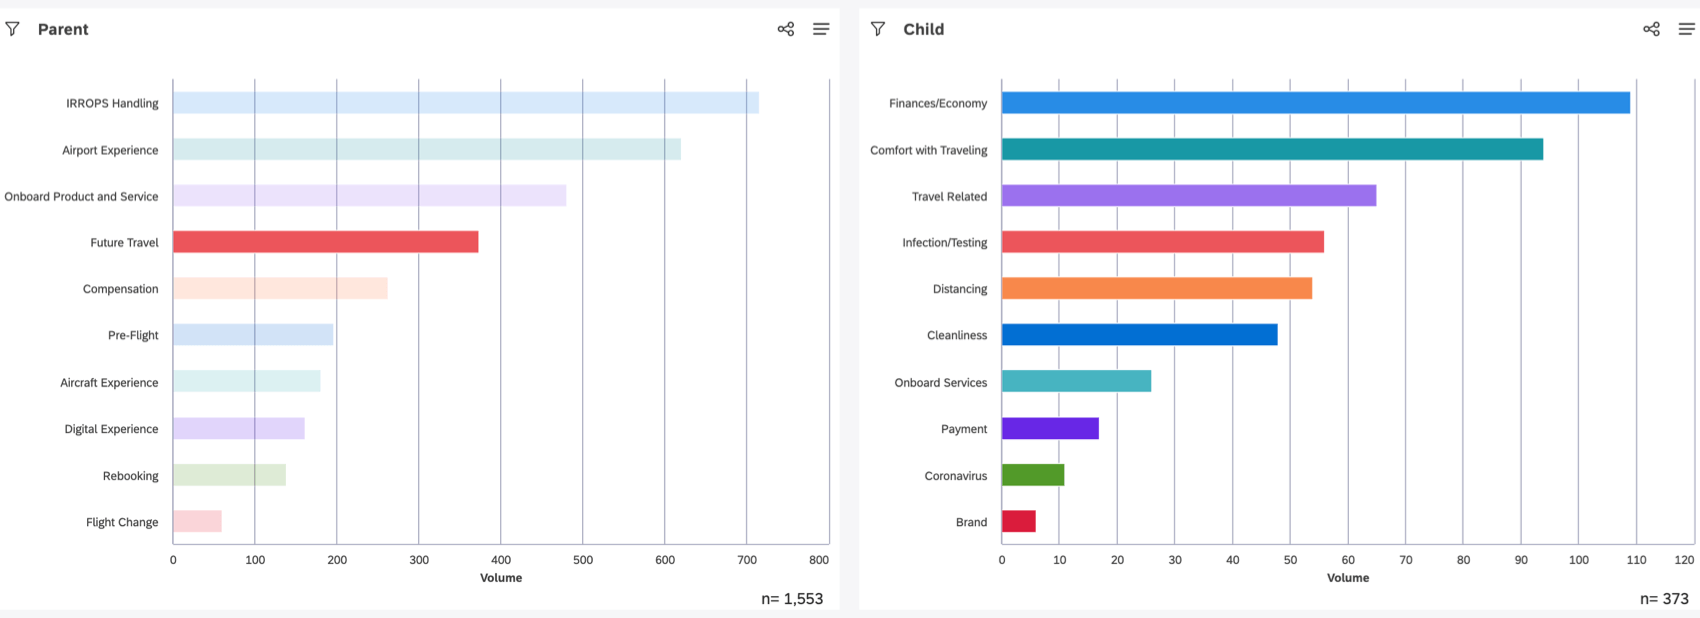
Example: Our parent widget is set to 1, so we set the child to 2.
Now when you select a topic in the parent widget on the left, the widget on the right only shows that topic’s subtopics.
That's great! Thank you for your feedback!
Thank you for your feedback!