
Reports Toolbar (360)
What's on this page
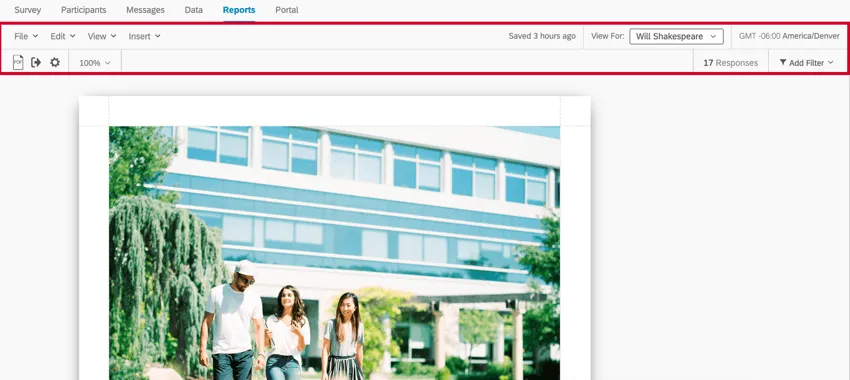
About the 360 Reports Toolbar
Once you create your first report, you will be provided with a toolbar to help you build and personalize your reports. This page will cover the function of each toolbar button.
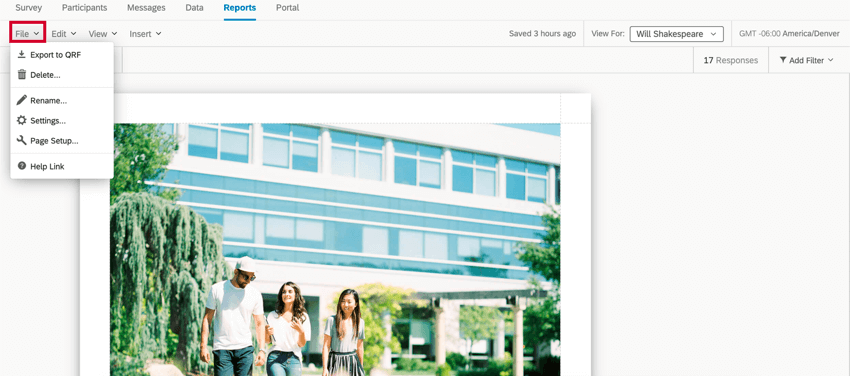
File Menu
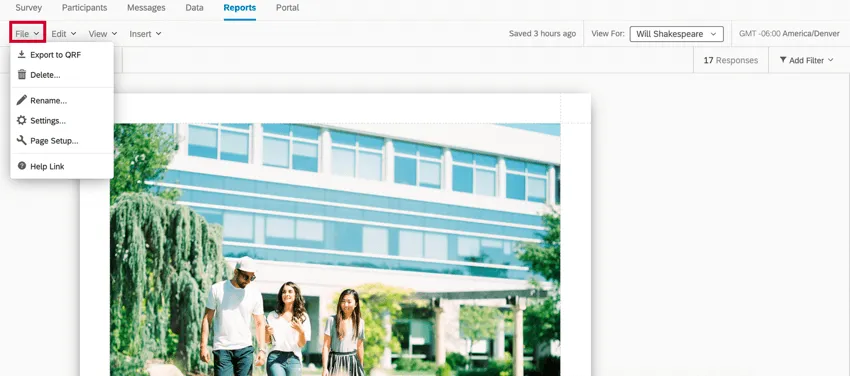
The File menu in your toolbar lets you perform various actions about your report’s global settings. See File Menu for more information about each option.
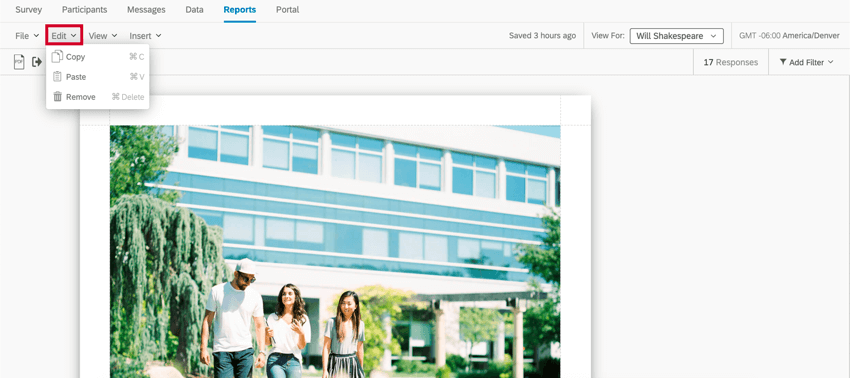
Edit Menu
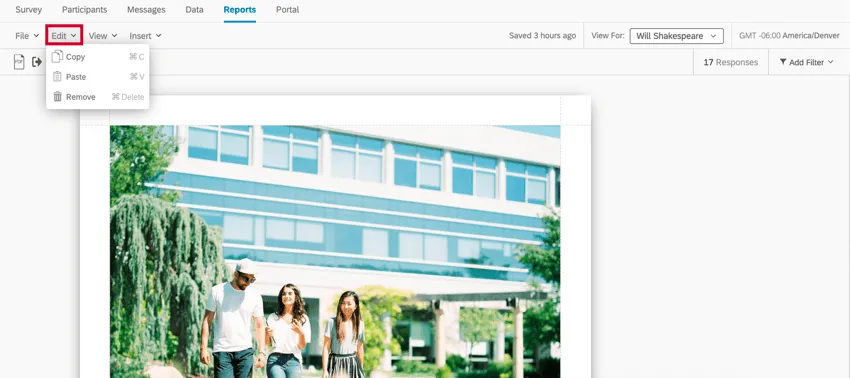
The Edit menu lets you copy, paste, and remove visualizations from your report. See Edit Menu for more information about each option.
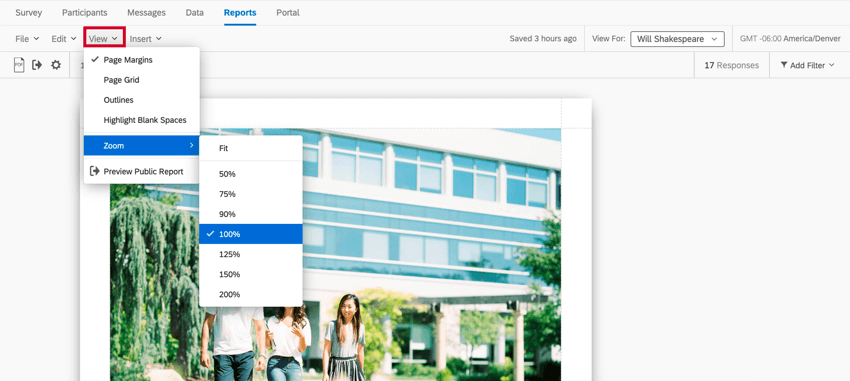
View Menu
The View button has settings that make it easier for you to edit your report. None of these settings are visible in public reports or in the PDF export.
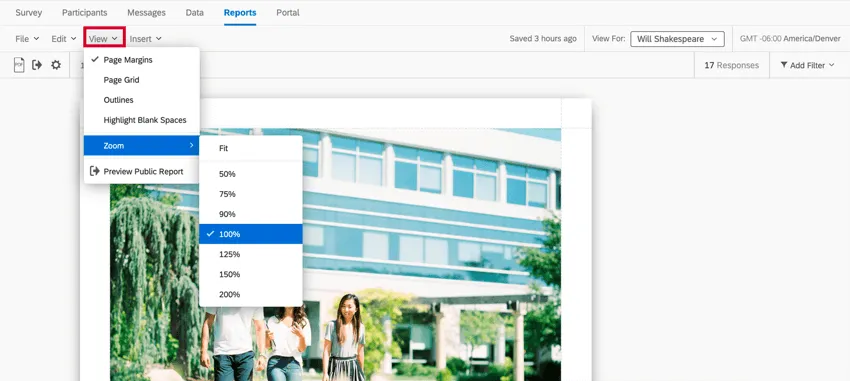
See View Menu for more information about each option. Unique to 360 reports is the Preview Public Report, which creates a preview version of your report that you can send to others to test how it will appear before pushing your report live.
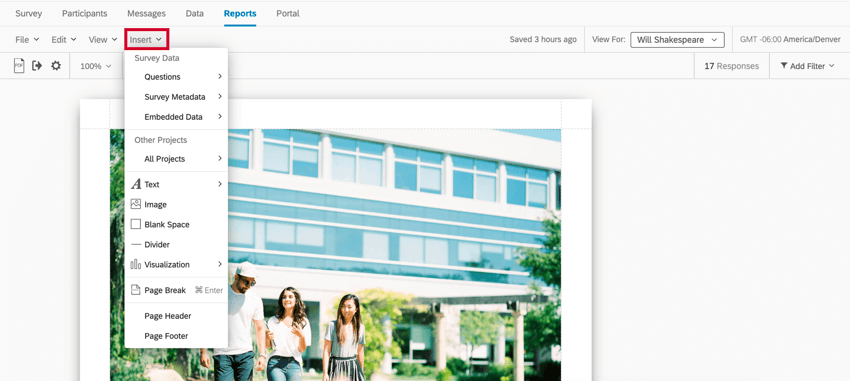
Insert Menu

The Insert button on the toolbar allows you to add content to your reports, including visualizations, page breaks, headers and footers. See our Inserting Report Content (360) page for more information.
Time Zone
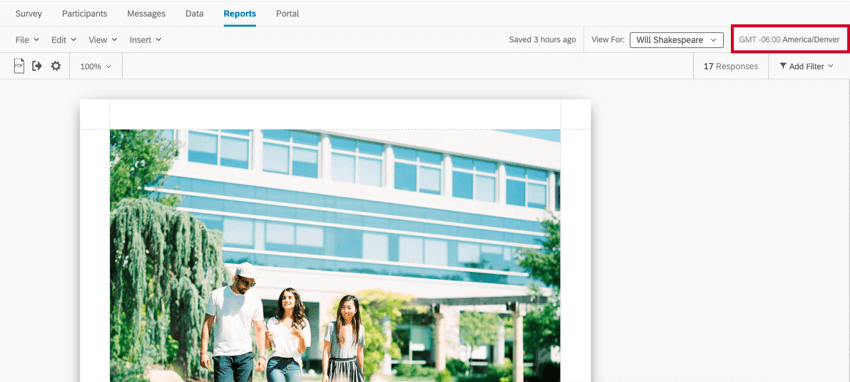
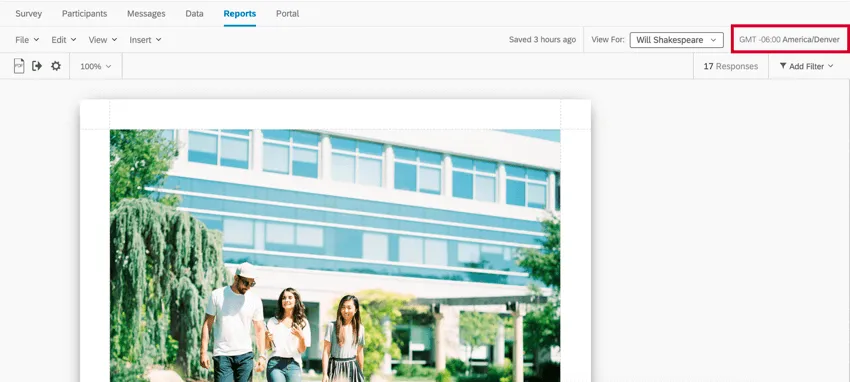
The toolbar displays the report’s time zone. You can change this by adjusting the Locale Global Settings. By default, the report’s time zone will revert to whatever is in your account settings.
Response Count
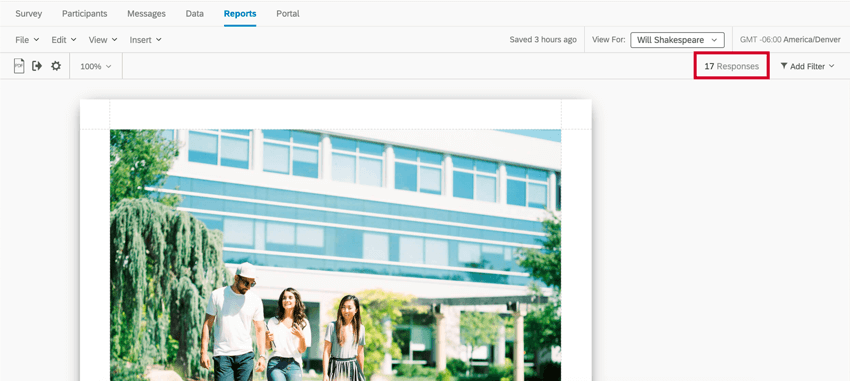

The toolbar also displays the entire 360 survey’s response count. The response count is equal to the number of recorded responses and does not include responses still in progress. This number will adjust if you add a global filter to your report.
Global Filters
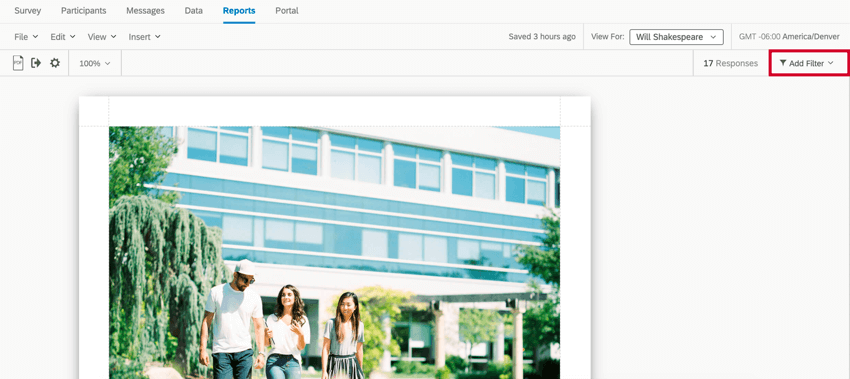
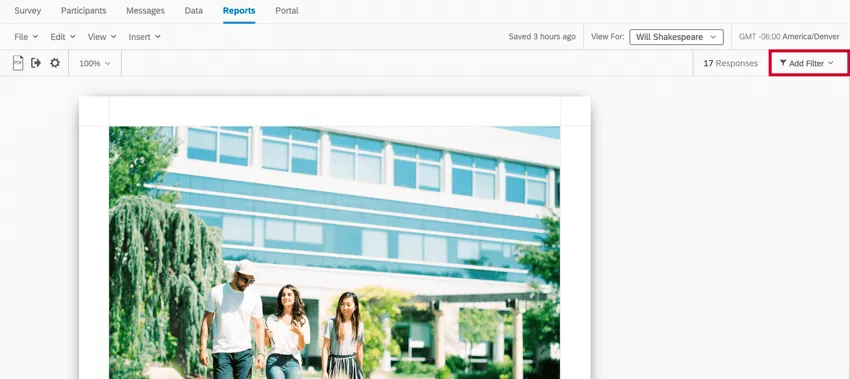
You can filter your entire report using the Add Filters button on the toolbar. You can also create and save new filters for use elsewhere in the report.
Qtip: We recommend adding filters to individual visualizations rather than the entire report.
There are two kinds of filters in 360 reports:
- Rater group filters, which narrow down data by evaluator relationships.
- Basic filters based on other information, such as responses to questions, demographic data, employee metadata, and so on.
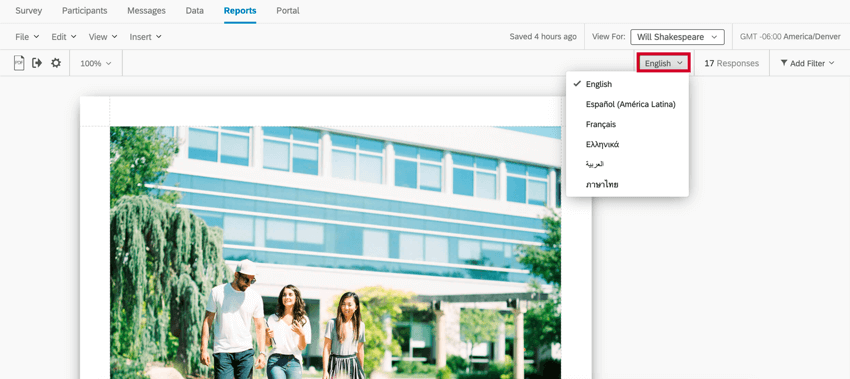
Translating 360 Reports
The advanced report can display text from the survey in every language that the survey has been translated to. This includes question text, answer choices, and all other survey content that is translatable. All available survey languages are shown in the dropdown in the report toolbar. For more details about translation, see our page about Translating a Report.
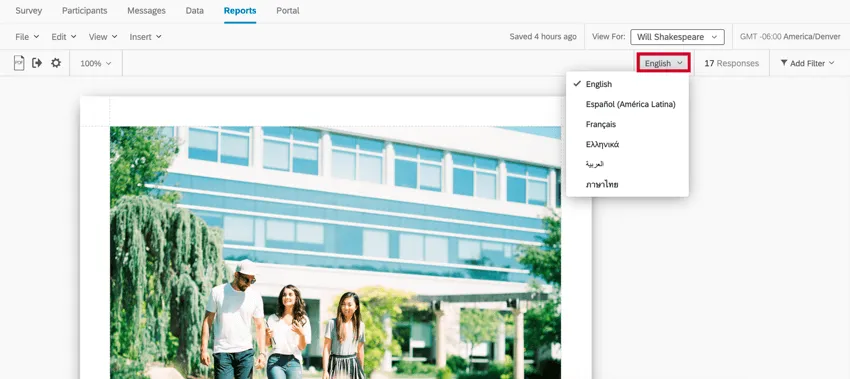
Attention: The language picker does not change the language of any entered text in the report such as descriptions, headers or custom labels. Any edit in the report will apply for all languages selected in the toolbar.
That's great! Thank you for your feedback!
Thank you for your feedback!