
Response Quality Functionality
What's on this page
About Response Quality Functionality
Response Quality is a lot like ExpertReview, but instead of assessing the quality of your survey, Response Quality tells you the quality of the data you have collected. It can also help you filter for this data, making it easier for you to clean your data at the end of your research.
Qtip: Response Quality can assess poor completion rate, poor completion rate within a 24 hour window, bots, duplicates, and requests for sensitive data. For more on how responses are flagged, see Response Quality.
Enabling Response Quality Detection
Response Quality will check the survey’s completion rate and respondents’ speed without any additional settings being enabled. However, in order to detect bots, duplicates, or sensitive data, Response Quality must be paired with other Qualtrics features.
Fraud Detection
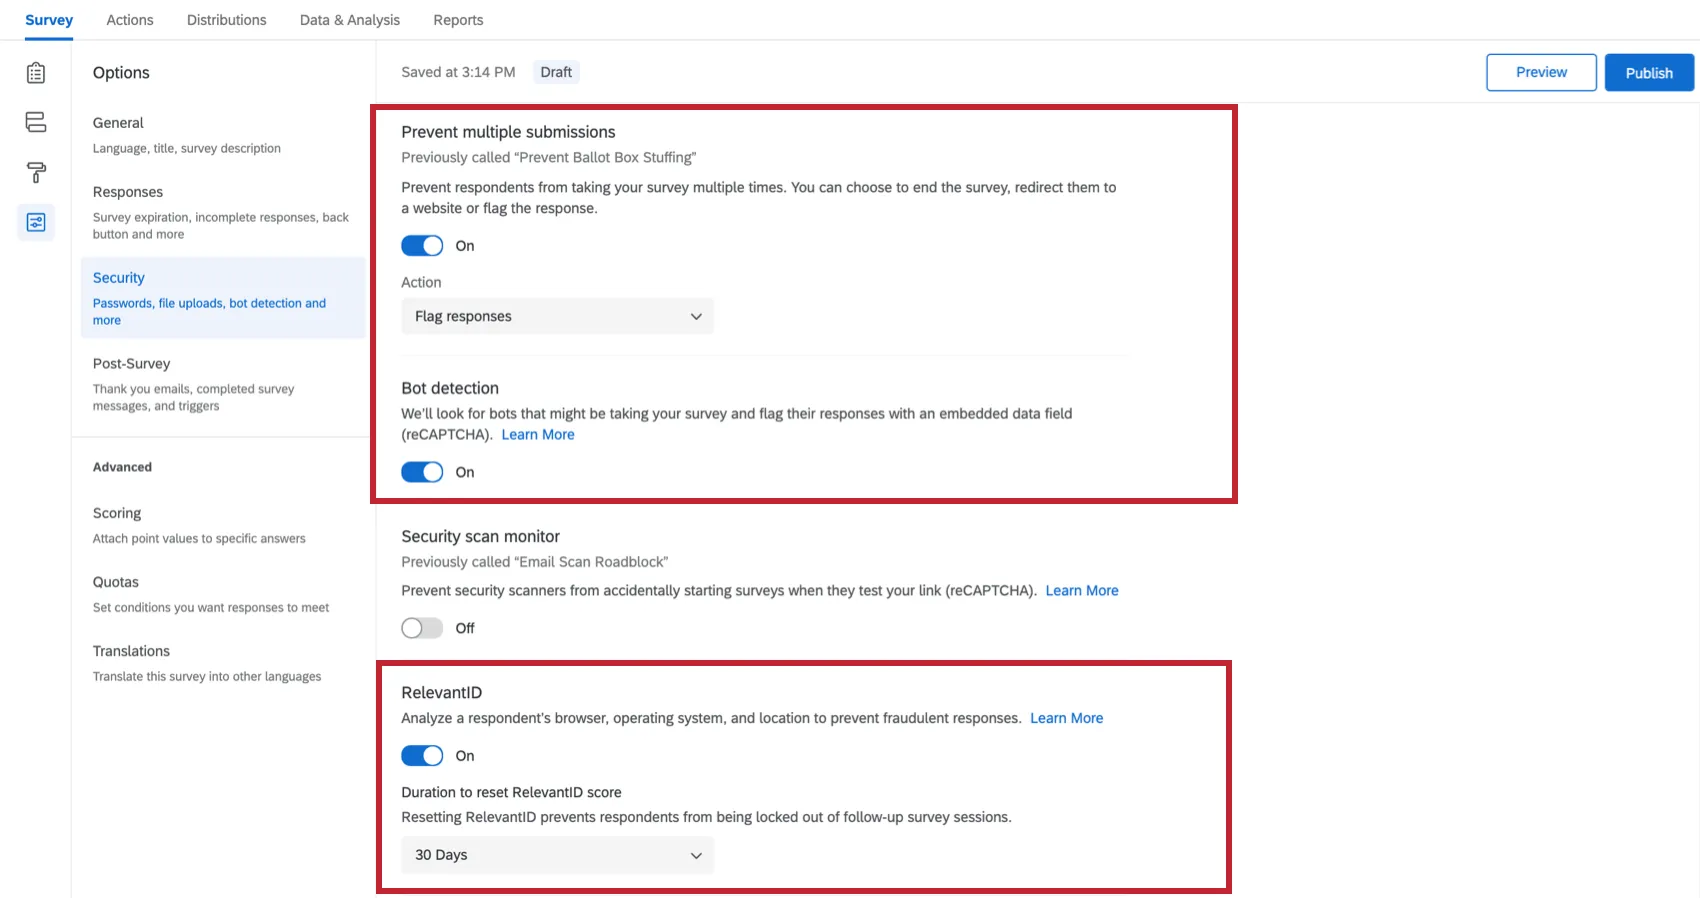
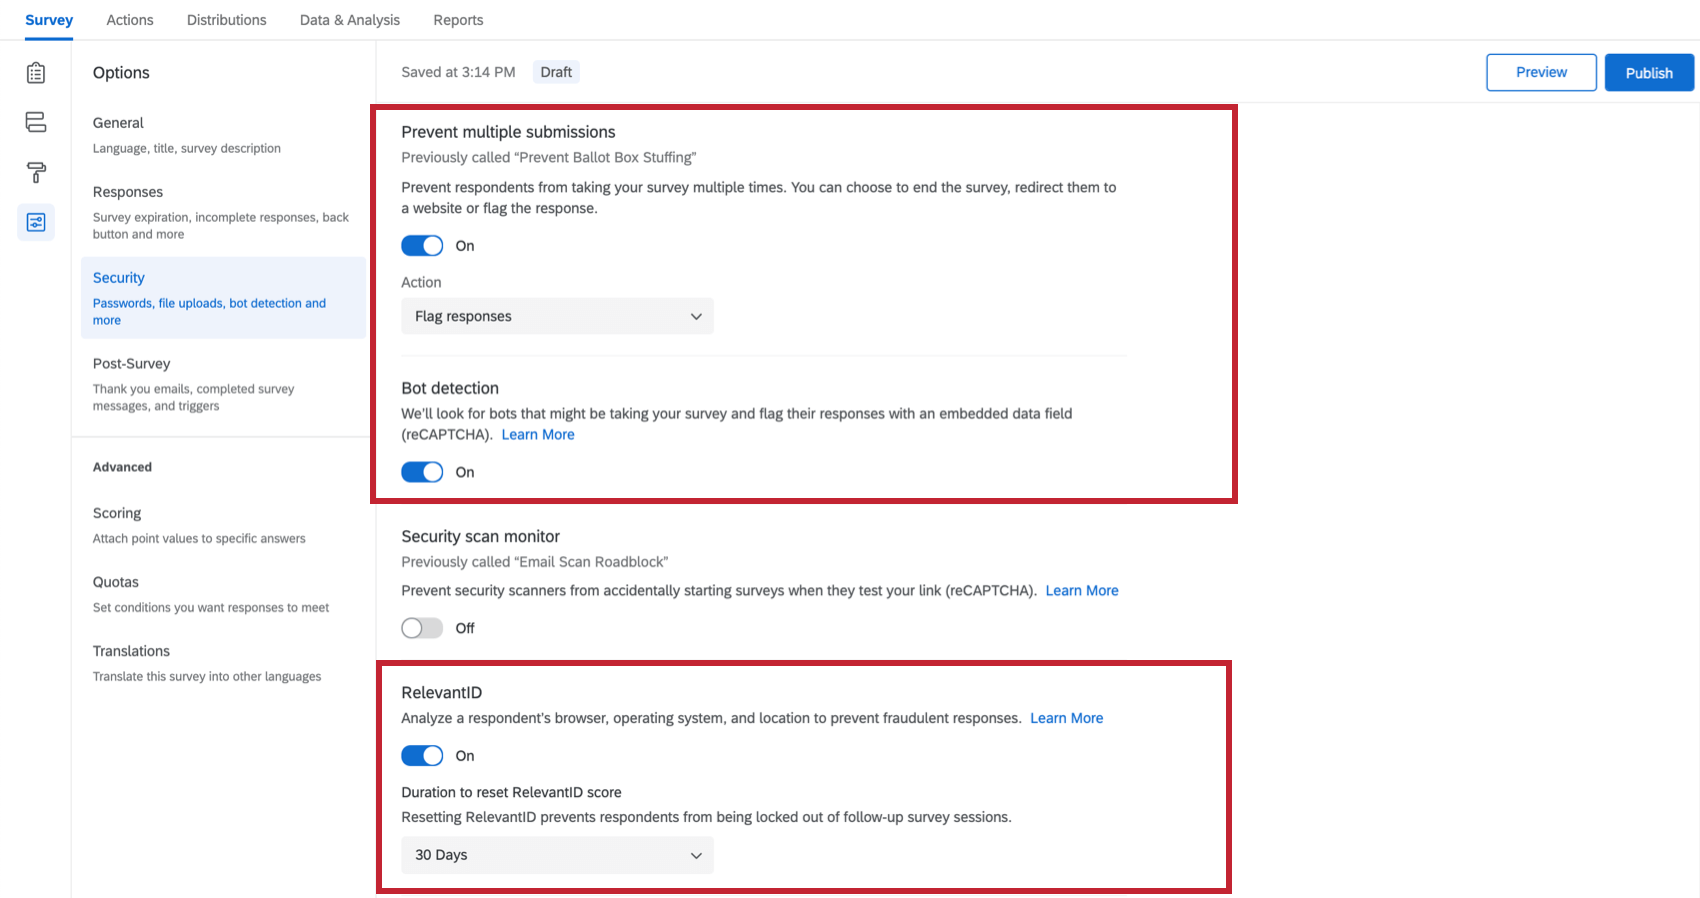
In order to detect duplicate or bot responses, you need to have access to Fraud Detection. At any time during data collection, you can enable the appropriate Survey Options:
- In order to detect whether the respondent has taken the survey more than once, you can enable 1 of the following Survey Options:
- Prevent multiple submissions: Flag responses.
- Duplicate detection: Flag responses.
- In order to detect whether the respondent is likely a bot, enable bot detection.
Sensitive Data
In order to detect whether or not survey responses contains sensitive data, your Brand Administrator has to have set up a Sensitive Data Policy. Sensitive Data Policies are brand-specific standards that determine when a survey question violates respondents’ rights to privacy. Sensitive data can include anything from Social Security Numbers to Phone Numbers; the parameters are determined by your organization’s administrators, not Qualtrics.
Viewing Response Quality
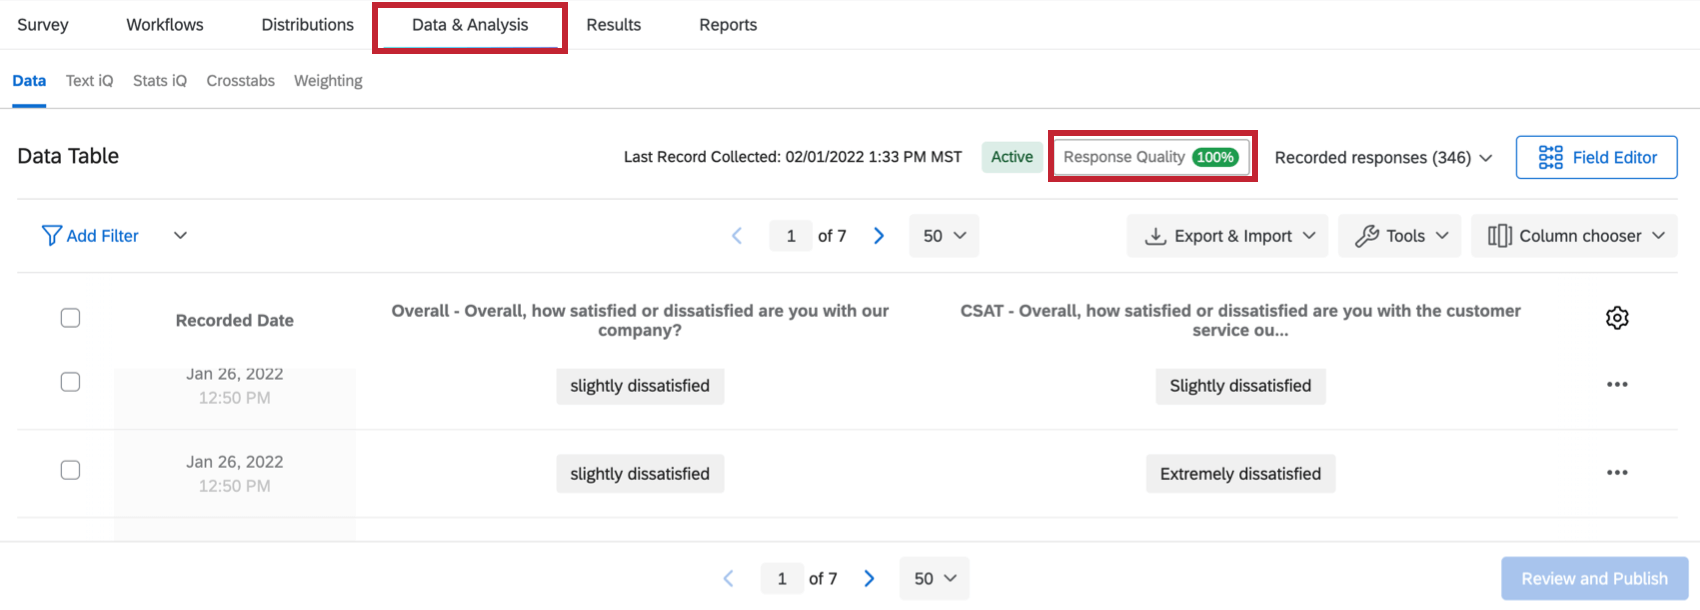
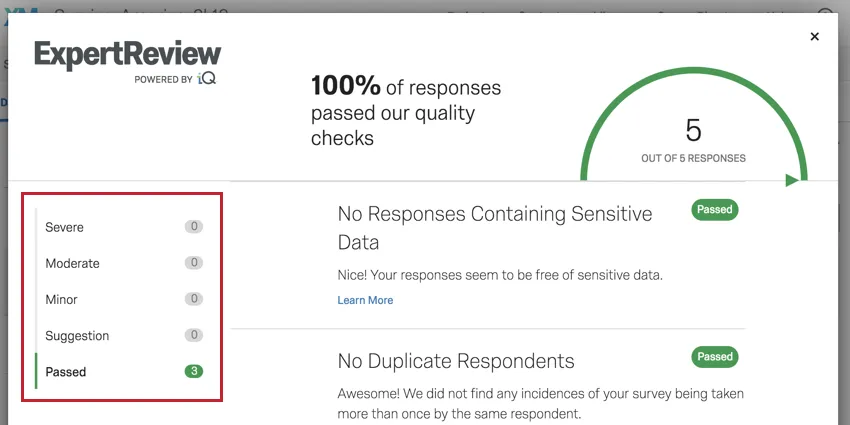
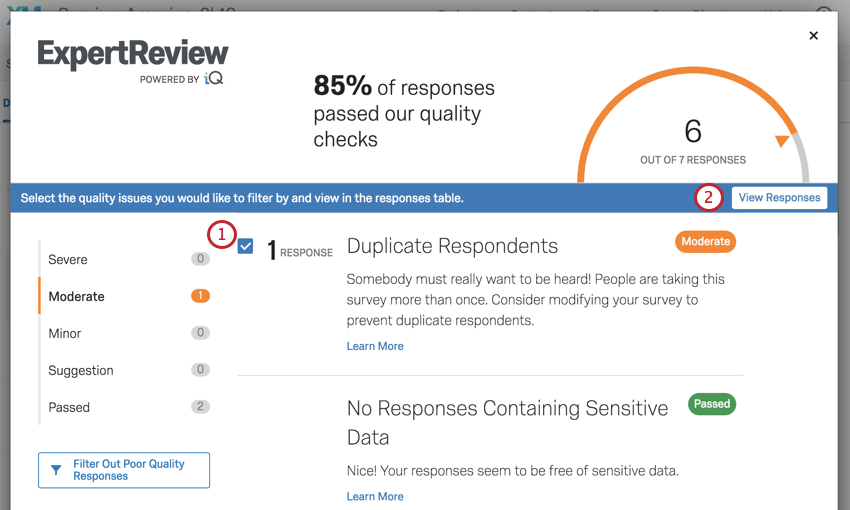
Response Quality can be viewed by going to Data & Analysis and selecting Response Quality. The percentage you see will be the percentage of high-quality responses you’ve collected. The color will correspond not just to percentage of flagged responses, but the severity of those flagged issues.

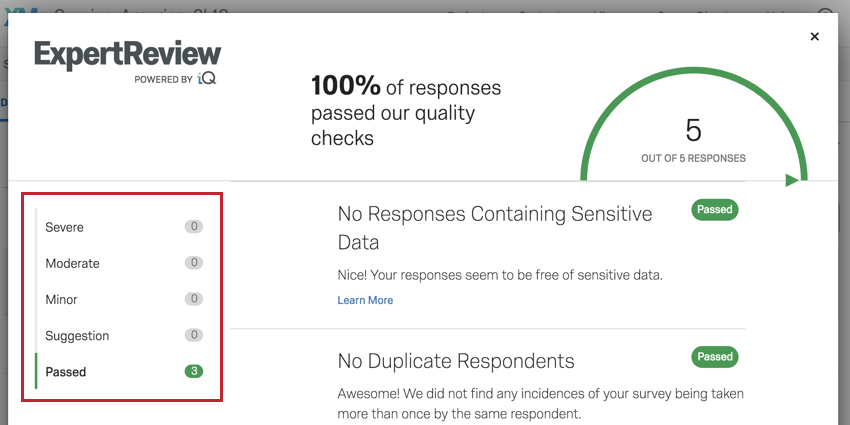
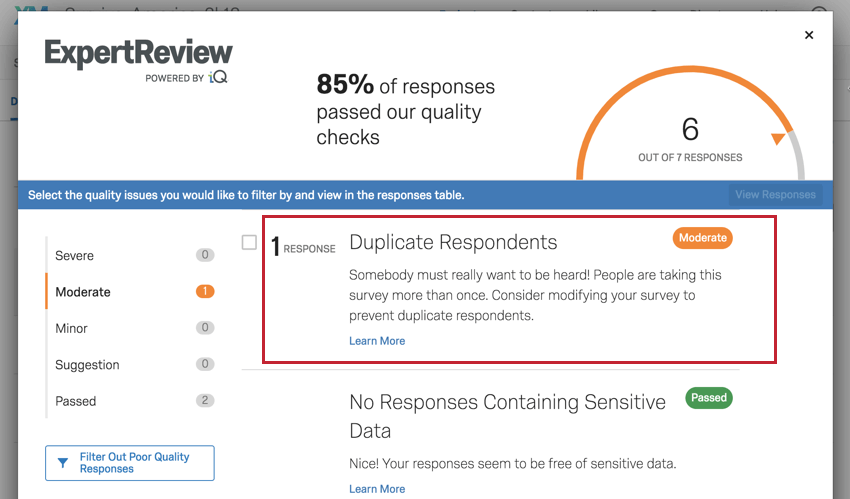
Once inside, issues are sorted from most to least severe, with checks that your respondents passed appearing at the bottom of the list. You can use the menu to the left to view items by severity.
Each issue comes with a description, the number of responses that were flagged with this issue, and a link to a support page that explains the issue further in depth.

Filtering Out Poor Quality Responses
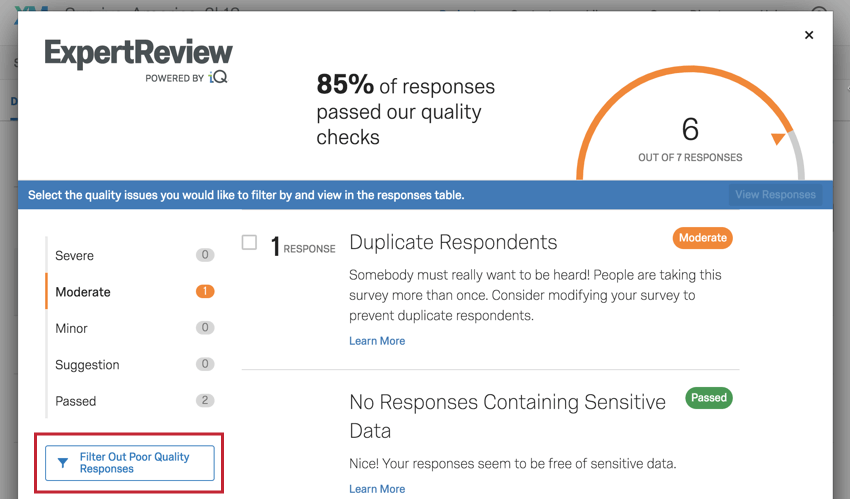
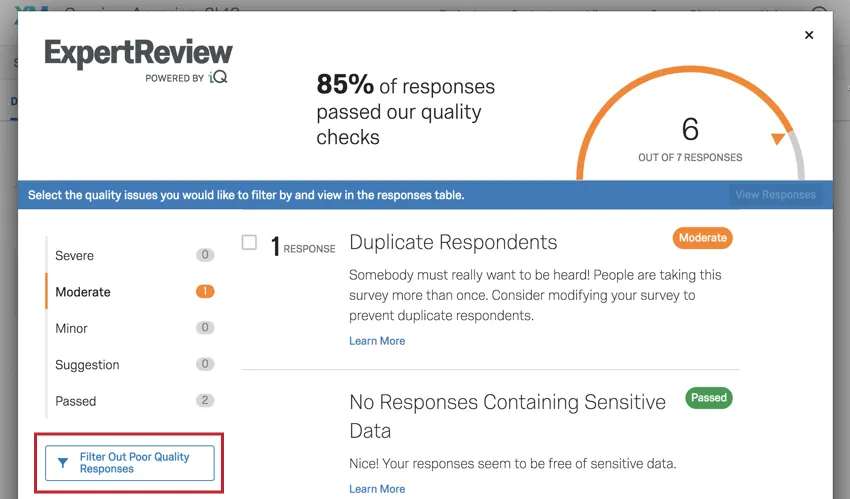
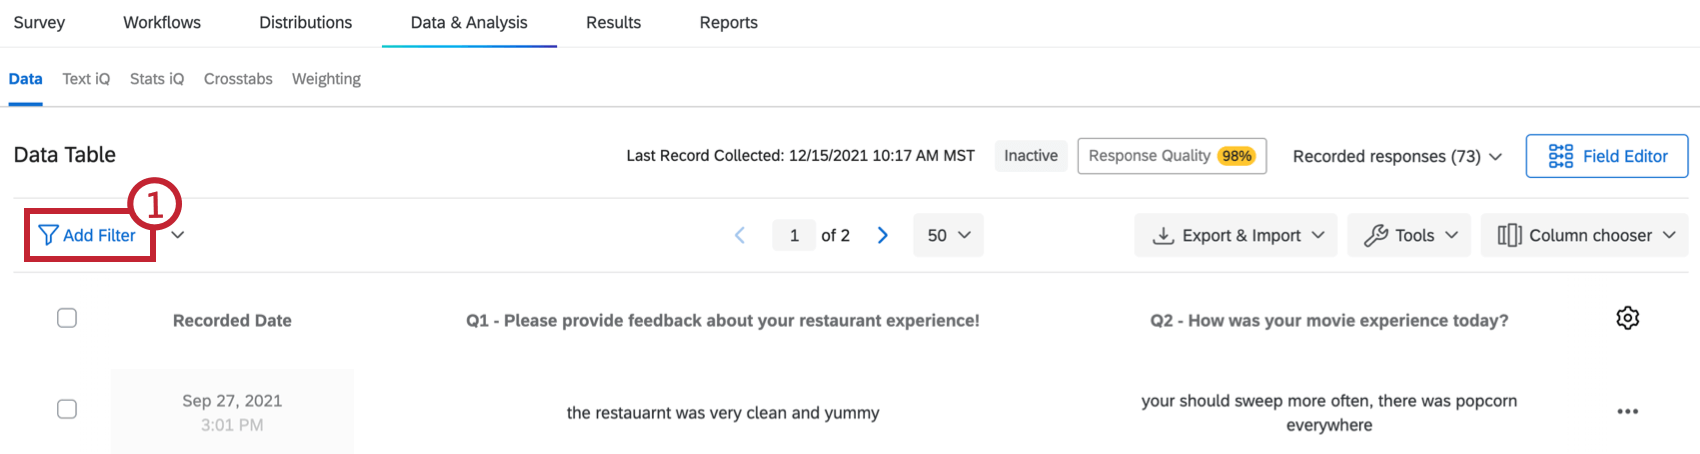
You can filter out all the responses you collected that have been flagged, so that you only see results from high quality data. To start, select Filter Out Poor Quality Responses.
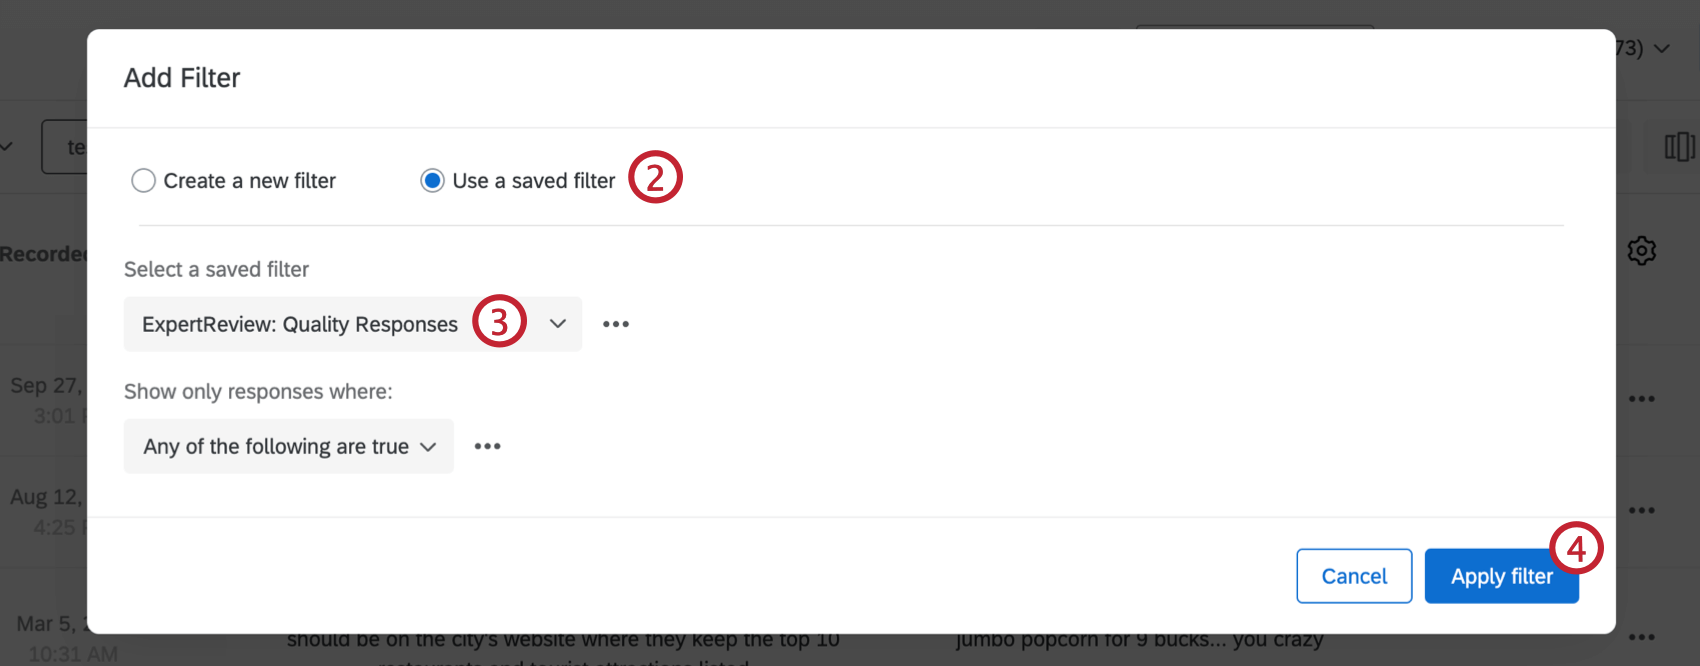
Now that you’ve used this filter, it will be saved, so you can use it later or apply it to Results and Advanced-Reports. This filter can be managed like other saved response filters.
Qtip: Responses are excluded from these filters for matching any of the poor Response Quality parameters. To filter by a particular issue, see Filtering Response by Issue.
Filtering Responses by Issue
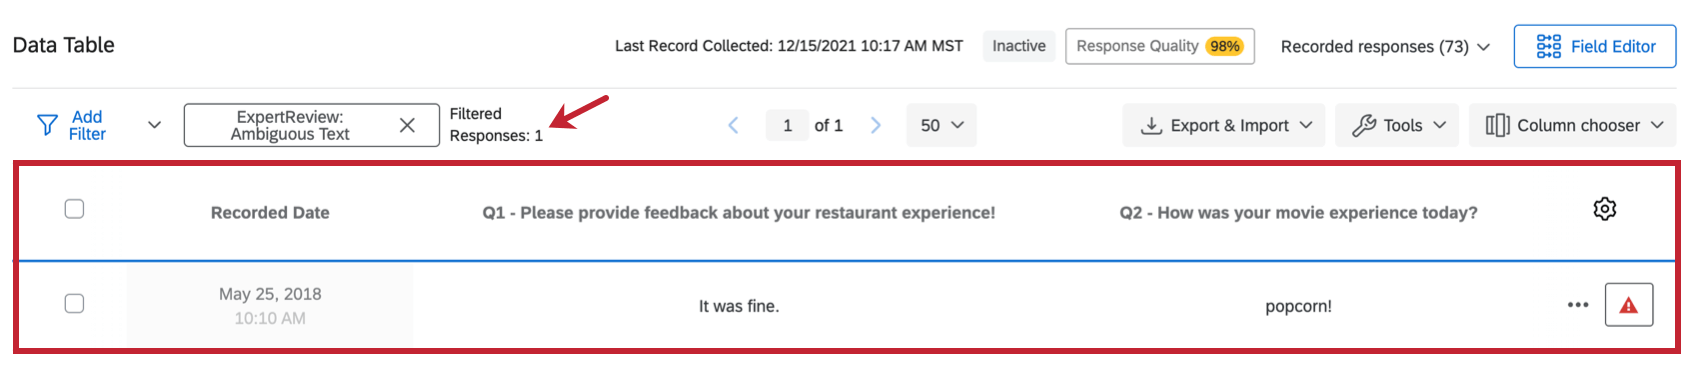
You can easily filter so you only see responses that have been flagged for selected issues. This means you can look at your flagged responses and determine what you’d like to do with them.
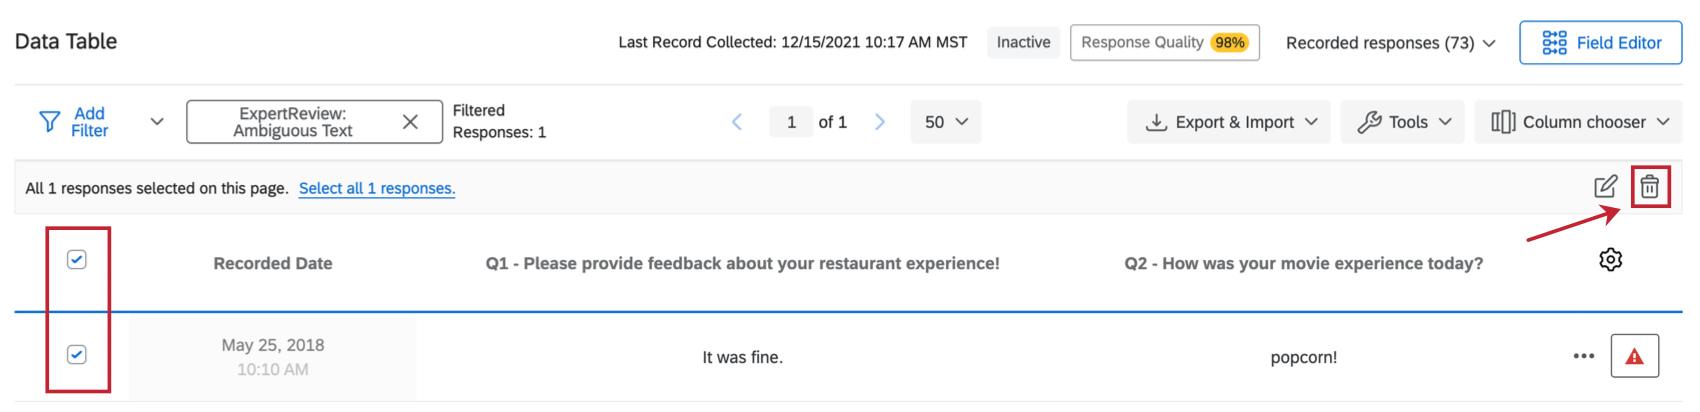
Attention: Remember that once responses are deleted, they cannot be retrieved. As an alternative, you can filter out flagged responses and reuse filters as needed.
Qtip: Now that you’ve filtered by this issue, the filter will be saved and you can apply it to Results and Advanced-Reports. This filter can be managed like other saved response filters.
Types of Projects with the Response Quality Feature
Response Quality is available in just about every type of project with a Data tab, so long as it’s included in your license. Supported projects include:
- Survey projects
- Engagement
- Lifecycle
- Ad Hoc Employee Research
- Pulse Qtip: Response Quality is available for individual pulse surveys, but not for the entire program collectively.

- 360 Attention: 360 is not compatible with Fraud Detection. Response Quality features related to Fraud Detection are not available for 360.

- Conjoint
- MaxDiff
That's great! Thank you for your feedback!
Thank you for your feedback!