
Combining Respondent Funnel, Ticket, & Survey Data in a Model (CX)
What's on this page
About Combining Respondent Funnel, Ticket, and Survey Data in a Data Model
The data modeler gives you the freedom to combine many different data sources in one CX Dashboard. On this support page, we’ll cover how to get respondent funnel (directory information and distribution performance), ticket stats, and survey responses all in one dataset.
The most important thing to keep in mind is the order of the steps. Because this dataset will be a combination of specific unions and joins, you need to be careful what order you create each element – even sources.
Qtip: Unfortunately, due to limits with joins, you cannot make a version of this survey, funnel, and ticket dataset where you also join in contact data. This means you can’t use contact information like directory embedded data to filter the funnel, ticket, and survey results. However, there is a number of distribution and contact fields included as part of the funnel data.
Qtip: As you create your data model, recommendations will appear, making joins quicker and easier than ever. We recommend adding all of your key sources first, then seeing what your data modeler says to do next. For examples of datasets this feature can help you build, see Recommended Edits.
Combining Respondent Funnel, Ticket, and Survey Data in a Data Model
This solution is centered around survey data, and making sure that for each response, the ticket and distribution data is automatically connected. You’ll be able to use fields from any of your sources to filter and gather insights on your complete dataset.
Qtip: As you decide how to build your dataset, keep in mind how the left outer joins used in this example exclude certain information.
Data flows continuously through this setup. See more on continuous vs. periodic data updates.
Make sure funnel data is enabled.
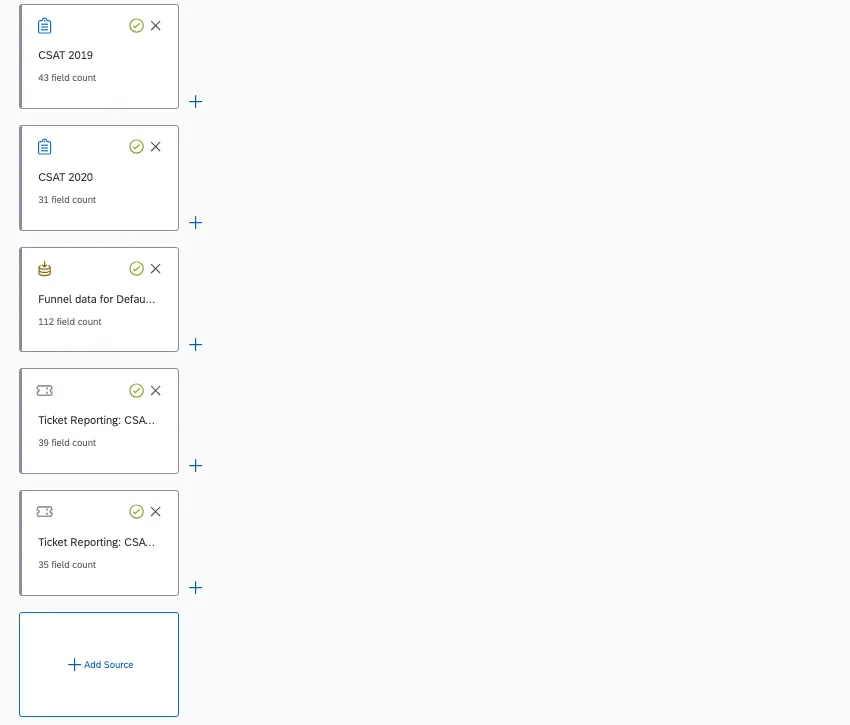
Click Add Source.
Add your surveys.
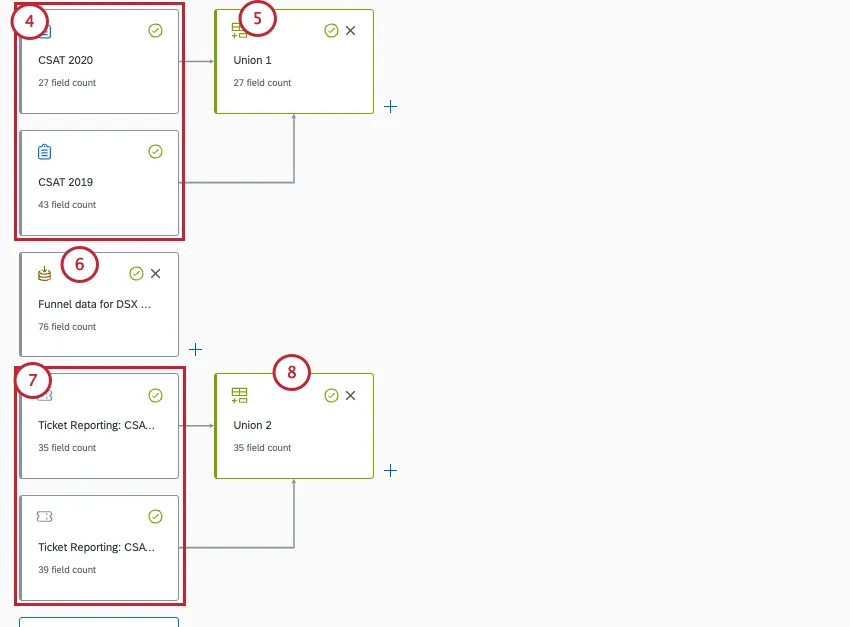
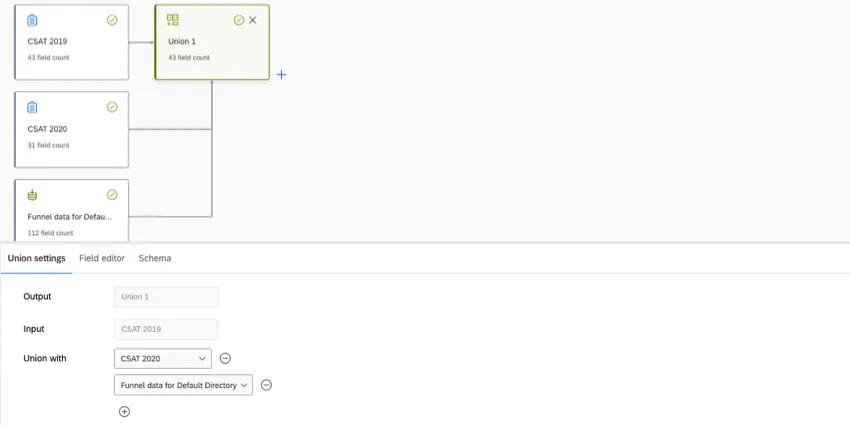
If you have multiple surveys, make a union with all of them.
Add your funnel.
Add your ticket data.
Qtip: These ticket sources need to match the surveys you’ve added.
If you have multiple ticket data sources, make a union with all of them. Make sure only ticket data is included in this union.
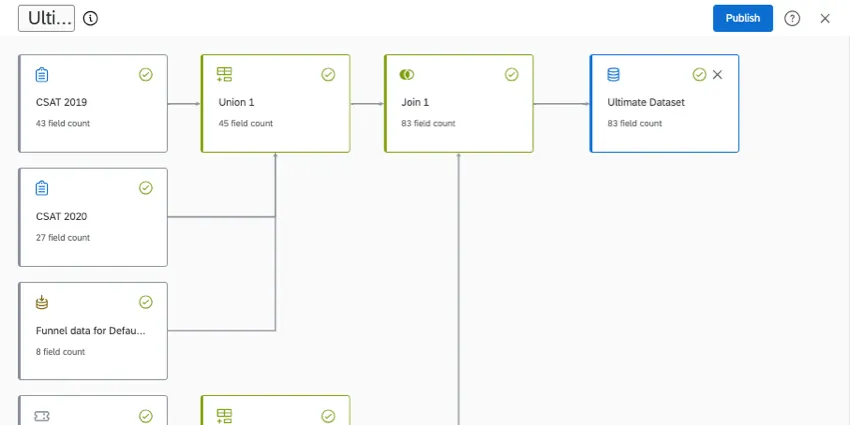
Next to your surveys union, create a left outer join.
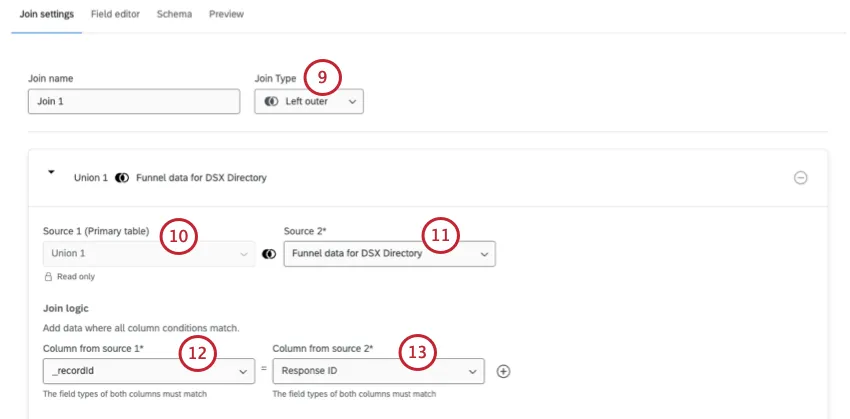
On the left (source 1) is your first union, survey data.
On the right (source 2) is your funnel data source.
The Join logic for the left (source 1) is _recordId.
The Join logic for the right (source 2) is Response ID.
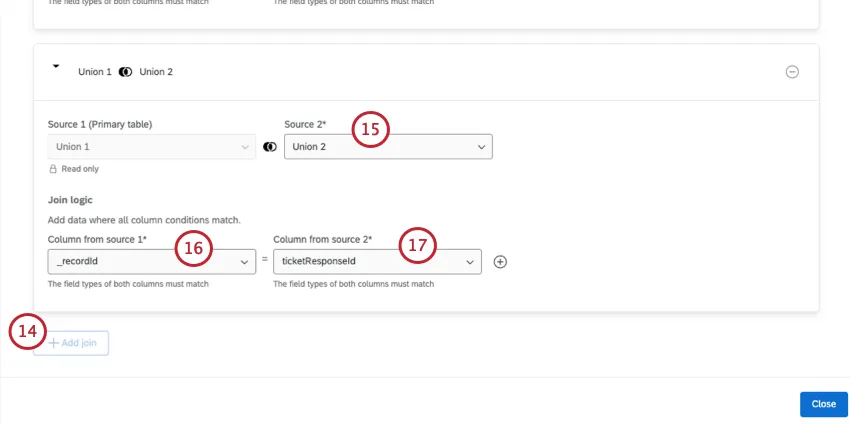
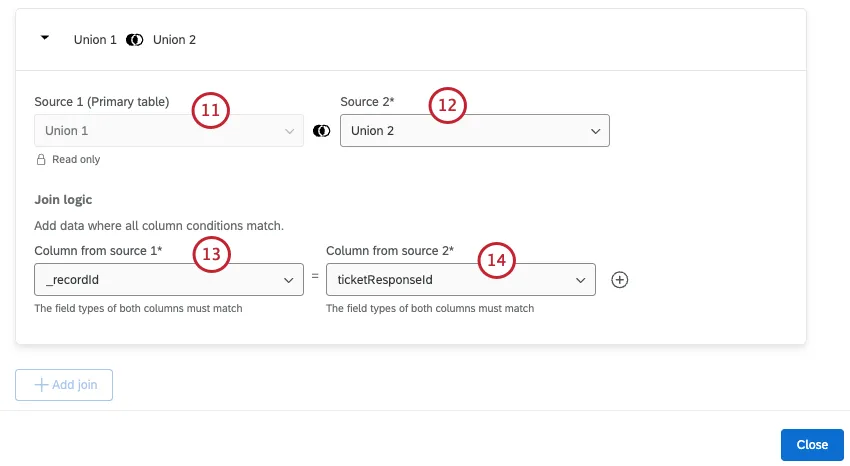
Add the ticket data source as the right source (source 2).
The Join logic for the left (source 1) is _recordId.
The Join logic for the right (source 2) is ticketResponseId.
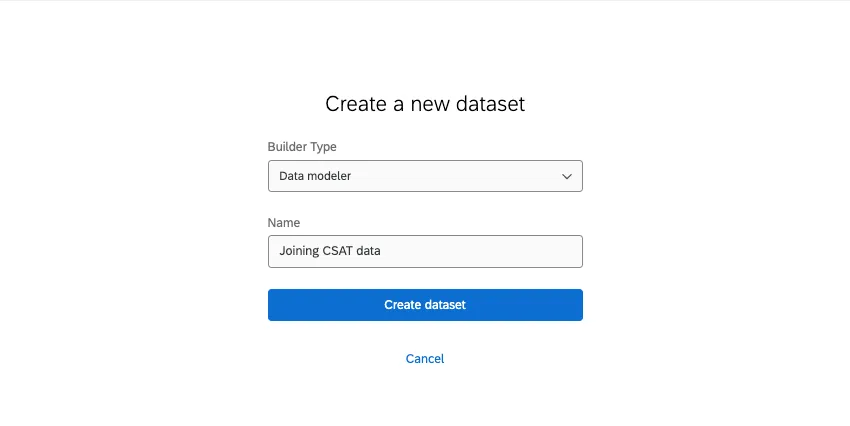
Create your output dataset.
Publish your changes.
Keeping Full Directory Funnel Data
This dataset will include ticket data, survey data, and funnel data. However, we’re going to start with a few assumptions:
- You want to report on distributions in the same dashboard, but in separate pages or widgets from response and ticket data.
- This option also ensures you keep all funnel data in your dataset, not just the distribution data that’s relevant to the tickets and surveys you’re mapping.
- You have multiple surveys, and thus multiple ticket sources you want to combine.
- Because your funnel won’t be linked to specific survey responses or tickets, filtering by funnel fields will only show filtered funnel data.
Data flows continuously through this setup. See more on continuous vs. periodic data updates.
Make sure funnel data is enabled.
Click Add Source.
Add your surveys.
Add your funnel.
Add your ticket data.
Qtip: These ticket sources need to match the surveys you’ve added.
Create a union of:
- Survey with the most fields (first source / input)
- All other relevant surveys
- Respondent funnel
Add each funnel field to the union.
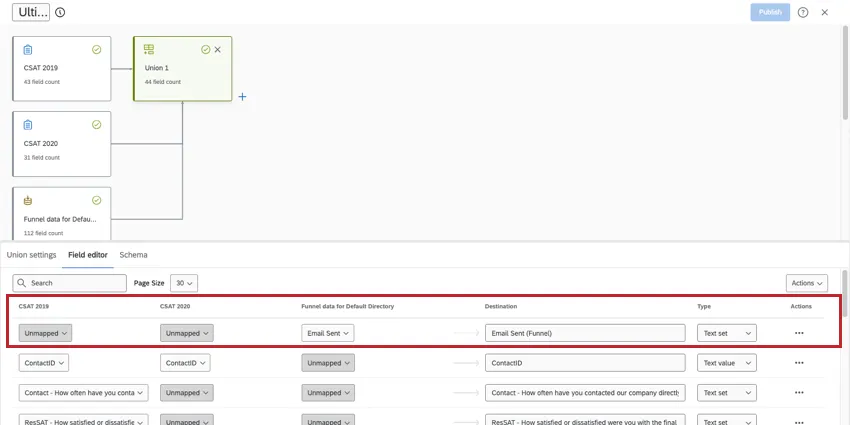
Qtip: See steps on adding new fields to data models, and a list of all respondent funnel fields.
Create a new union with just your ticket sources.
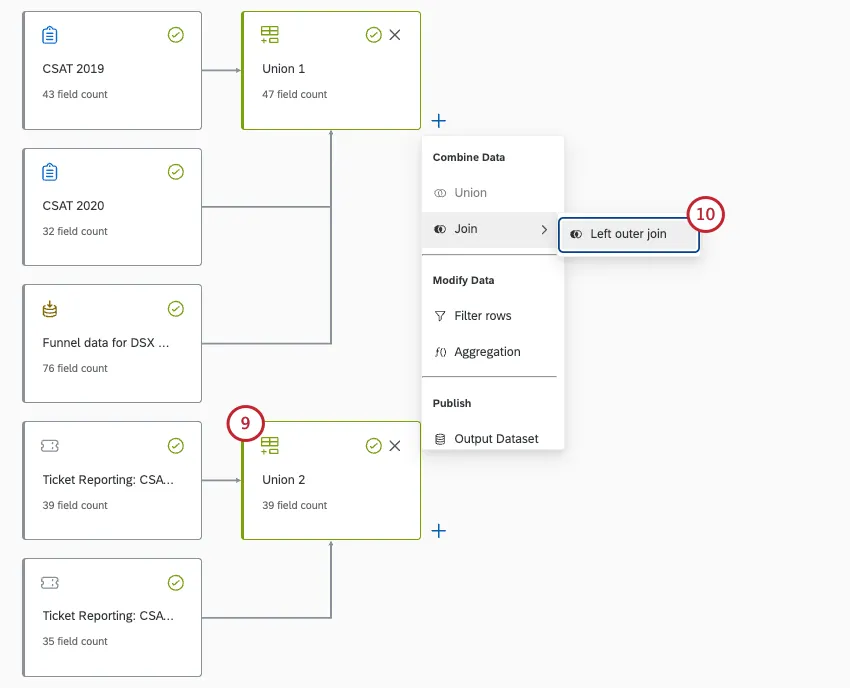
On the left (source 1) is your first union, which contains survey and funnel data.
On the right (source 2) is your second union, which contains ticket data.
The Join condition for the left is _recordId.
The Join condition for the right is ticketResponseId.
Create your output dataset.
Publish your changes.
That's great! Thank you for your feedback!
Thank you for your feedback!