-

Qualtrics Platform -

Customer Journey Optimizer -

XM Discover -

Qualtrics Social Connect
Managing Response Data (EX)
About Managing Employee Experience Response Data
Once you collect responses, they are stored in the Data & Analysis tab, where you can edit them, analyze them, export them, and more. This page describes how to manage response data for Engagement, Lifecycle, Pulse, and Ad Hoc Employee Research projects. For more details on each of these project types, see Types of Employee Experience Projects.
Recorded Responses
Recorded Responses include any survey response that was 100% completed by the respondent, as well as any incomplete responses that have been closed out. These responses, unlike Responses in Progress, are included in dashboard data.
The Recorded Responses page functions similarly in Employee Experience projects and in survey projects, except that in Employee Experience projects, you do not need to worry about your data containing preview or test responses, and dashboards replace the other reporting features available in the Survey Platform.
Recorded Responses can be viewed by navigating to the Data & Analysis tab and making sure Recorded Responses is selected on the right.
Filtering Responses
Navigate to the Data & Analysis tab and click Add Filter on the top-left. You can even save these filters for later if you’d like.
Filtering responses in Employee Experience projects is very similar to filtering responses in the Survey Platform, with just two key differences in the fields you can filter by.
First, you can find metadata fields listed under Embedded Data. This includes the participant’s full name, Unique Identifier, email, and parent unit.
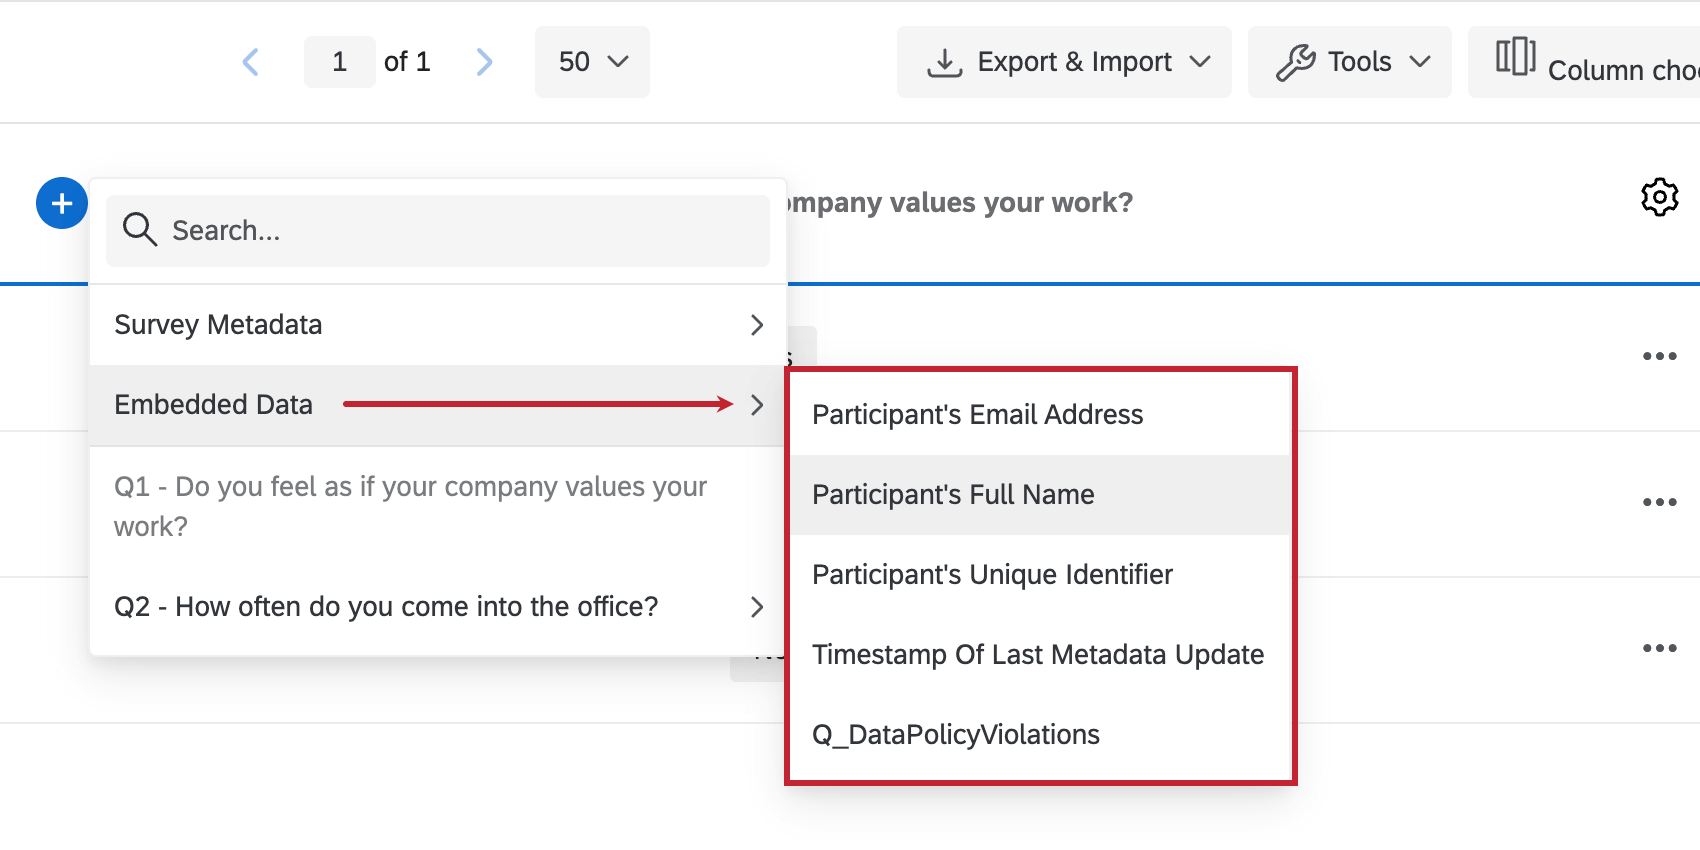
Second, you will not see an option for Contact or Panel info, but that’s because participant contact information is stored under Embedded Data.
Choosing Columns
You can customize the data that appears on your Recorded Responses page by choosing columns. This works the same way in Employee Experience projects as it does in survey projects.
When adding and removing columns for metadata or participant info, look under Embedded Data.
Saving Layouts
After you’ve finished choosing columns, you can save this layout so you can feel free to change the columns again without losing configurations you may want to reuse. This works exactly the same in Employee Experience projects as it does in survey projects, so see our page on saving layouts for more details.
Navigating the Data Table Pages
Navigating the Data Table pages works the same way in Employee Experience projects as it does in survey projects.
Viewing Individual Responses
Viewing individual responses works the same way in Employee Experience projects as it does in survey projects. Note that these responses do not contain participant-identifying information.
Exporting an Individual Response to PDF
Exporting an individual response to PDF works the same way in Employee Experience projects as it does in survey projects.
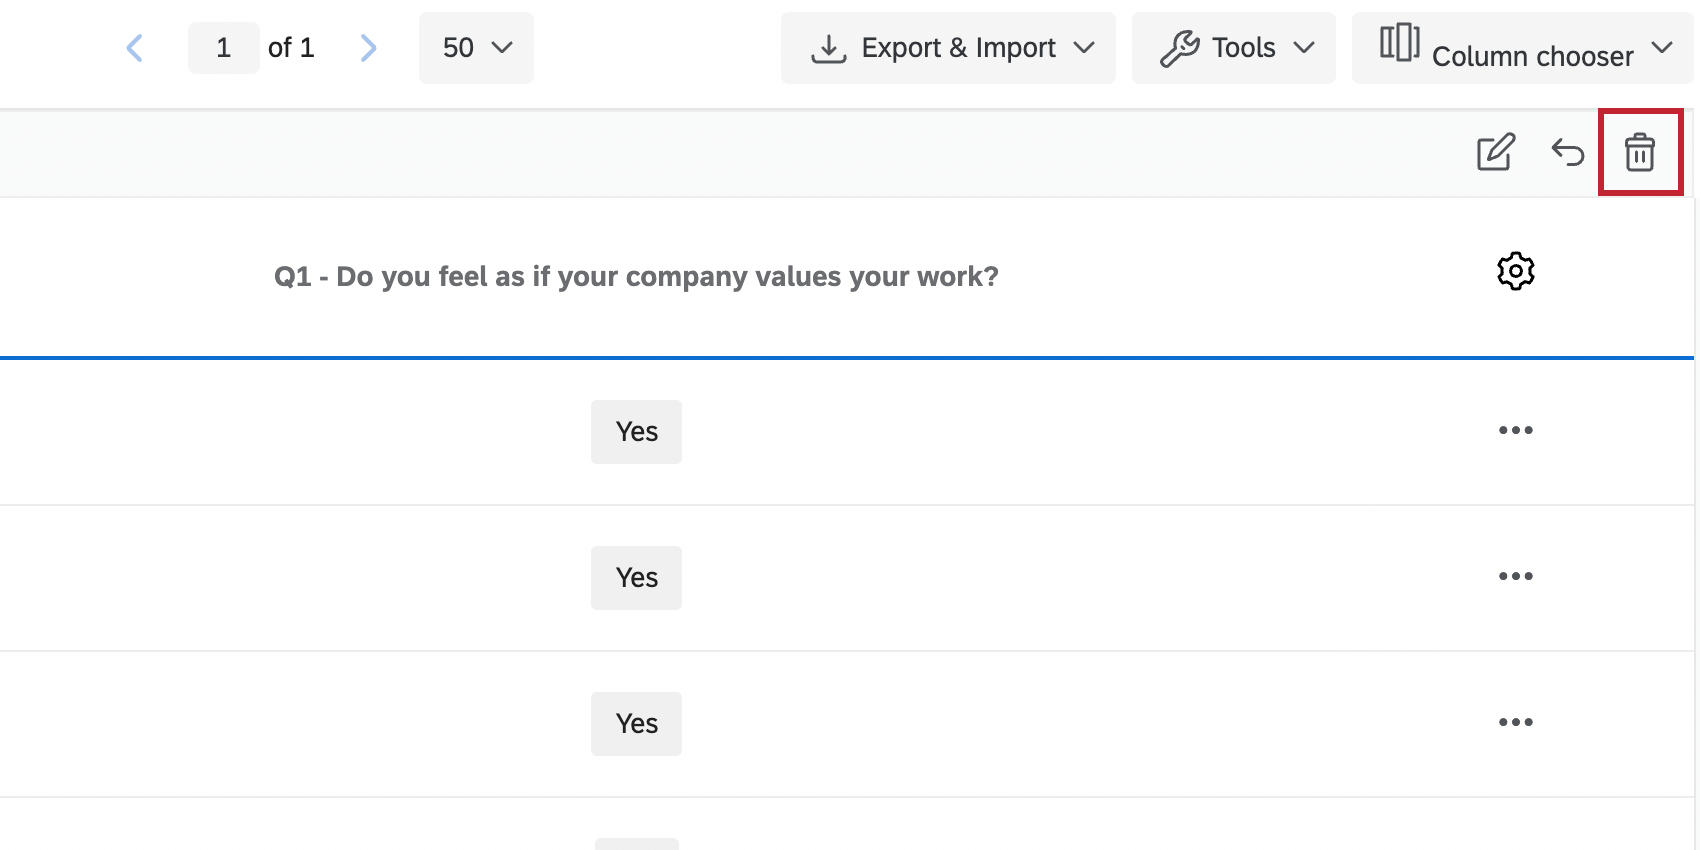
Deleting Responses
Deleting responses works very similarly in Employee Experience projects as it does in survey projects, with a few key differences.
Employee Experience does not have specialized preview or test survey functions that generate dummy data. So when you delete data by type, the only options are Imported Data and All Responses.
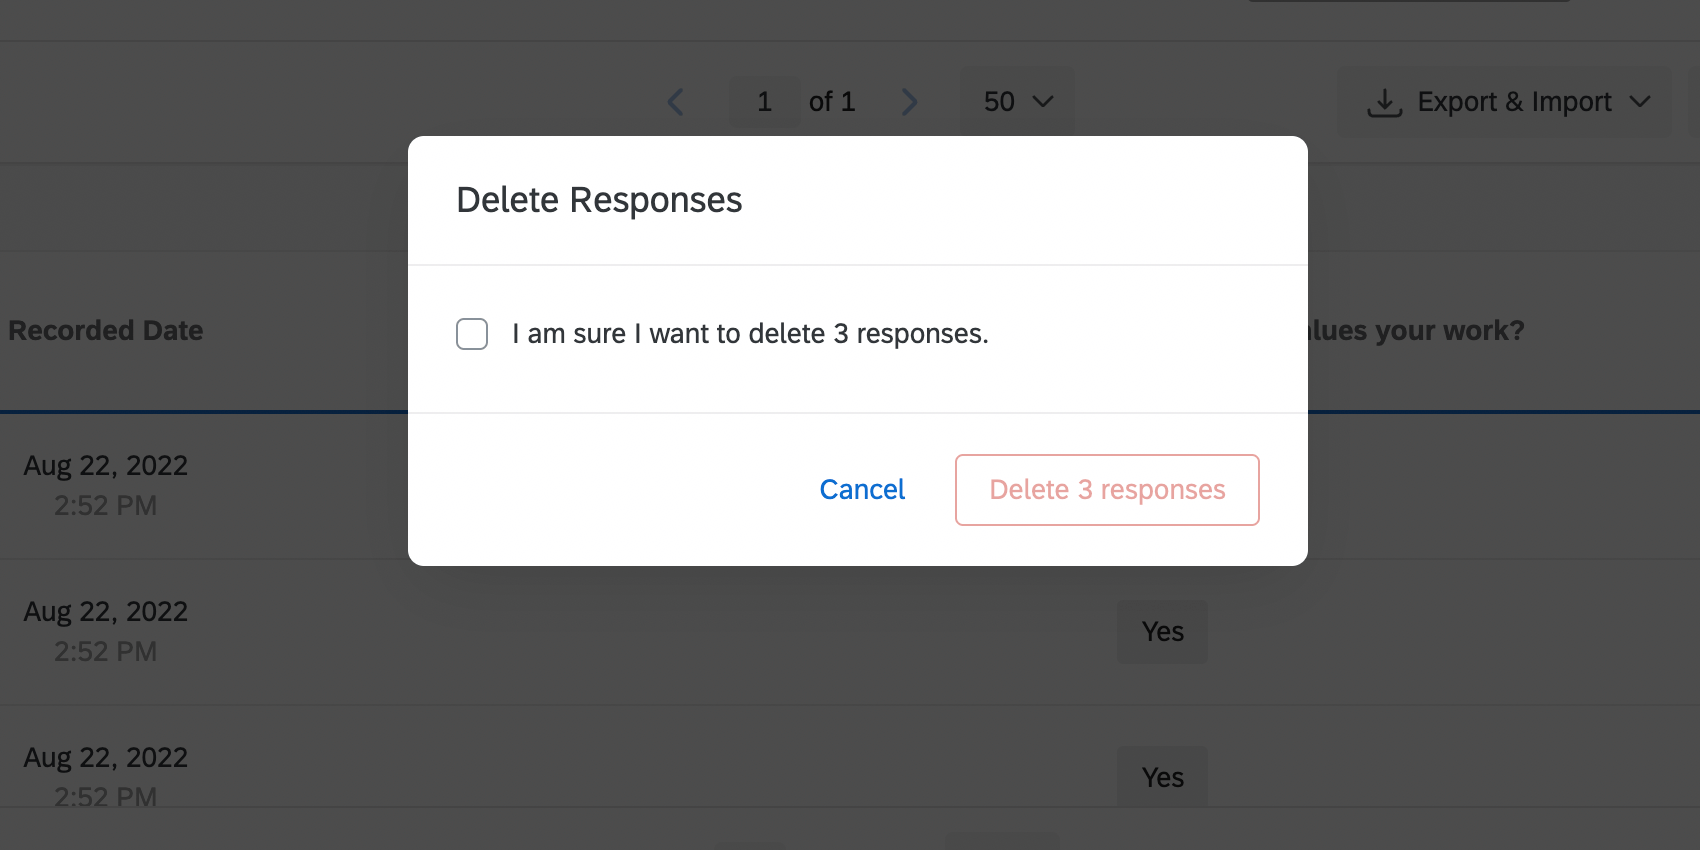
Also, because Employe Experience projects do not have a quotas feature, the only option offered on the final Delete Responses popup is to delete the data.
Translate Comments
Translate Comments makes analyzing participant feedback easier by allowing you to translate text responses. It is a feature only available to those with Advanced Text iQ, and it works the same way in standard Qualtrics surveys as it does in Employee Experience projects.
Editing Responses
Response editing is a feature that allows you to edit your data right inside the Data tab. It works very similarly in Employee Experience projects as it does in survey projects, with all changes being reflected in your dashboard data (both primary and any secondary sources).
However, note that you cannot directly edit metadata fields in your Employee Experience data. The only exception to this rule are Lifecycle projects, which do allow direct metadata edits in recorded responses.
Creating New Fields
In Qualtrics, you can create new fields that add information to responses after they’ve already been recorded. These fields can be mapped to dashboards and appear in Dashboard Data as Derived Data.
You can create three different types of variables: manual, bucketed, and formula. These variables work the same way in Employee Experience projects as they do in survey projects. See the linked pages for more information about each variable type. Also see the Editing Custom Variables page for information on how to edit custom variables.
Stats iQ for EX
Stats iQ can be used to perform powerful statistical analysis on your employee results. To get started using Stats iQ, click Stats iQ in the Data & Analysis tab. Please note that analyses done in Stats iQ cannot be mapped into dashboards.
Below is a list of pages to get you started using Stats iQ. While some of the use cases and examples may not be applicable to Engagement projects, the core functionality is the same.