-

Qualtrics Platform -

Customer Journey Optimizer -

XM Discover -

Qualtrics Social Connect
Analyzing Text iQ in Stats iQ
About Analyzing Text iQ in Stats iQ
Have you ever wanted to see how your open-ended responses correlate with more quantitative data? For example, are customers who address “ease of use” in their feedback also more likely to mention your mobile app? If customers tend to have a higher sentiment when they mention your support team, are they also more likely to give higher NPS ratings for your entire company? To answer these questions and more, Text iQ variables, such as topics and sentiments, can be analyzed with Stats iQ.
Text iQ Variables Compatible with Stats iQ
Stats iQ is compatible with the following Text iQ variables:
- Topics: Topics are the subjects mentioned in an open-ended response that you wish to analyze. Topics are a means of categorizing or tagging responses so you know what the respondent addressed in their feedback. When imported into Stats iQ, there will be a Topics variable for each topic created in Text iQ. This variable is a Checkbox variable type.
Qtip: Reduce survey fatigue: instead of asking about every aspect of your program, let respondents bring up the parts that matter most to them. By analyzing topics brought up by your respondents during feedback, you reduce the number of distinct questions you have to ask respondents.
- Parent Topics: Parent Topics act as a sort of umbrella over other topics. For example, your restaurant may have separate topics for each dish, and then nest all these topics under a “Menu” parent topic. When imported into Stats iQ, there will be a Parent Topics variable for each parent topic you’ve created. This variable is a Checkbox variable type.
Qtip: If you are using hierarchical topics, this field is no longer needed. Use Topic Hierarchy Level Fields instead.
- Topic Hierarchy Level Fields: If you are using hierarchical topics, there will be 5 fields corresponding to the topics at levels 1 through 5 (ex. Topic Hierarchy Level 3). Each field will contain a list of topics for that level. Each variable is a Checkbox variable type.
- Sentiment: This is how Positive, Negative, Neutral, or Mixed a response seems to be. The sentiment is available for each topic that appears in your response, as well as for the response overall. This variable is a Category variable type.
- Sentiment Score: This is a -2 to +2 score for the sentiment of a comment. For example, a very intense, positive response such as “I love Love LOVE YOUR COMPANY!” would score a +2. An intensely negative response, such as, “I UTTERLY DESPISE your company!” would get a -2. A 0 is a neutral score. This variable is a Number variable type.
Before you can bring these variables over into Stats iQ, they must exist! Make sure you open Text iQ and analyze your responses.
Analyzing Text iQ Variables
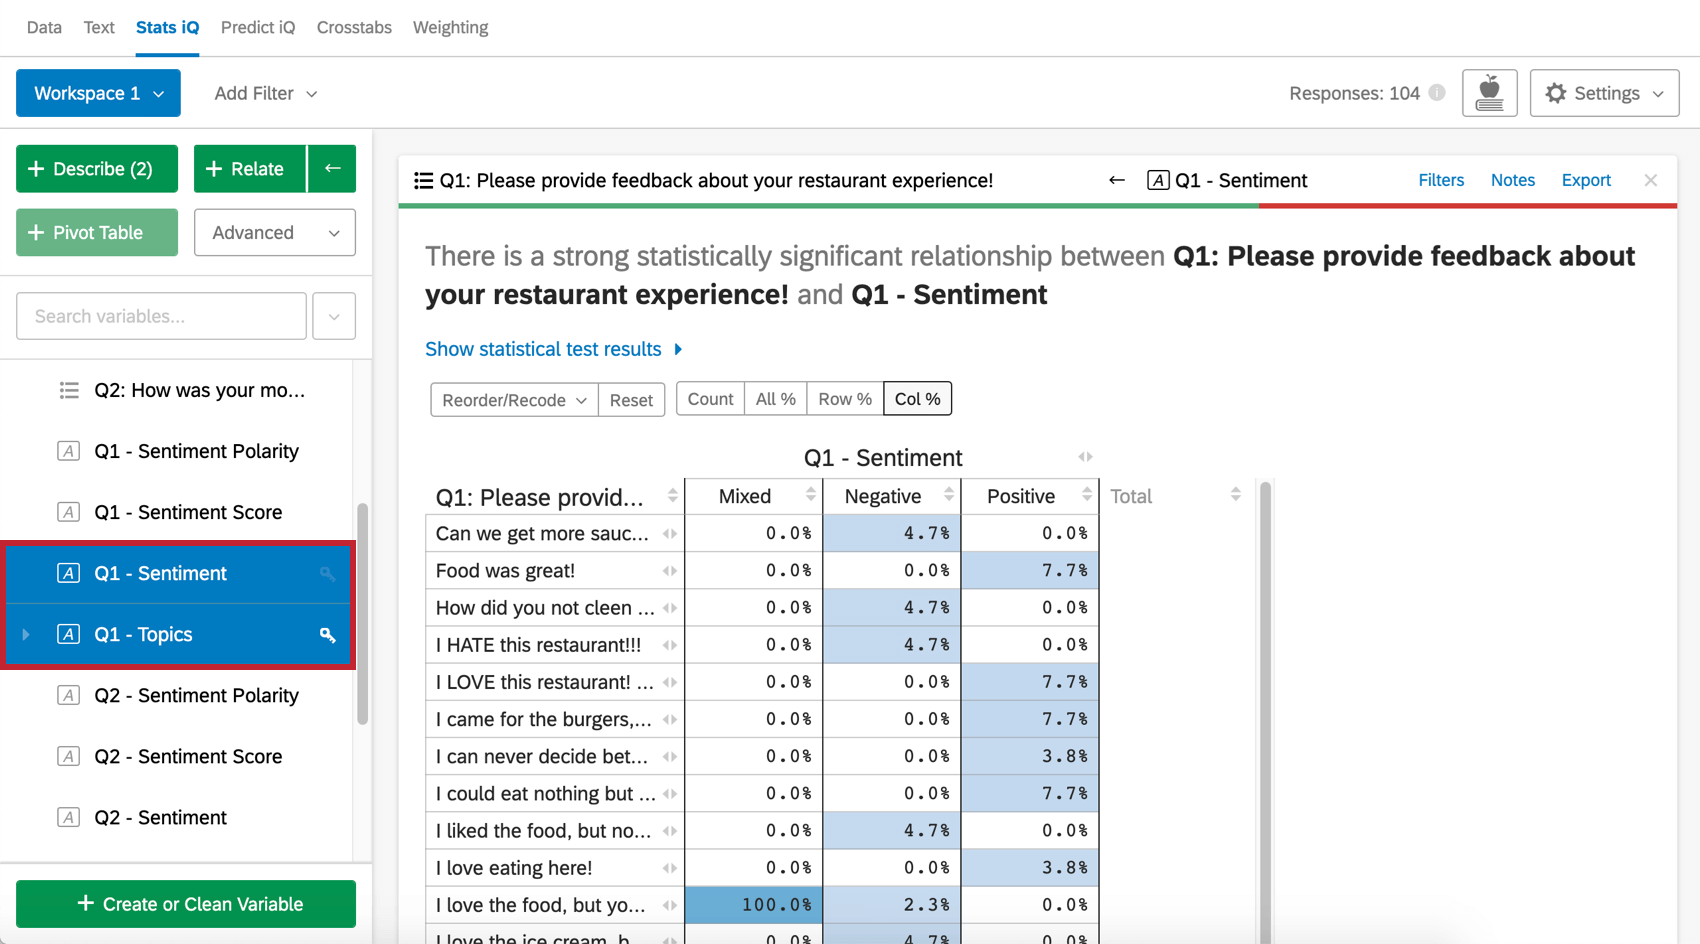
Once you’ve conducted your text analysis and made sure all new responses are loaded in Stats iQ, you can analyze your Text iQ variables just like all your other variables. Whether you choose to describe your text variables, relate them to other variables, perform regressions, or build pivot tables or clusters, text variables are as flexible as any other data point in your workspace.
Example Analyses
- Relate the topic to important output variables.
Example: People who mention the topic “customer support” tend to have lower overall satisfaction scores. This implies customer support has a pretty big impact on the overall company CSAT, and we should investigate what changes we can make in this area.
- Relate the topic to details about the respondent or interaction.
Example: People who mention the topic “enterprise software” tend to be younger and more affluent, as shown by this topic’s high correlation with certain age and income demographic variables.Example: People who shopped at the store in Seattle frequently mention “low quality,” but the people who shopped at the Dallas location don’t. This implies the Seattle store has changes to make that the Dallas store doesn’t.
- Relate a topic to Time. Is the mention of a topic becoming more prevalent over time?
- Relate a topic to other topics.
Example: If the topic “wait time” is associated with the topic “drive-through,” you’d probably take a different action to fix the problem then if “wait time” were associated with topic “in-store eating”.