
Step 2: Mapping a Dashboard Data Source (CX)
What's on this page
What’s a Dataset, and Why Do I Need To Edit It?
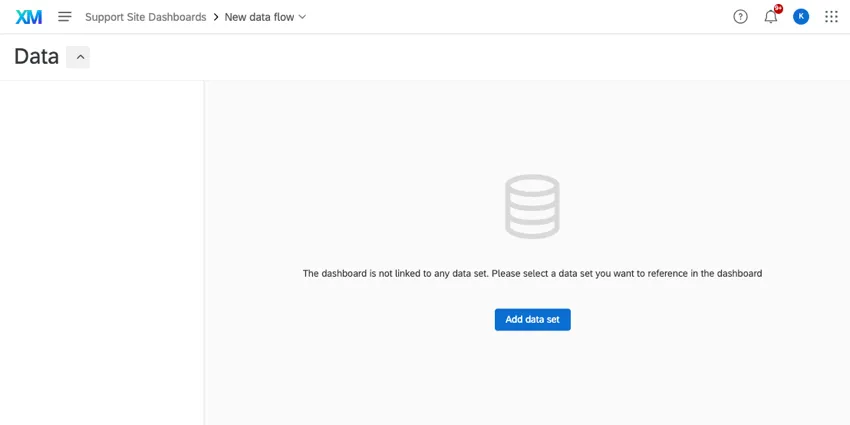
Now that we’re inside the Dashboard Data tab, it’s time to talk about datasets. A dataset is just the data you want to report on in your dashboard. Datasets are collections of all of your data sources, such as the data you collected in surveys or data you have imported. Data sources are required in order to populate your widgets with data.
Qtip: We highly recommend using the data mapper to create your very first dashboard dataset.
When you add your first dataset, many fields will be mapped automatically, and you can technically work with these default settings. But understanding datasets can also help you make edits that will enable the kinds of widgets you want to customize your dashboard with.

Qtip: When mapping dashboard data, make sure to only include data that is essential for end-user success. If you are restricting access to many fields, we recommend creating a separate dashboard(s) for just the users who should have access.
Below are a couple of common examples of changes you can make in Dashboard Data.
Example: When you add a survey data source for the first time, all your fields will be named something like “Q1 – Overall, how satisfied are you with the products our company makes?” when it would probably be faster to just call this field “Product Satisfaction,” so it shows up nicely on graphs.
Example: When you have a CSAT question in a survey, your dashboard may think of this as categorical data, and only offer widgets optimized for categorical data. In contrast, you would probably prefer to look at a satisfaction rating as a numerical scale, so it can be pulled into widgets that work better with numeric scale data. You can do this by changing the field type to Number Set.
In the next section, we’ll break down fields so it’s easier to understand the kind of edits you can make to them.
Understanding Fields
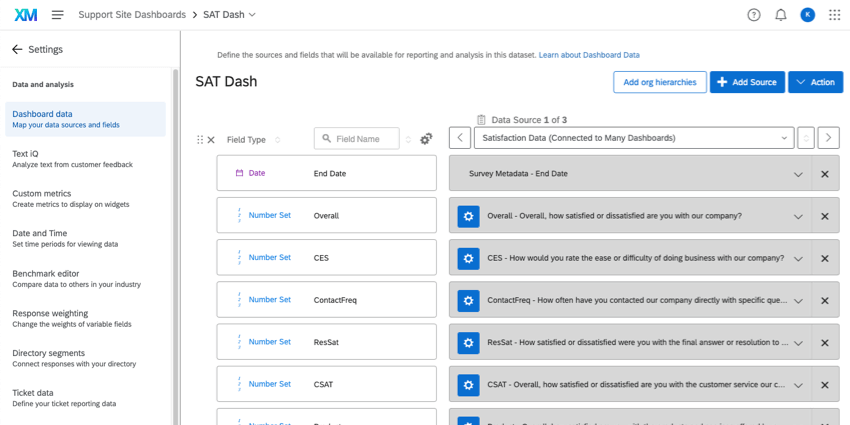
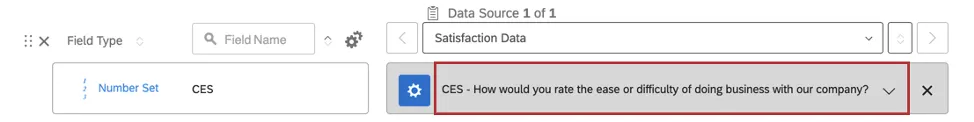
In this section, we’ll break down the parts of a dashboard field, highlighted in the screenshot above.
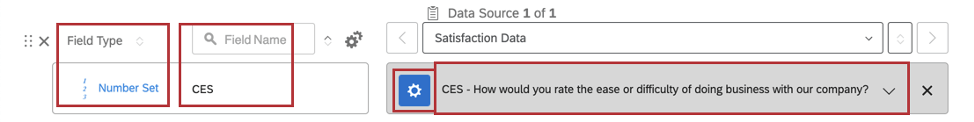
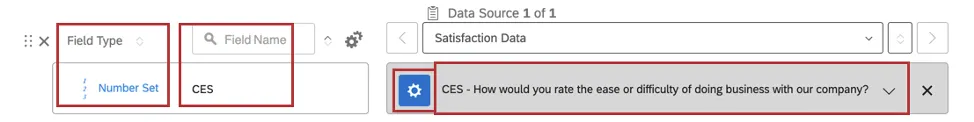
Field Type
This is one of the most important aspects of a field that you need to pay attention to. A field type is the format your data takes. Is your data number or text format? Are the values infinite (like a first name field) or finite (like a scale that only goes from 1-6)? The field type you choose changes the widgets that are available to you.
Here’s a quick overview of the different field types:
- Number Fields
- Numeric Value: A number field that has a very large or infinite set of values (e.g., any number between 0 and infinity).
- Number Set: A number field that has a finite set of values (e.g., the set of numbers from 0 to 5). Typically used with scales, such as the Likert 1-5-point scale.
- Date: Customized calendar date fields. Qtip: You can collect date data in any format you want – you just have to tell your dashboard how to read it. For more information, see Date Field Format.

- Text Fields
- Text Value: A one-to-two-word text field that has a very large or infinite set of values. Used for open-ended form questions such as asking for names or email addresses.
- Text Set: A one-to-two-word text field that has a finite set of values. For example, instead of using a scale from 1-5 in a Number Set field type, mapping the labels “Dissatisfied” to “Satisfied” to Text Set widgets.
- Multi-Answer Text Set: Multiple select questions that ask respondents to check all items that are applicable to them.
- Open Text: Longer blocks or strings of text, such as a request for open-ended feedback.
For a guide to changing field types and a table showing the widgets compatible with each field type, see Field Types & Widget Compatibility (CX).
Field Name
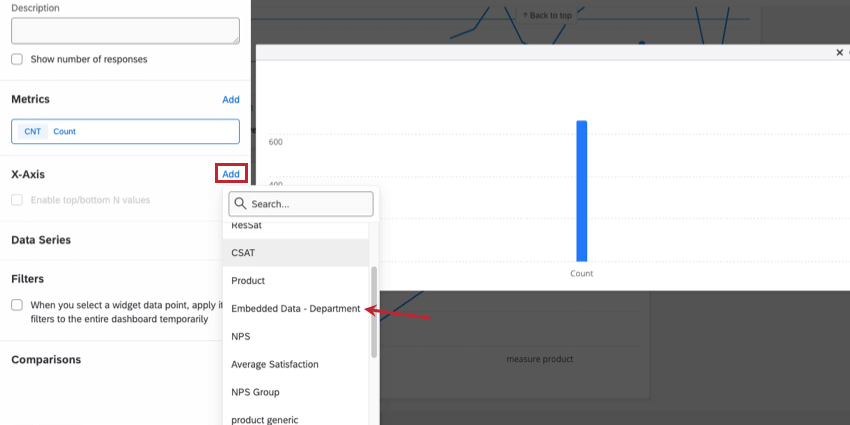
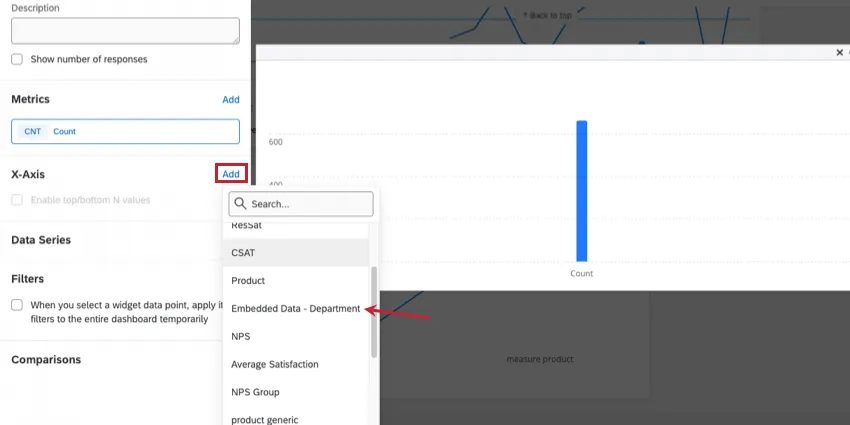
The name of the field. These field names can be pretty long by default, explaining both their source and the full text of the field name. For example, “Embedded Data – Department” instead of just “Department.” The field name you configure in this mapper decides the field name you see when choosing a field to map in your widget, so it can make the widget-editing process easier if you shorten these.
Recoding Values
Every field comes with values. If a satisfaction question is the field, the values may be:
- Very Satisfied
- Somewhat Satisfied
- Neither Satisfied nor Unsatisfied
- Somewhat Unsatisfied
- Very Unsatisfied
Or, if in a number format, this same scale may be:
- 5
- 4
- 3
- 2
- 1
But what happens if you want to switch from the text of the satisfaction scale to the numbers? Well, first, you change your field type. But secondly, you can recode the values.
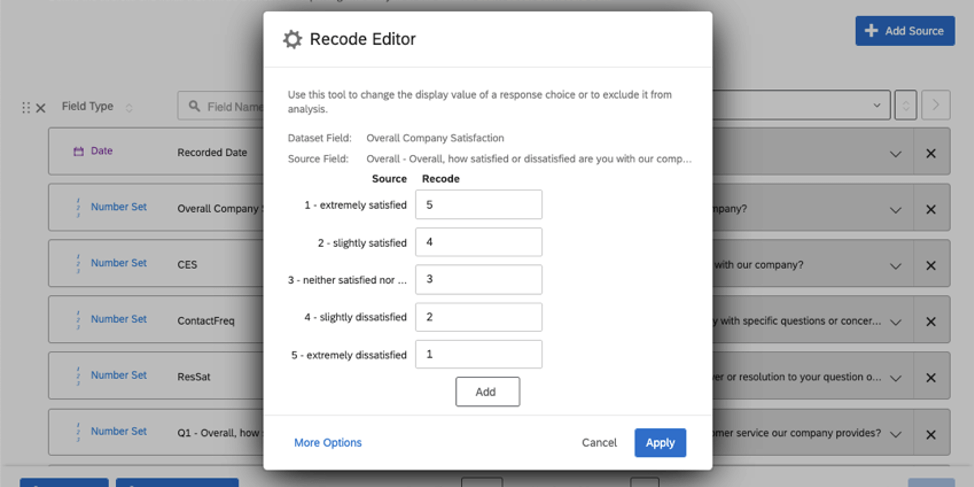

The recode editor gives you the freedom to assign numeric values to labels and assign labels to numeric values. But that’s not all this editor is useful – you can also use it to group values, exclude values from analysis, edit the names of text values, and more!
See Recoding Dashboard Fields (CX) for more details.
Mapping a Field
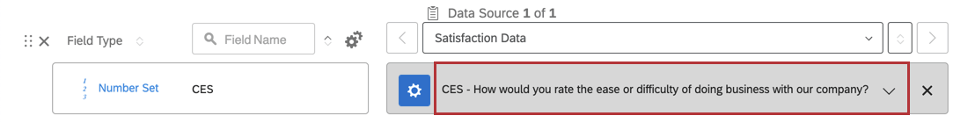
To map a field is to specify where in your data source the field should draw its data from. When you add your first source, several fields are mapped automatically, so you don’t need to worry about this step. However, if you add a new field, you will need to map it manually. This is as simple as clicking the dropdown and selecting from the list of fields.
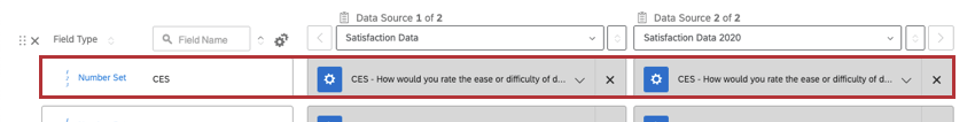
Mapping is a fairly straightforward concept that is especially important when you work with multiple data sources. For example, if you run separate (but similarly written) CSAT surveys every year, you may want to merge fields, which means you make sure that for each data source you have, the same dashboard field is mapped. So your CSAT score for the 2020 and 2019 surveys both contribute to one CSAT field in your dashboard. See Managing Multiple Sources for more details.

The Effect of Data Edits on Live Dashboards

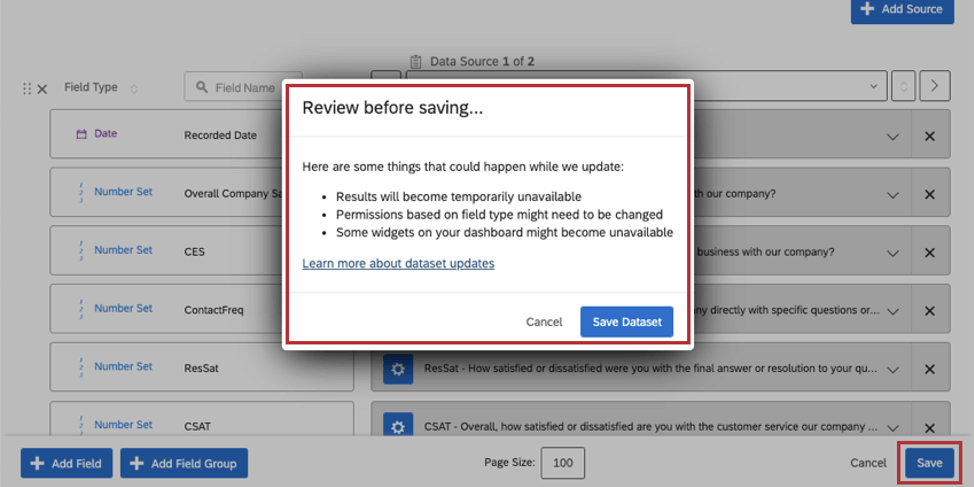
It’s important to clean up your data sources before you start to customize your dashboard widgets, and it’s even more important to do this before your dashboard goes live. However, you may not be able to help making data source updates after your dashboard is live.
Your dashboard will still be available and fully functional when you make changes. However, viewers may not be able to see the most up-to-date data until the dashboard finishes reindexing. To learn more about this, see Saving Dashboard Data Edits.
Qtip: Be strategic about the time of day you edit your dataset – think about your primary audience, and when they’re less likely to be online.
FAQs
How can I stay up to date on new Qualtrics features?
How can I stay up to date on new Qualtrics features?
To access these release notes, you need an XM Community account. These accounts are free for any users with a Qualtrics account. This support page contains information for how to register an XM Community account.
Once you're logged into the XM Community, head over to the Weekly Product Updates Introduction Post. This post contains all the information you need to get started with subscribing to product updates!
What are CX Dashboards?
What are CX Dashboards?
Can Dashboards projects only be used for customer experience research?
Can Dashboards projects only be used for customer experience research?
That's great! Thank you for your feedback!
Thank you for your feedback!