-

Qualtrics Platform -

Customer Journey Optimizer -

XM Discover -

Qualtrics Social Connect
Rolling Calculations in Widget Metrics
About Rolling Calculations
Rolling calculations are a means of applying a metric over a set of data points composed of multiple periods. Options include rolling averages and rolling metrics.
Rolling averages take a series of points, where those points can be the result of any sort of metric calculation, and averages them across a window of a specified size.
Rolling metrics apply a chosen metric using all the data points within a specified window size. As opposed to rolling averages, it uses all the data to produce a new calculated metric.
You can add rolling averages and rolling metrics to dashboard widgets. However, first you should make sure the widget you’re using is compatible and that the data displayed is broken out by date.
Widget Compatibility
Rolling calculations can be added to any widget that allows you to add metrics, in addition to a dimension, row, or axis where the data can be broken out by date.
This includes:
Date filters applied to the dashboard page will affect rolling calculations.
Rolling calculations are compatible with weighting.
Rolling calculations cannot be used with significance testing.
Adding a Date Breakout
Below is an example of a date breakout being added to a vertical bar widget.
- Click to edit your widget.
- On the widget editing pane, click Add in the X-Axis section.
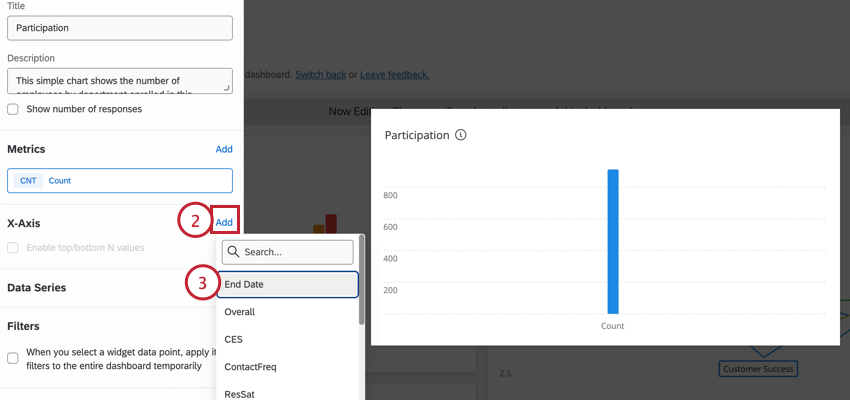
- Choose a Date field.
Qtip: You can check a field’s field type in dashboard data section of the dashboard.
- Click the x-axis field.
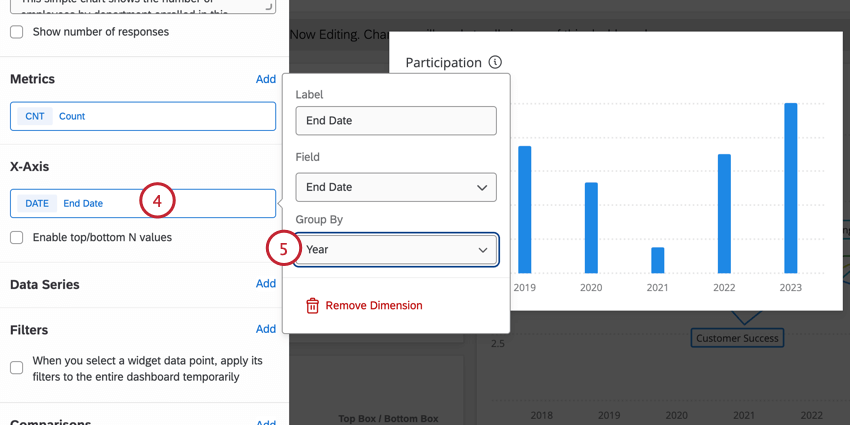
- Choose the timeframe your data’s grouped by. You can go by year, quarter, month, week, day, or automatic.
Adding a Rolling Average or Rolling Metric to a Widget
- Use one of the compatible widgets and break the data out by date, as explained in the sections above.
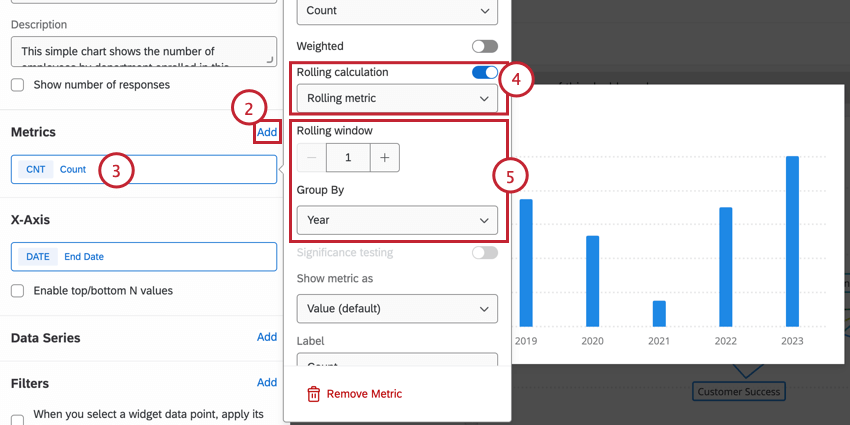
- Make sure you have at least one metric. If you have not added one yet, click Add in the Metric section.
 Qtip: You can choose any metric you want, such as NPS or Average. The rolling calculation applied will be calculated based on this metric. However, rolling calculations are not compatible with custom metrics.
 - Click the metric you added.
- Enable Rolling calculation and then use the dropdown to choose your calculation, either Rolling average or Rolling metric.
- Select the period of time you want the rolling calculations over. You can type any value and choose between year, quarter, month, week, day, or automatic, if that’s what you set your date breakout to.
How Rolling Averages are Calculated
The rolling average takes “the average of averages”. It will take each metric value (which themselves are the average of each respondent’s answers) within a specified window, and average them over the number of windows. This means the resulting average is independent of sample size for any given period.
Rolling average is implemented on top of metrics that are allowed over Scalar Values (Numeric Values). The algorithm essentially implements this following set of equations. For Window Size `w`:
![]()


Behavior for Current Data
The default behavior includes the current data point for the window, and uses the current value in the bucket for every data point.
Example: Let’s assume that we have a set of data points for a metric (count, sum, average, etc.). Then let’s say we use ‘average’ for this example, with window size ‘2’.
| Date | 1/1/2018 | 2/1/2018 | 3/1/2018 | 4/1/2018 | 5/1/2018 | 6/1/2018 |
| Original Metric Calculated | 10 | 6 | 11 | 2 | 9 | 14 |
| Rolling Average | (10) / 2
= 5
|
(10 + 6) / 2
= 8 |
(6 + 11) / 2
= 8.5 |
(11 + 2) / 2
= 6.5 |
(2 + 9) / 2
= 5.5 |
(9 + 14) / 2
= 11.5 |
- The last data point is considered as incomplete and will contribute to the rolling average computations when we have a data point for 7/1/2018.
Rolling Average Behavior for sparse data
The data represented above is a defined behavior as per the equations mentioned in the graph. But in a real world scenario, the data is usually sparse. These cases are called the ‘missing data points’ or ‘null case’. In this case, only average over the window elements exist. If the elements in the window are missing, then Rolling Averages won’t use the previous data points to fill in the window.
Example:
| Date | 1/1/2018 | 2/1/2018 | 3/1/2018 | 4/1/2018 | 5/1/2018 | 6/1/2018 |
| Original Metric Calculated | 10 | MISSING | 11 | MISSING | MISSING | 14 |
| Rolling Average | (10) / 2 = 5 |
(10 + Null) / 1 = 10 |
(NULL + 11) / 1 = 11 |
(11 + NULL) / 1 = 11 |
(NULL + NULL) = NULL |
(NULL + 14) / 1 = 14 |
How Rolling Metrics are calculated
Rolling metrics work in the same way that normal metrics work, except the data used can be expanded past one period, on a rolling basis. The default behavior includes the current data point for the window which uses the current value in the bucket for every data point.
Rolling metrics can be thought of as a “weighted rolling metric.” In this case, “weighted” means that your metric value controls for base size in each time period in the window, applying more weight to high base size time periods, and less weight to low base size time periods.
Example: Let’s assume that we have a set of data points for a metric (count, sum, average, etc.). Then let’s say we use ‘average’ for this example, with window size ‘2’.
| Date | 1/1/2018 | 2/1/2018 | 3/1/2018 | 4/1/2018 | 5/1/2018 | 6/1/2018 |
| Original number of data points | 12 | 17 | 20 | 10 | 15 | 25 |
| Sum of values | 36 | 52 | 78 | 62 | 55 | 89 |
| Rolling Metric | 36 / 12 = 3 | (36 + 52) / (12 + 17) = 3.03 | (52 + 78) / (17 + 20) = 3.51 | (78 + 62) / (20 + 10) = 4.67 | (62 + 55) / (10 + 15) = 4.68 | (55 + 89) / (15 + 25) = 3.6 |
- Each following data point gets the average of the sums using the number of data points within the window size of two.
Rolling Metric BEHAVIOR FOR SPARSE DATA
The data represented above is a defined behavior as per the equations mentioned in the graph. But in a real world scenario, the data is usually sparse. These cases are called the ‘missing data points’ or ‘null case’. In this case, the metric is still calculated using the number of data points available within that window.