
A/B Testing in Website / App Insights
What's on this page
Qtip: If you don’t have access to any of the features described on this page, reach out to your Account Executive. For more information about the differences between Digital Feedback and CustomerXM for Digital, see Digital Feedback vs. CustomerXM for Digital.
About A/B Testing in Website / App Insights
A/B Testing is a classic research format used across disciplines. In this testing method, you compare a control condition to one where a treatment is applied, so you can then analyze if there is a significant difference between the respondents’ behavior in the treatment vs. the control baseline. A/B Testing can be useful in web development because it allows you to compare 2 versions of a design or advertisement in order to determine which is preferred by your customers.
On this page, we’ll explain how to test 2 different versions of the same Website / App Insights creative to randomized subsets of site visitors, to see which performs better.
Qtip: This page is not about testing an intercept on your website before it goes live. For that guide, see Test Intercept Section.
Qtip: If you’re interested in running A/B testing for research purposes unrelated to web development purposes, see A/B Testing in Surveys.
Establishing the Creatives Being Tested
Creatives are the visual element of a Website / App Insights project. The first step in A/B testing creatives is, of course, to make the creatives you want to test.
Whether you are trying out different ads, banners, or embedded content, you can A/B test just about any creative. To help you get started, here’s a list of all the creatives you can make in Qualtrics:
- Responsive Dialog
- Feedback Button
- Templated Embedded Feedback
- Pop Over
- Info Bar
- Embedded Link
- Slider
- Pop Under
- Custom Embedded Feedback
Qtip: Make sure you make a separate creative for each version you want to test. For example, if you want to test whether your new ad gets more clicks when it’s in black and white vs. color, you would need to make 2 creatives.
Qtip: You will generally be testing 2 or more of the same type of creative. But there are no absolute rules – for example, you may be trying to gauge whether a banner or a dialog that pops over the screen gets more traction with site visitors.
Qtip: The creatives and intercepts you create for A/B testing should be located inside the same project.
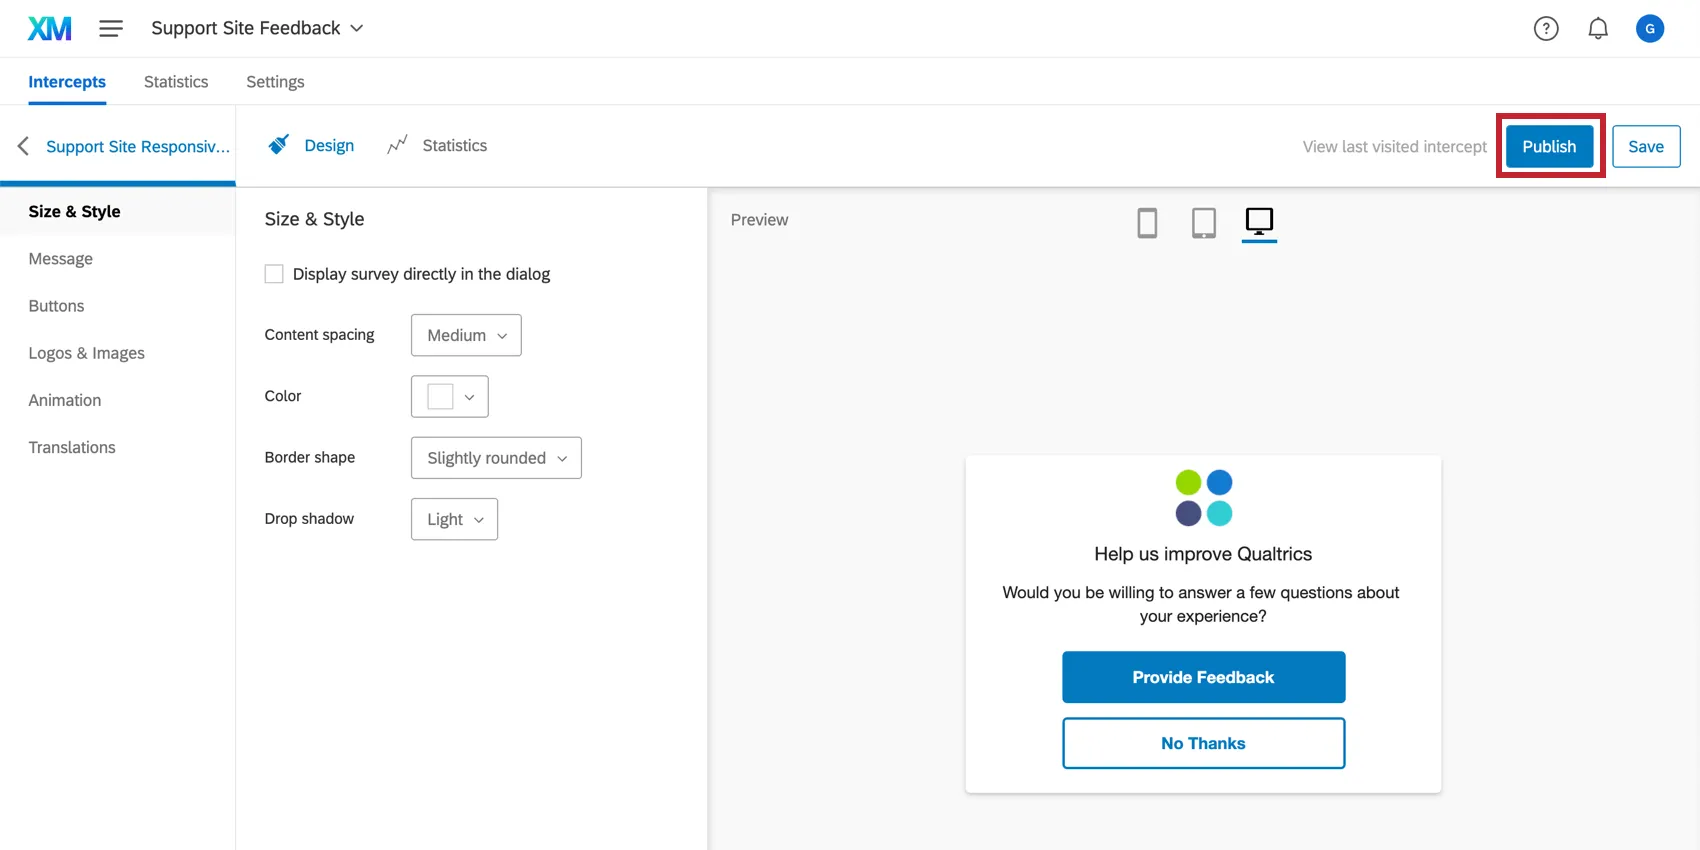
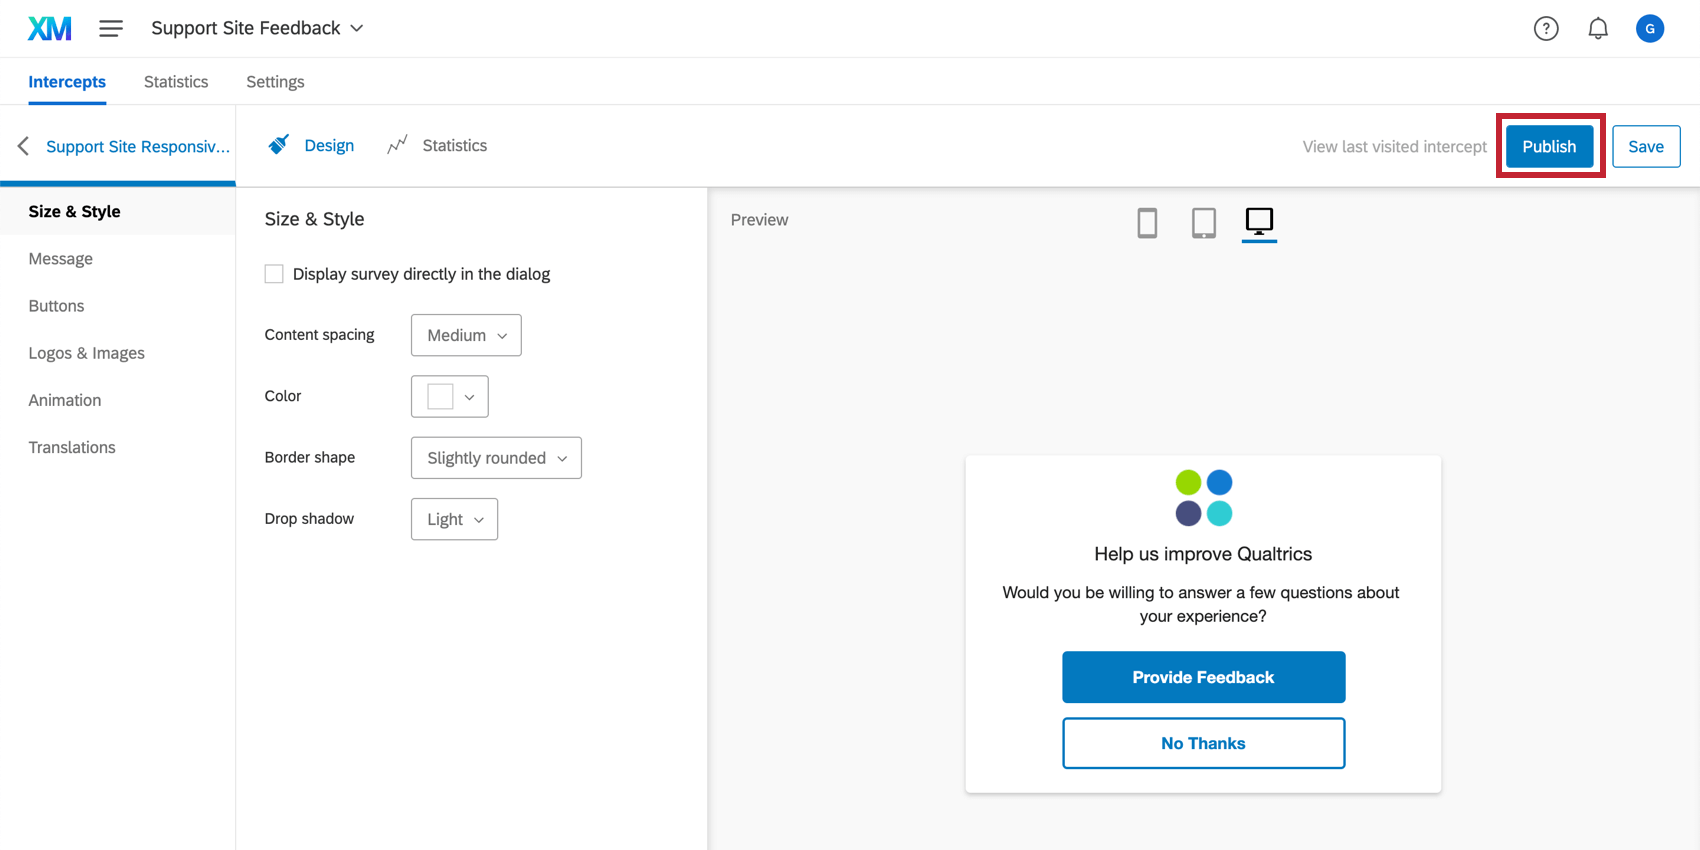
Publishing Creatives
Once you’re finished, make sure you publish your creatives so that they are pushed to the live code. Only changes that are published will display on your website once you have the code placed on your website.
If you are editing a creative, have the code deployed to your website, and do not want to push your edits live to website visitors, click Save instead.
Setting Up Intercepts
Once the creatives are made, it’s time to move onto the intercepts. Intercepts are the rules governing when and how your creatives are displayed on your website.
Every intercept is made up of at least 1 action set. An action set determines what happens on your website when certain conditions are met. When you set up multiple action sets, you can start to do more complex things, like present a completely different creative to different sets of website visitors.
Qtip: For users on the old flow, see these steps. For users on the new flow, see these steps.
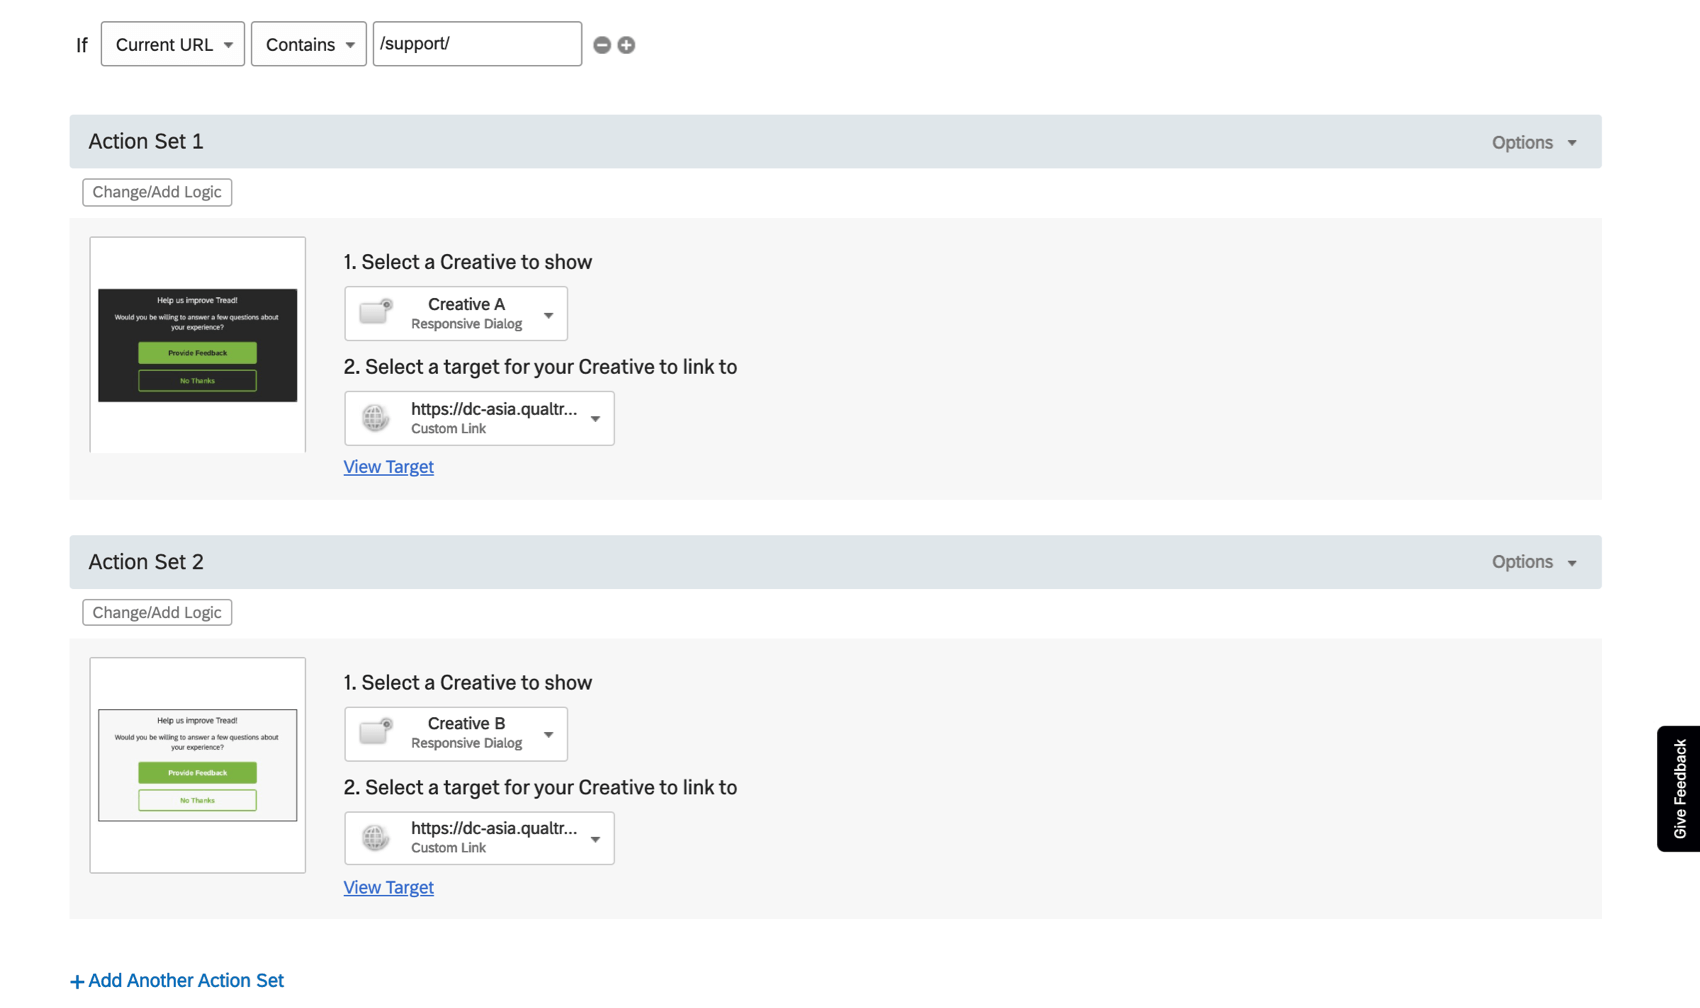
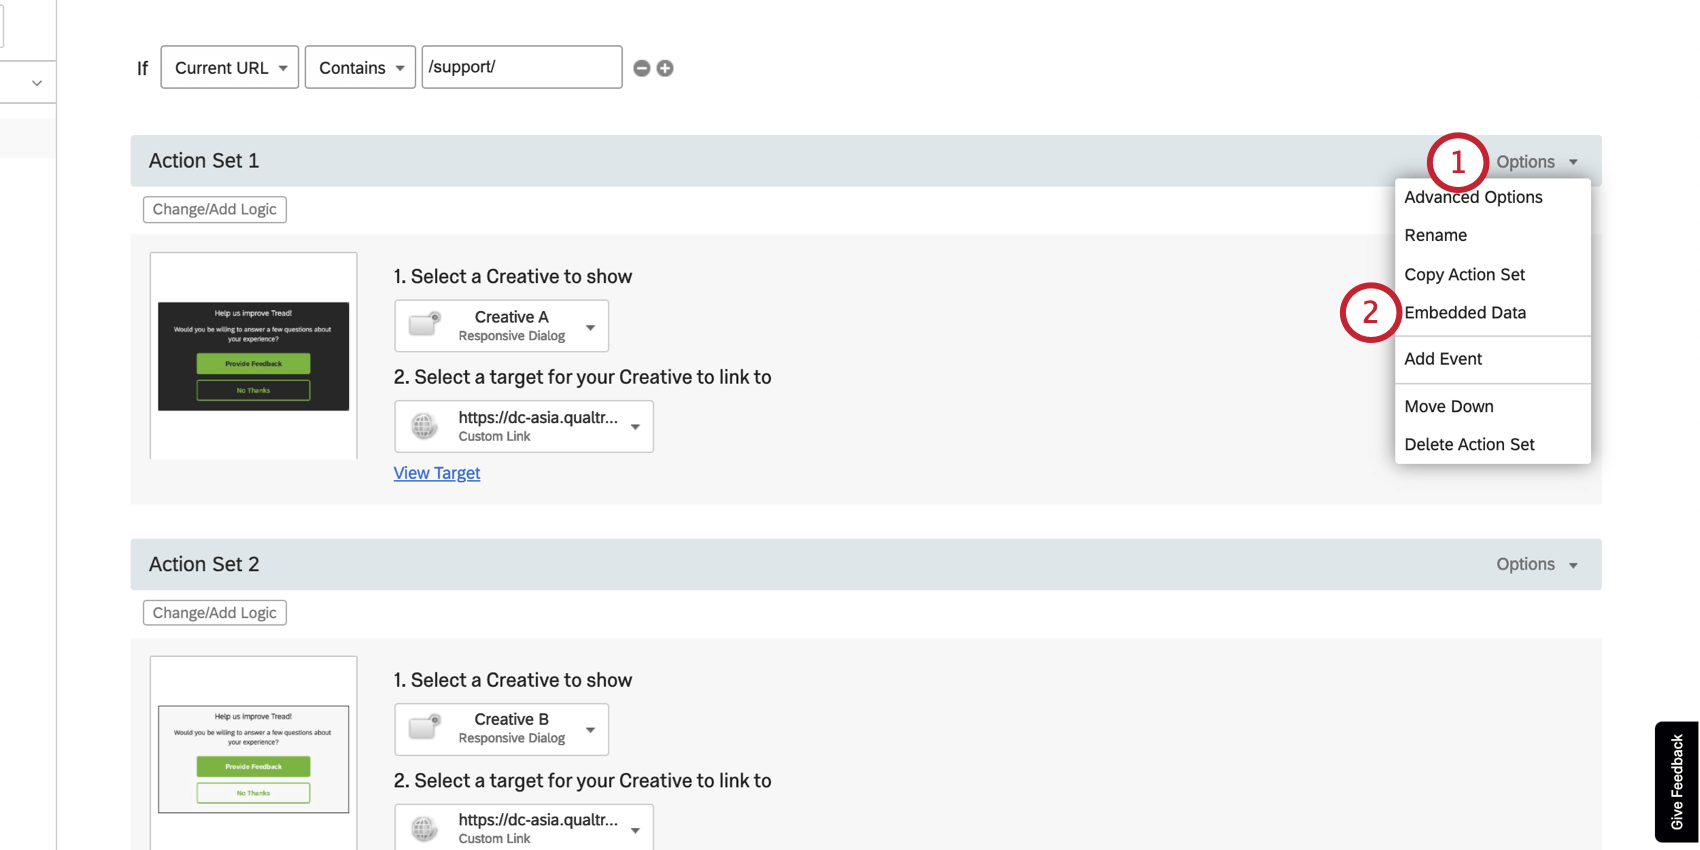
Example: Regardless of which randomized subset sees my banner, I only want it to appear on my support pages. I specify that the URL has to contain “/support/” in the intercept logic.
Embedded Data
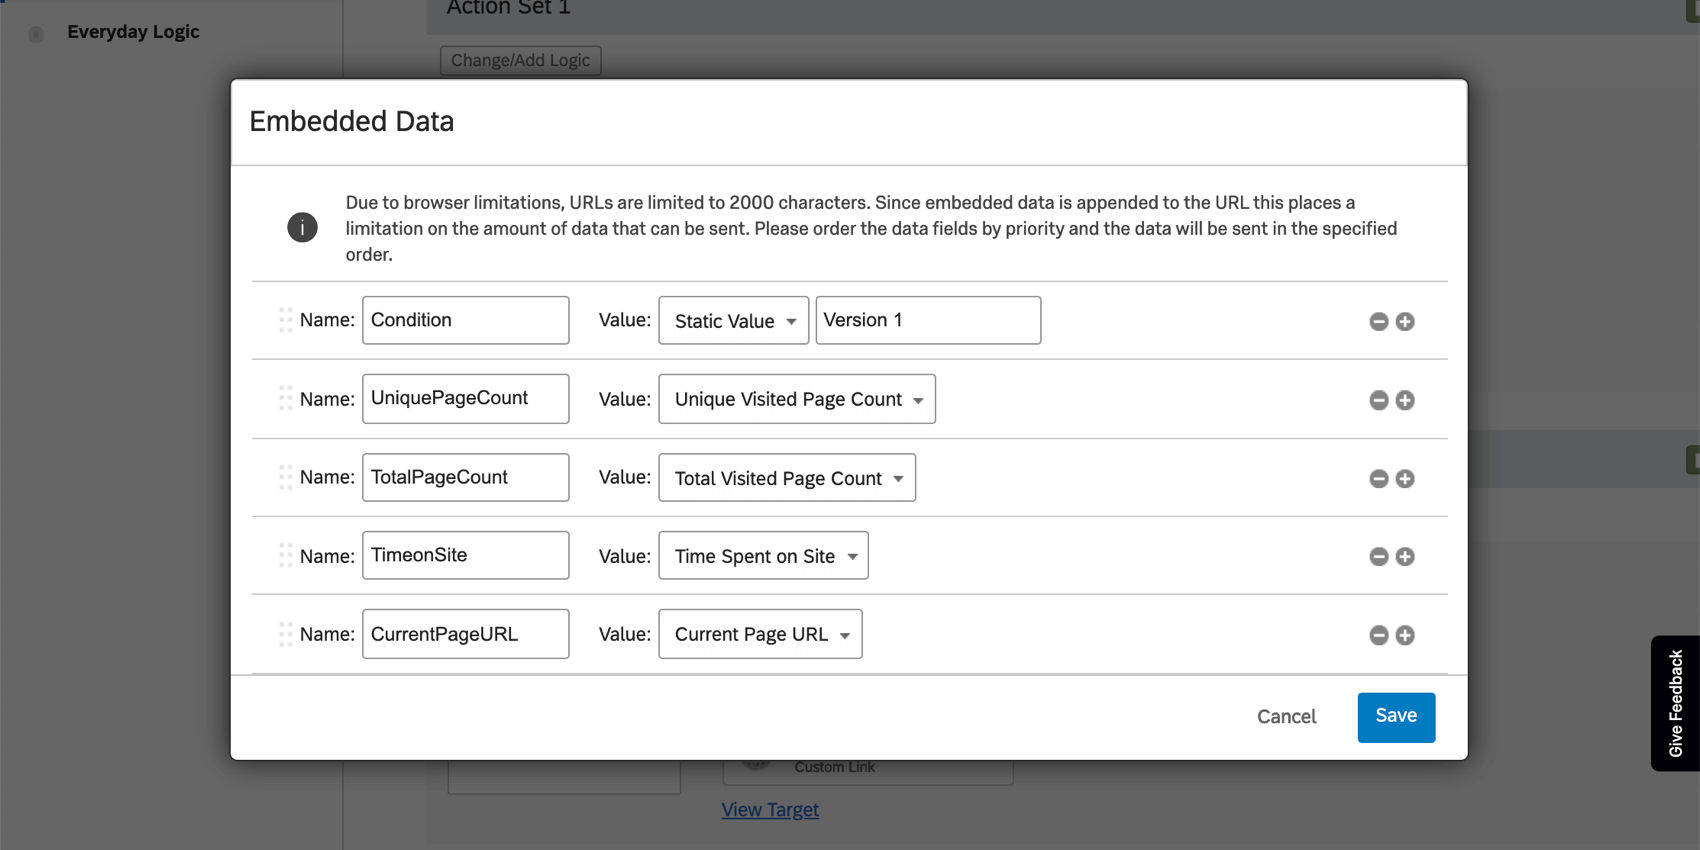
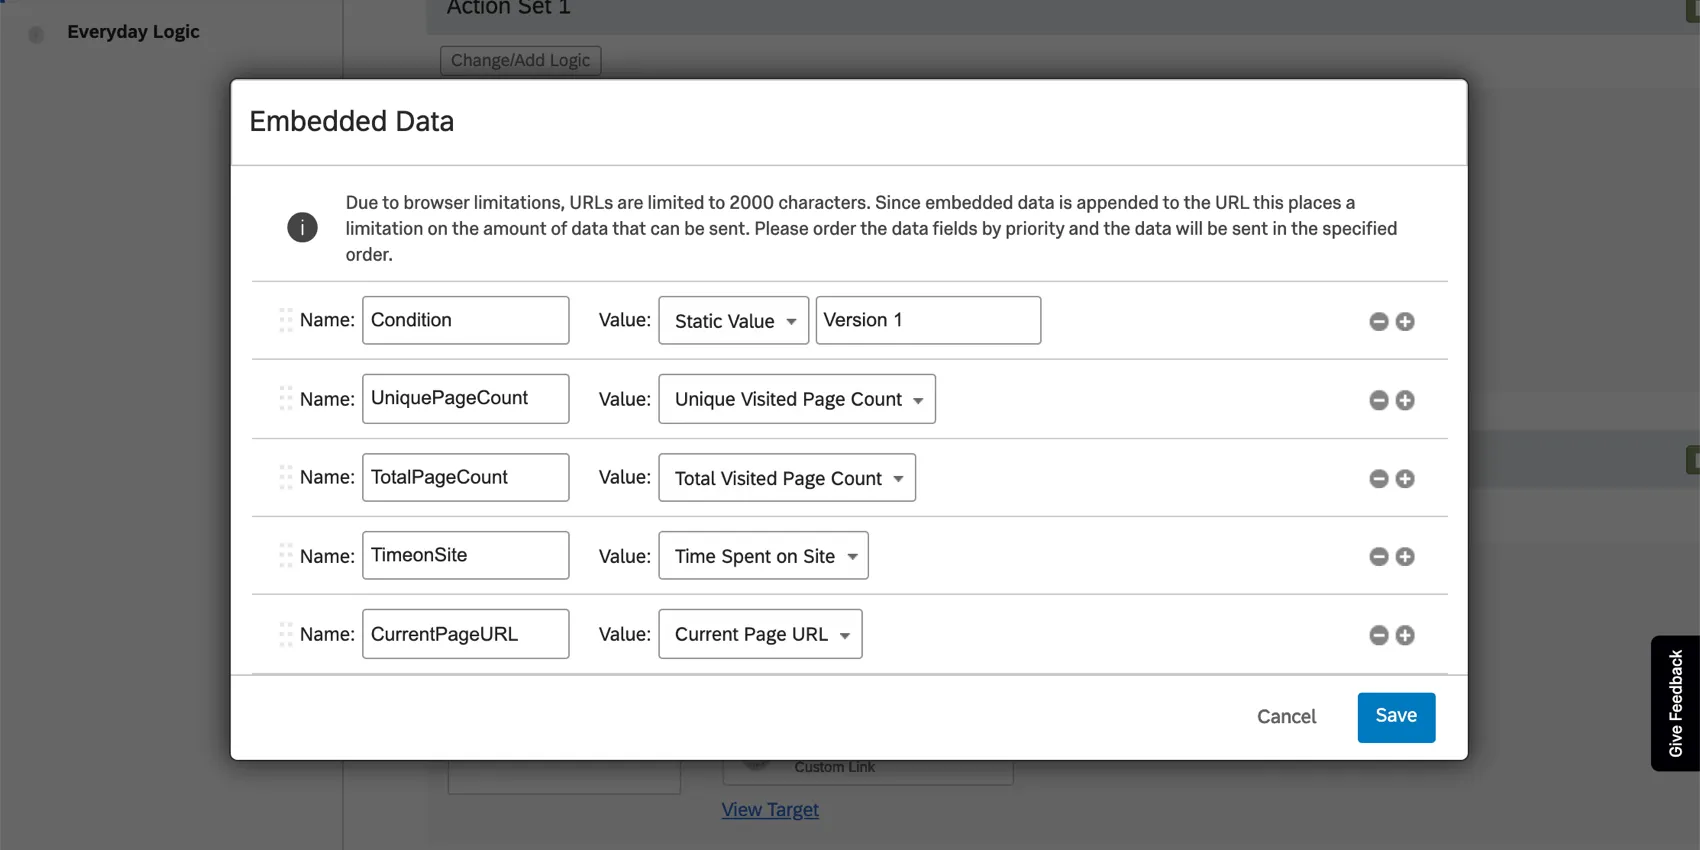
This step is optional, but can change how dynamically you can report on the results of your A/B test. If you want to pass certain information over to your website, use CX Dashboards, or set up advanced reports in a target survey, you’ll want to add embedded data to your intercept.
Embedded data are custom variables that can be named and set equal to any values you desire. For the purpose of A/B testing, that means you can track information related to which treatment / version of a creative your website visitor was exposed to.
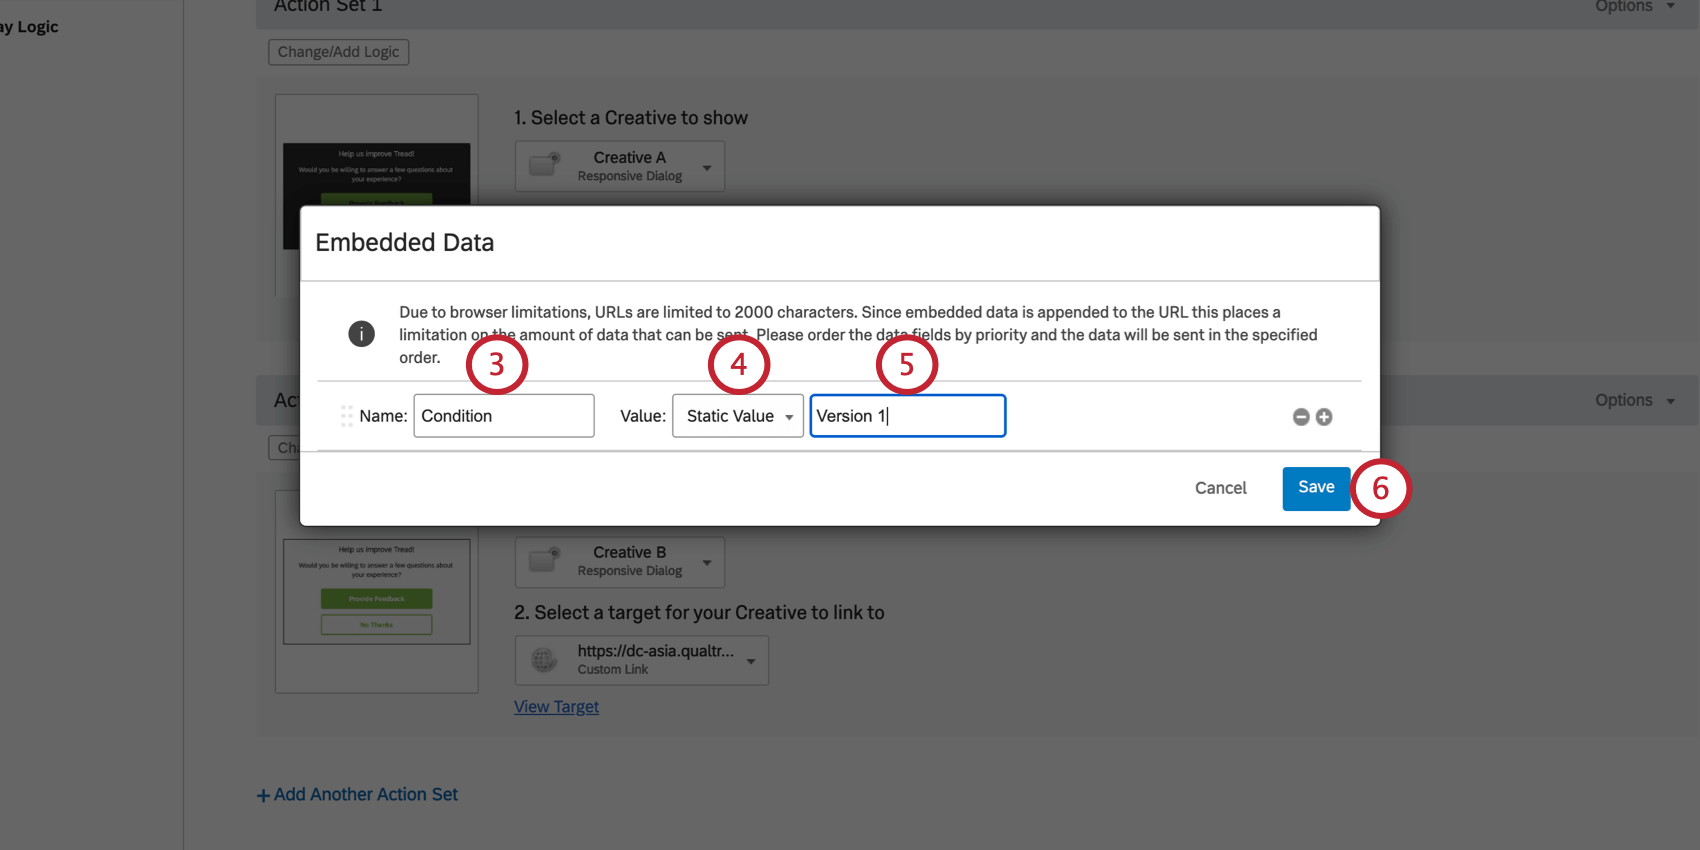
Qtip: You can just number your conditions, or you can choose more descriptive names. Whatever you think will benefit you most when reporting this data.
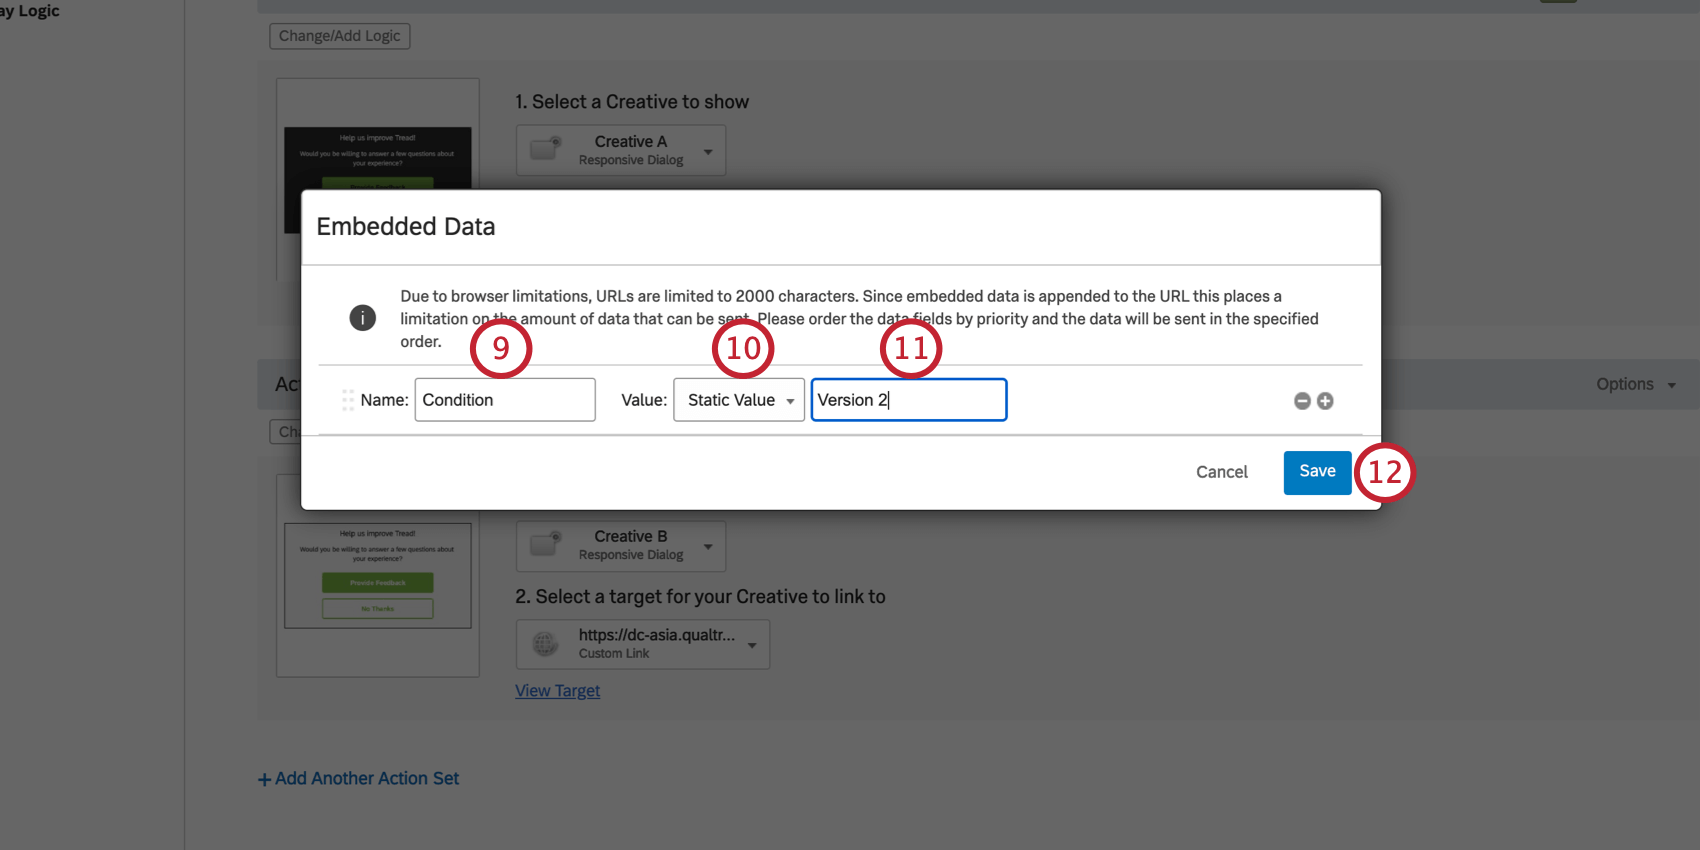
Example: If your other action set is “Version 1,” this action set could be “Version 2.”
Once your different conditions are marked, you can create additional embedded data that will help you build robust reports on the performance of your creatives. For example, you can capture how long the visitor spent on the site, how many pages they visited, the URL they were on when they saw the creative, and so, so much more. Check out the Embedded Data Value Types section of the Embedded Data in Website / App Insights for your options.
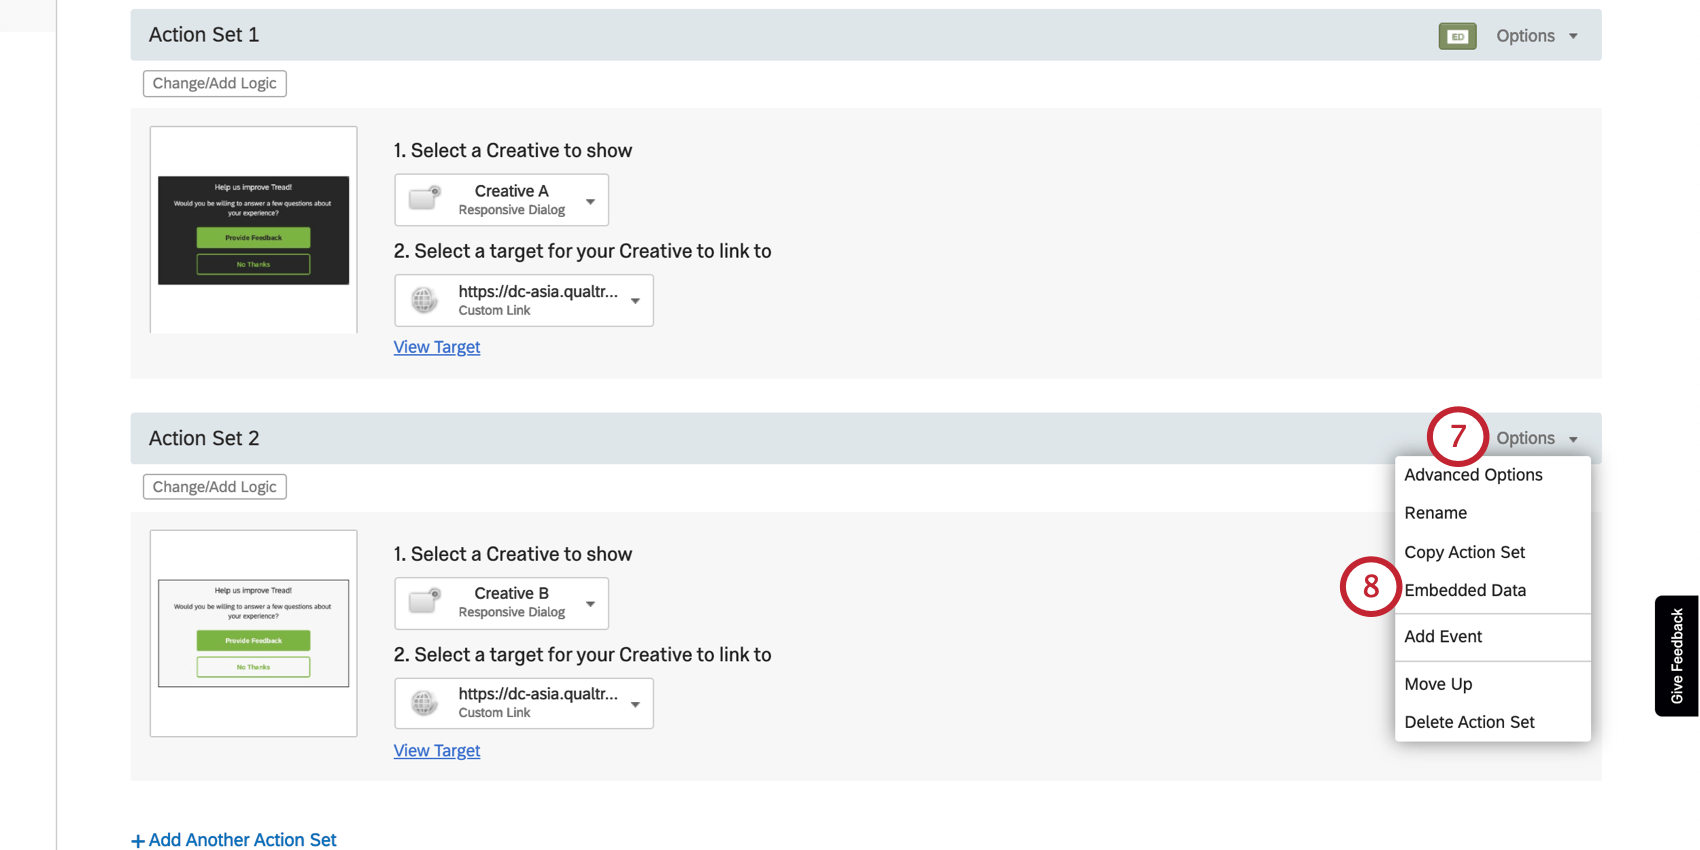
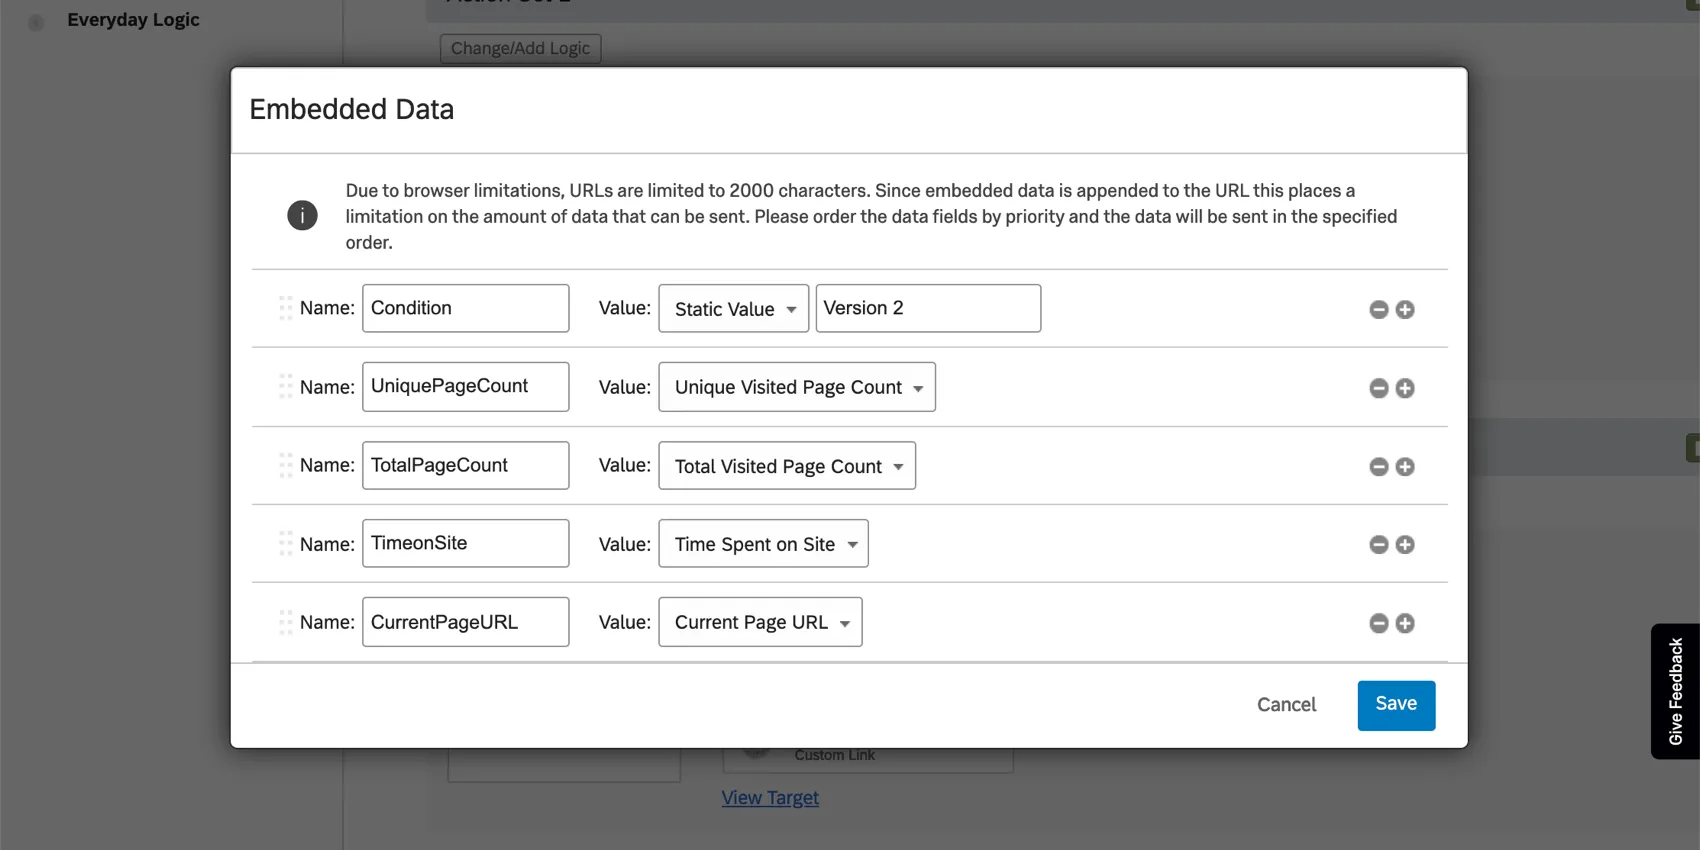
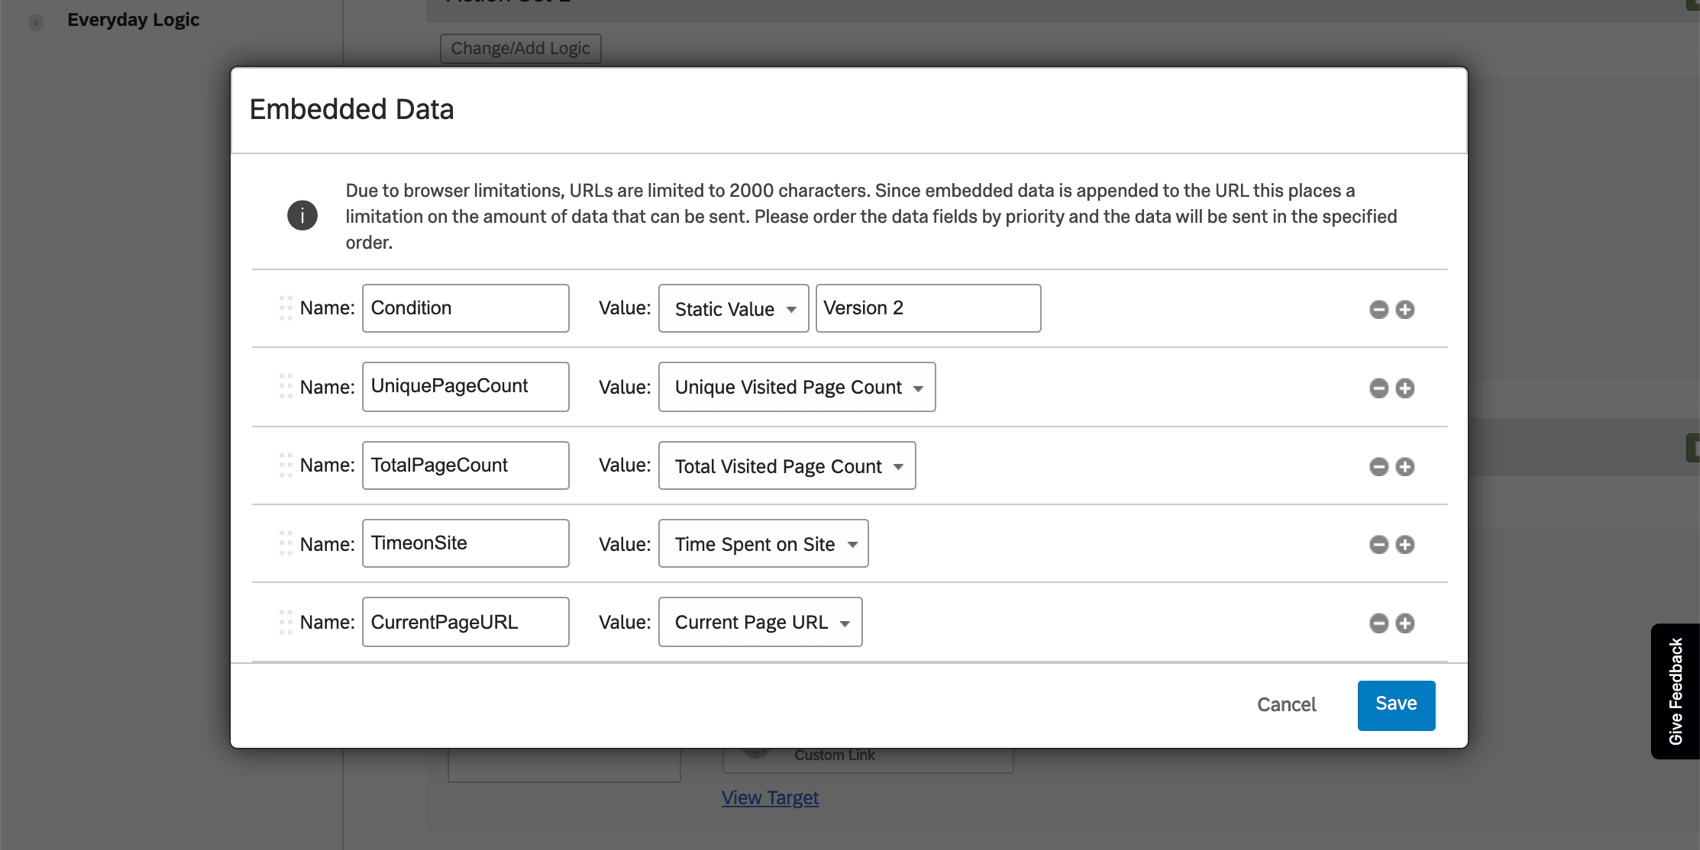
Qtip: Remember that for any additional embedded data you capture, you need to make sure it’s added to both action sets, or you will only have that data for 1 of your conditions. Here’s what the same embedded data shown above would look like for your second condition:
Qtip: Once you choose targets for your action sets, you don’t need to add query strings to them, since adding embedded data to the action sets in the steps above will ensure your chosen data is carried over.
Qtip: Looking to track certain events on your site? See Event Tracking & Triggering.
Additional Intercept Customization
The rest of the options and customization you add to your intercept will depend on the needs of your program.
When editing an intercept, think about how you want that specific touchpoint to behave towards website visitors. For more guidance on the options available to you, see:
- Setting Up Your Intercept: An introductory page that goes over top-level information on intercepts and the types of edits you might want to make.
- Editing Intercepts: Step-by-steps on all the basics to intercept editing, from targets, to the rules under which they display (logic), and more.
Additional resources and advanced options:
- Multiple Action Sets: We covered this a bit in the steps above, but this page goes over how to create and make the most of multiple action sets in your intercept.
- Embedded Data in Website / App Insights: We covered this a bit in the steps above, but this page goes more into depth over how embedded data can be used in Website / App Insights projects. Qtip: Be careful when editing the pre-configured embedded data. If you remove or rename fields, you will not capture the desired information.

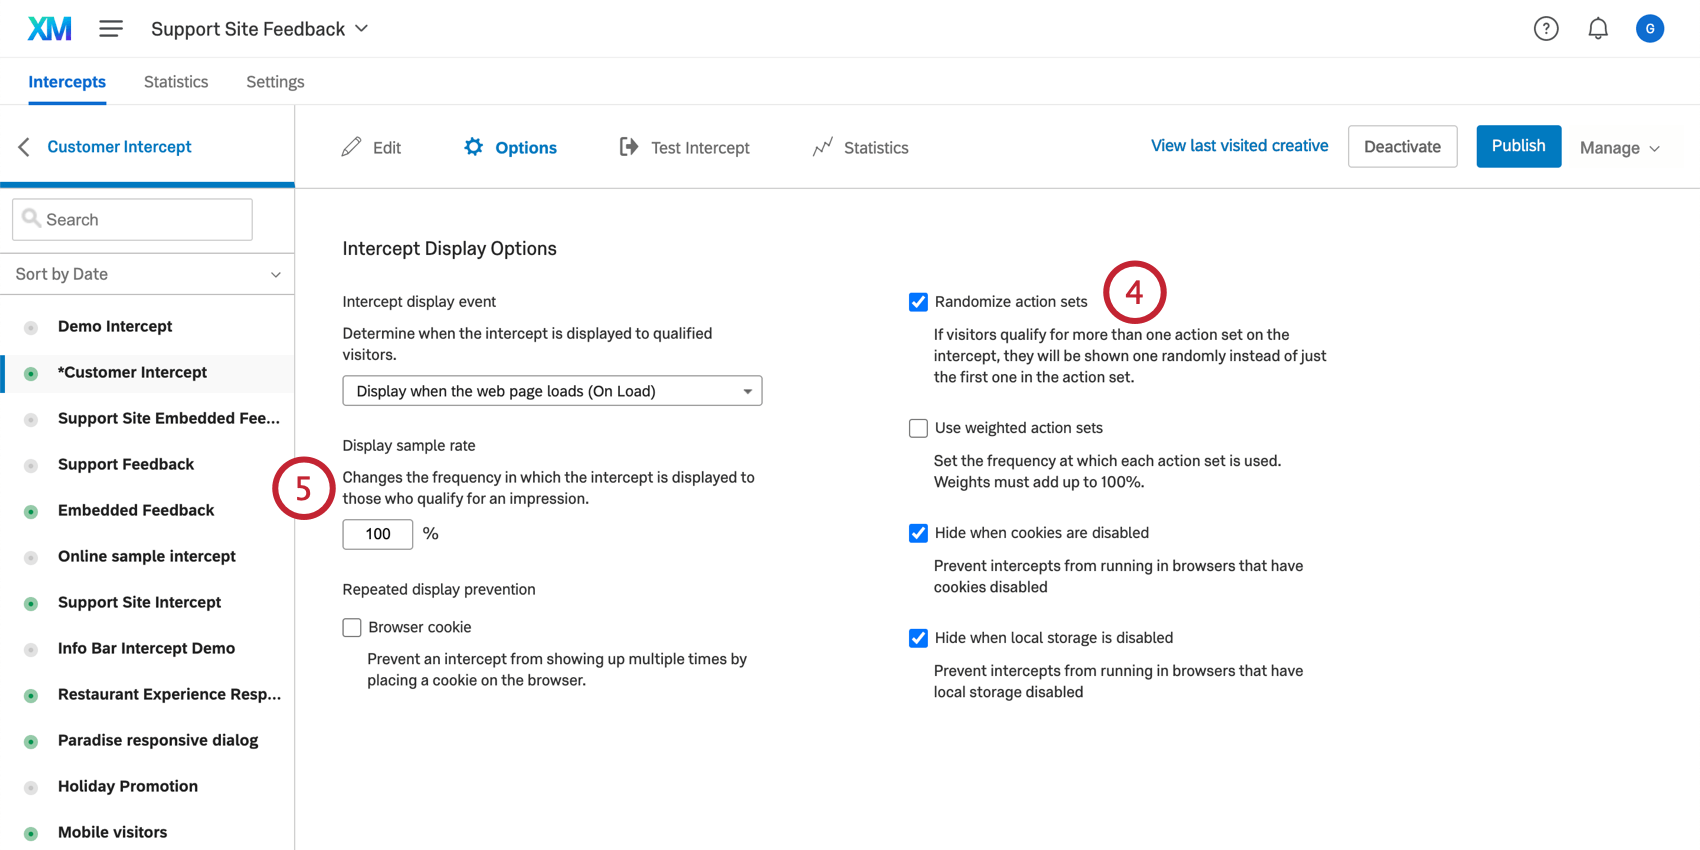
- Intercept Options: This page goes over additional settings that can enhance the behavior of your intercept. Many of these settings manage how frequently visitors on your site see the intercept.
Deployment to a Website
Deployment for A/B testing is the same as for any other Website / App Insights project.
Testing and Activating Intercepts
Try testing the intercept on your website before you deploy anything.
Qtip: Remember to test on the correct URLs. If during project setup you said your intercept should only appear on “www.treadmade.com/home,” it won’t appear when you test it on other pages of your site.
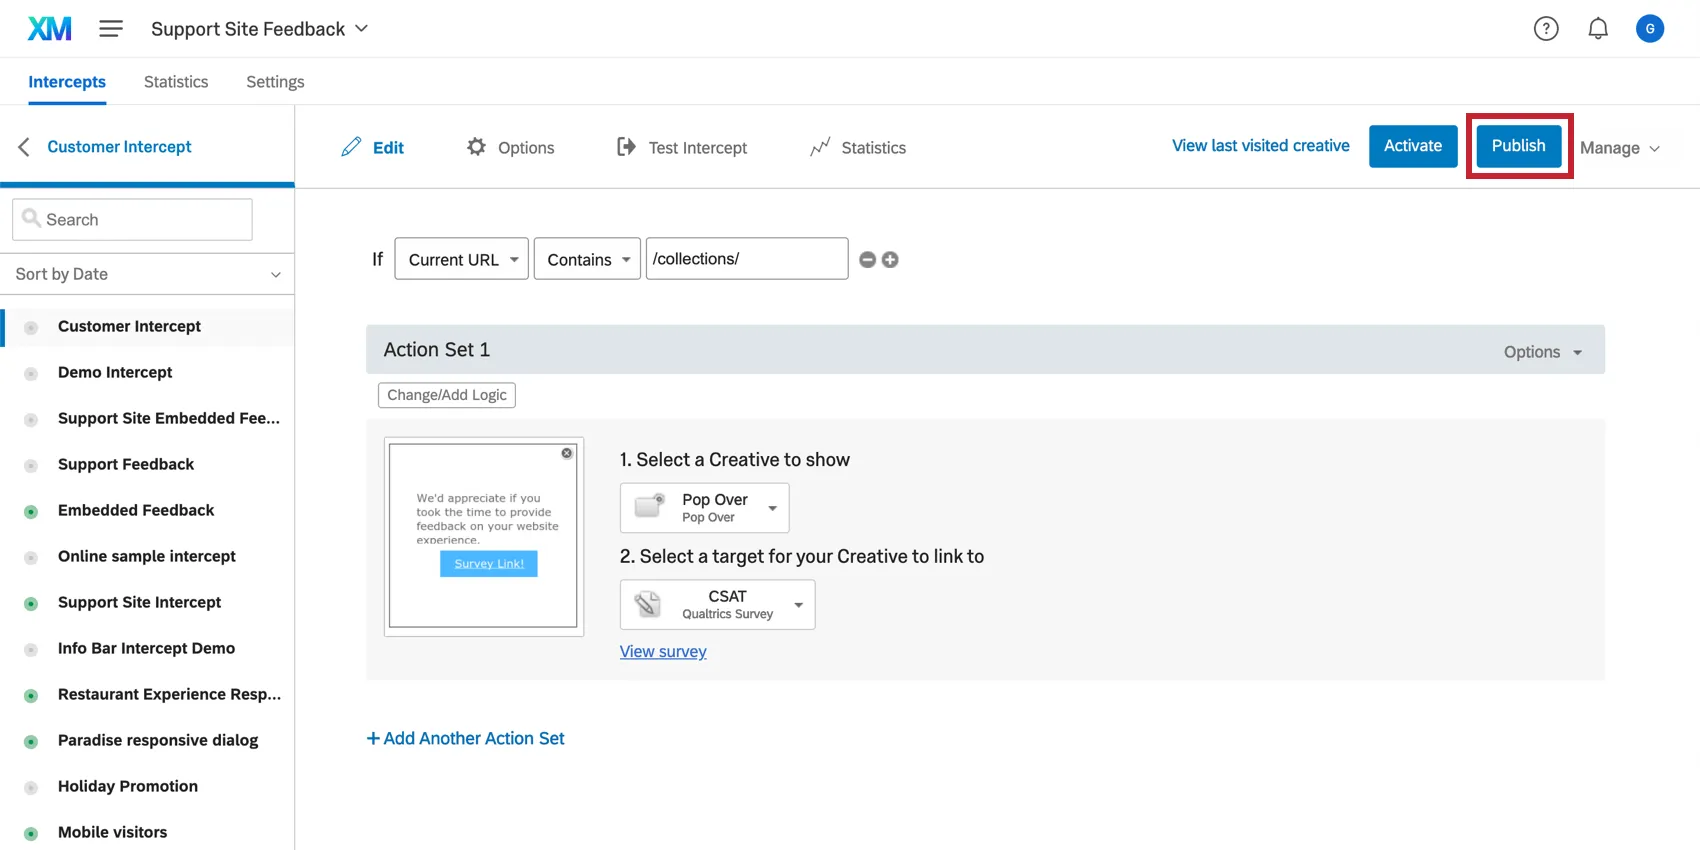
When you are finished editing your intercepts, publish them.
When you are ready for your edits to be live on your website, activate your intercepts.
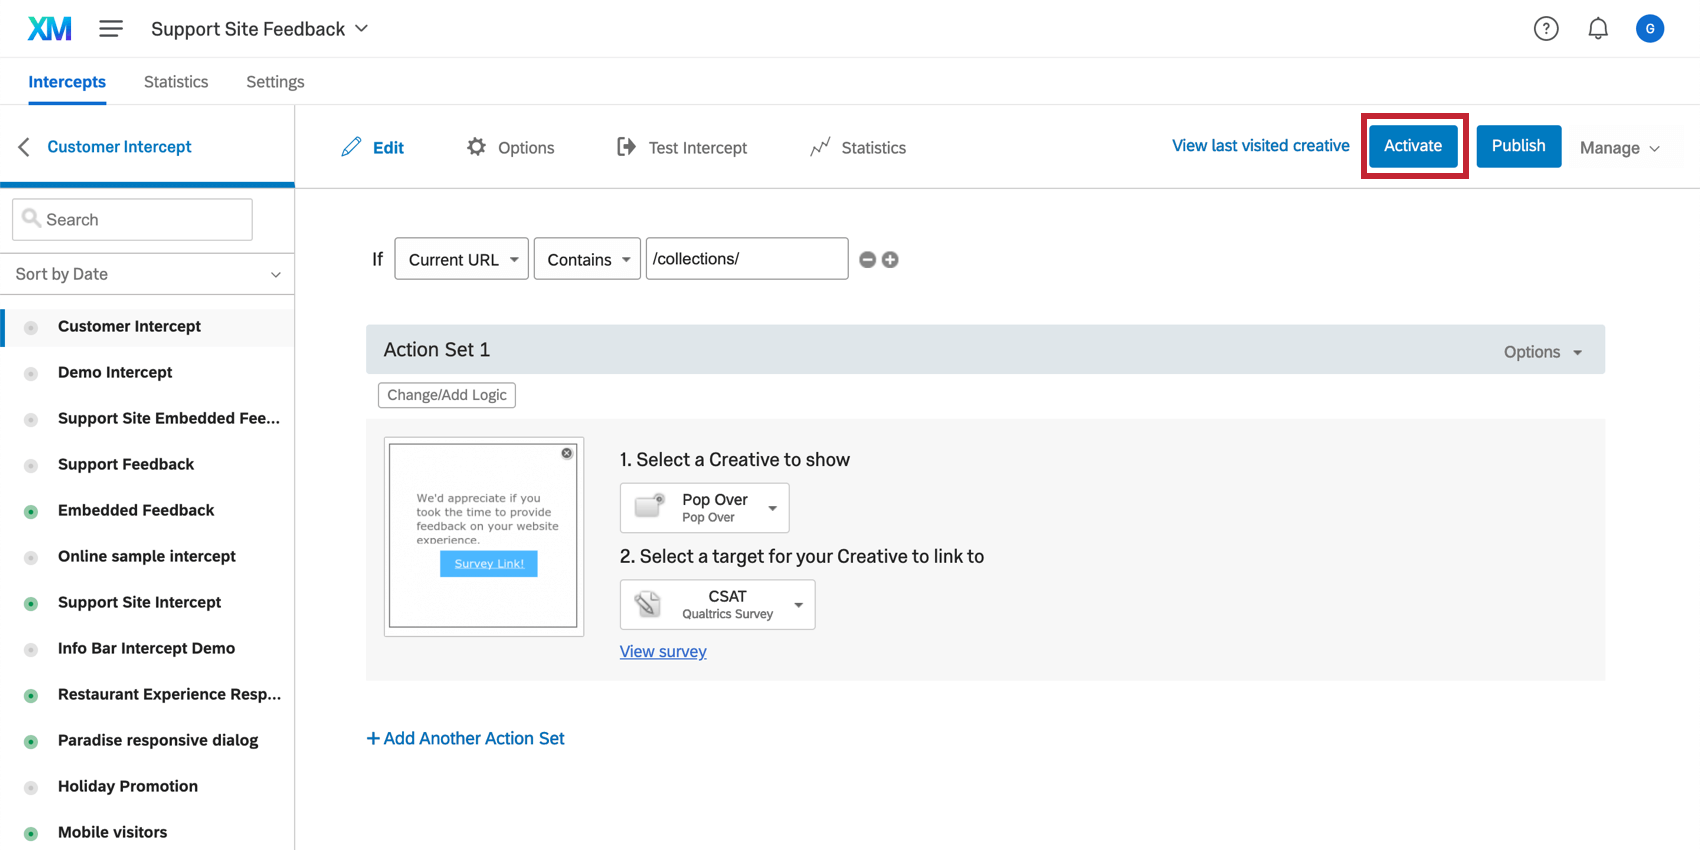

Qtip: Going forward, anytime you edit the intercepts, you will only need to publish your changes to push those changes to your website, because the intercepts are already activated. To disable 1 or both intercepts, you can deactivate them. See more on Activating, Publishing, & Managing Intercepts.
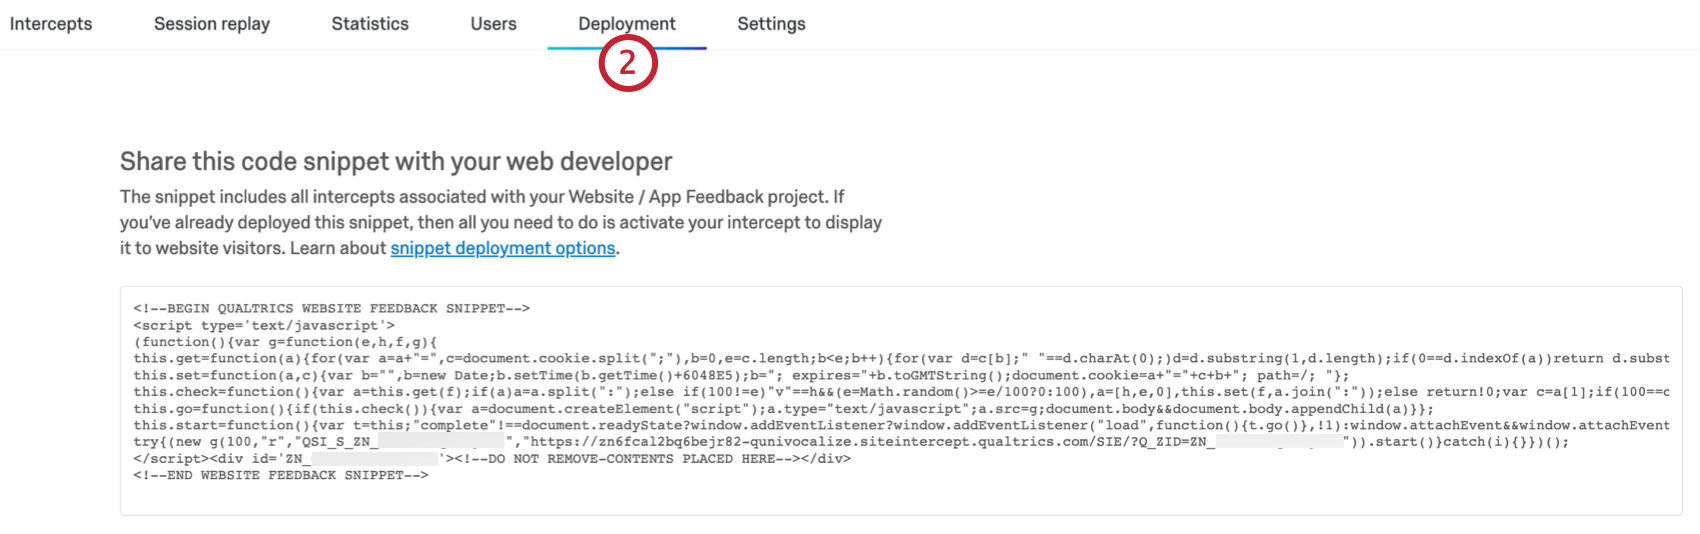
Getting Deployment Code for your Developers
Qtip: For more details, see Project Deployment Code.
Resources for Development Teams
We have a few resources that can help your development team, once they have the code:
Qtip: We recommend using a tag manager to expedite the deployment if you have one already.
Analyzing Results
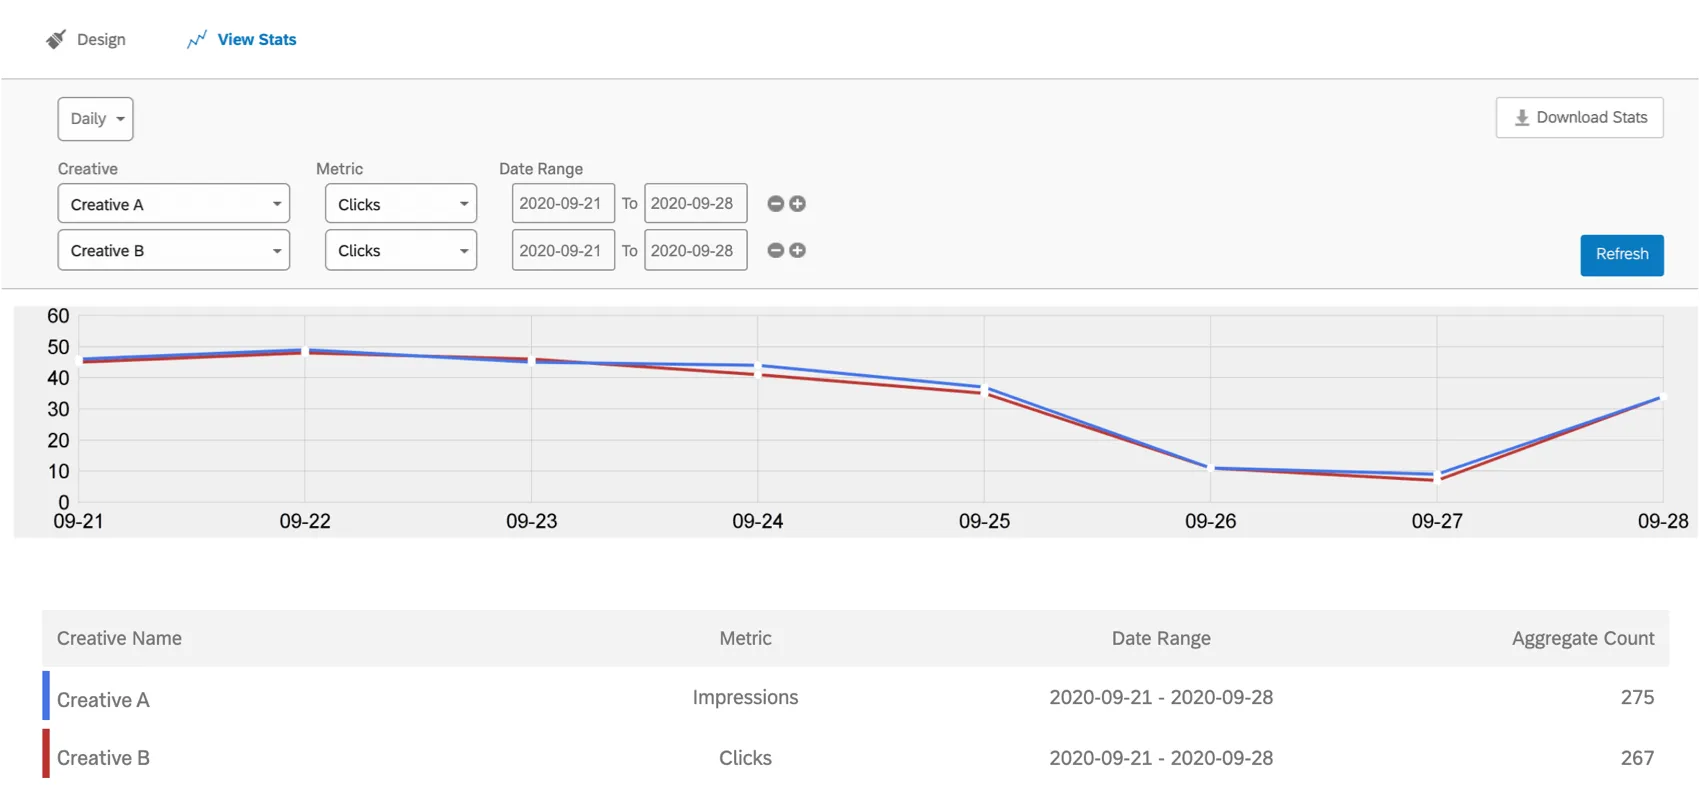
Each creative you made will come with a Statistics page. Here, you can get an idea of how many clicks and impressions your creative generated over a certain time period, and even compare 2 creatives against each other. You can even download this data to a spreadsheet.
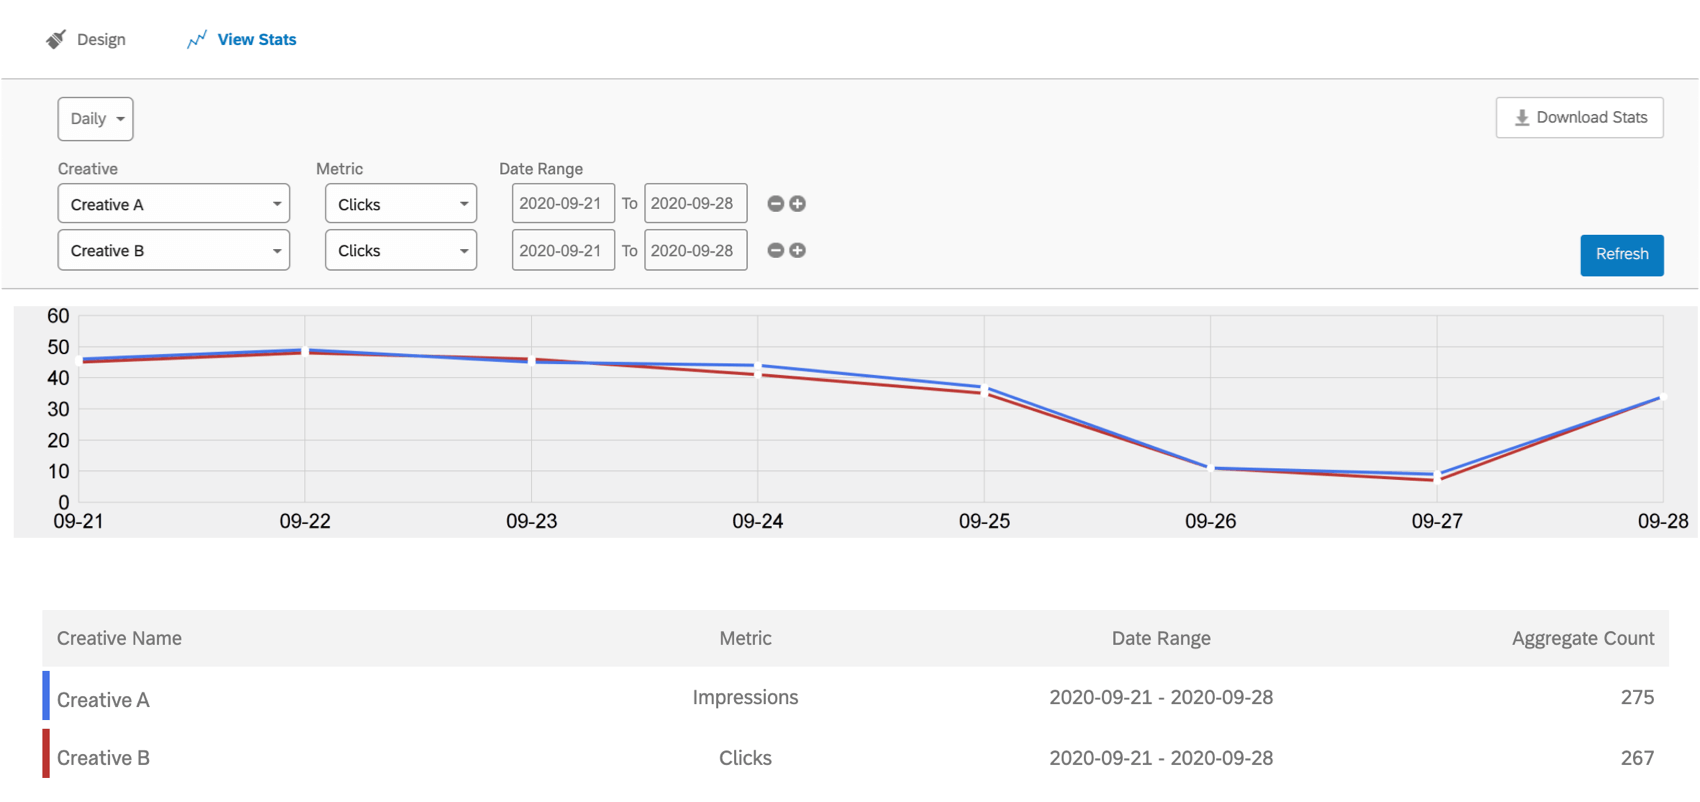
Embedded data
If you added embedded data to your intercepts, then this opens up a world of possibilities with regards to reporting.
Embedded data collected through a Qualtrics survey can be reported on just the same as any other survey data. This means it can be integrated into survey reports and CX Dashboards, and tell a larger story with all the data collected in your program.
Here are some pages to get you started:
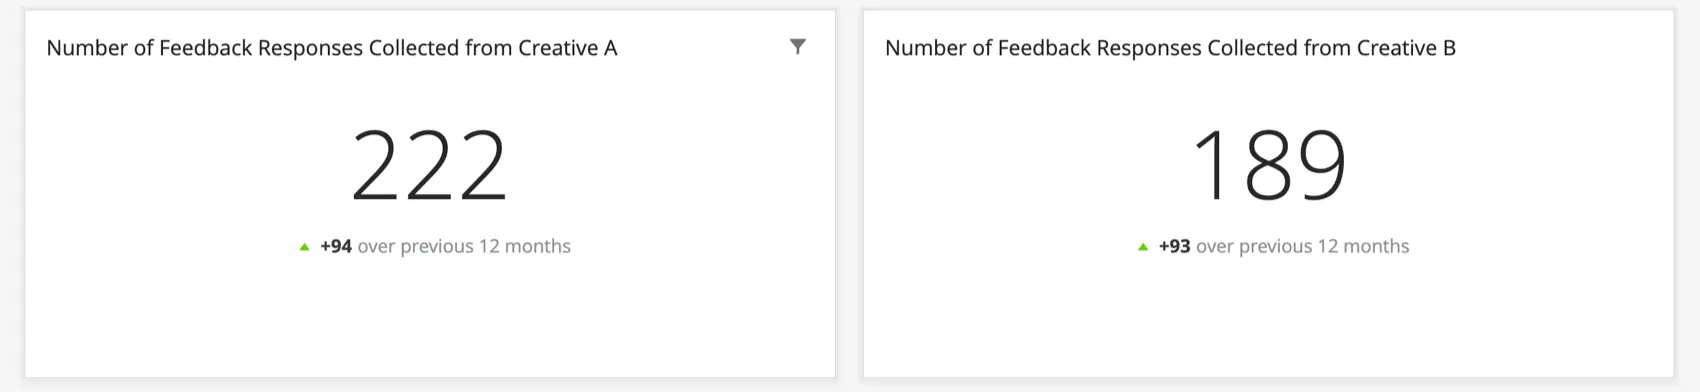
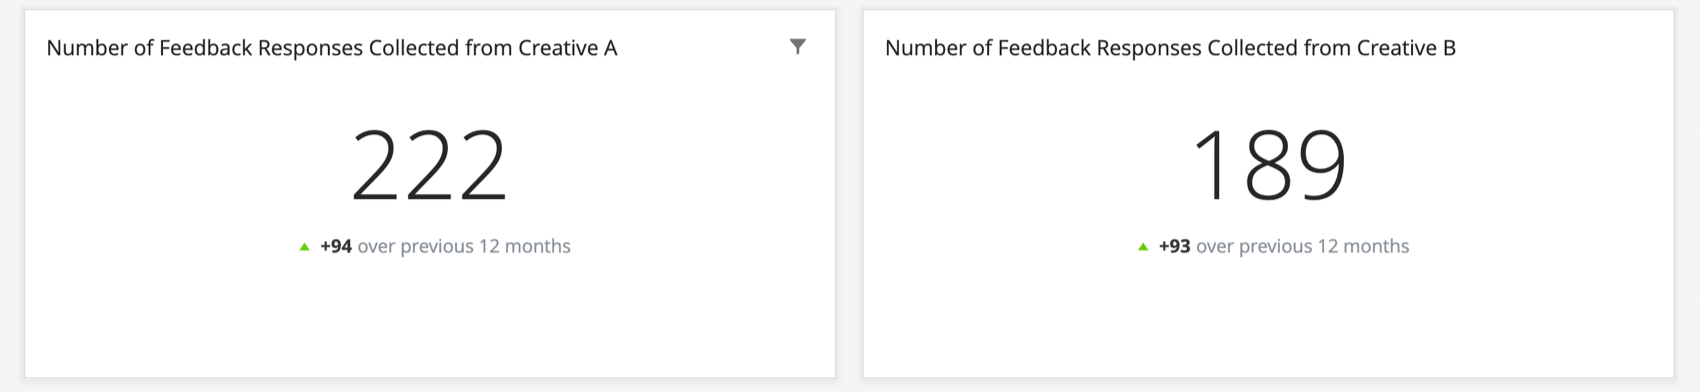
Example: We were testing 2 different feedback intercepts. These number chart widgets shown side by side compare how many responses each version collected.
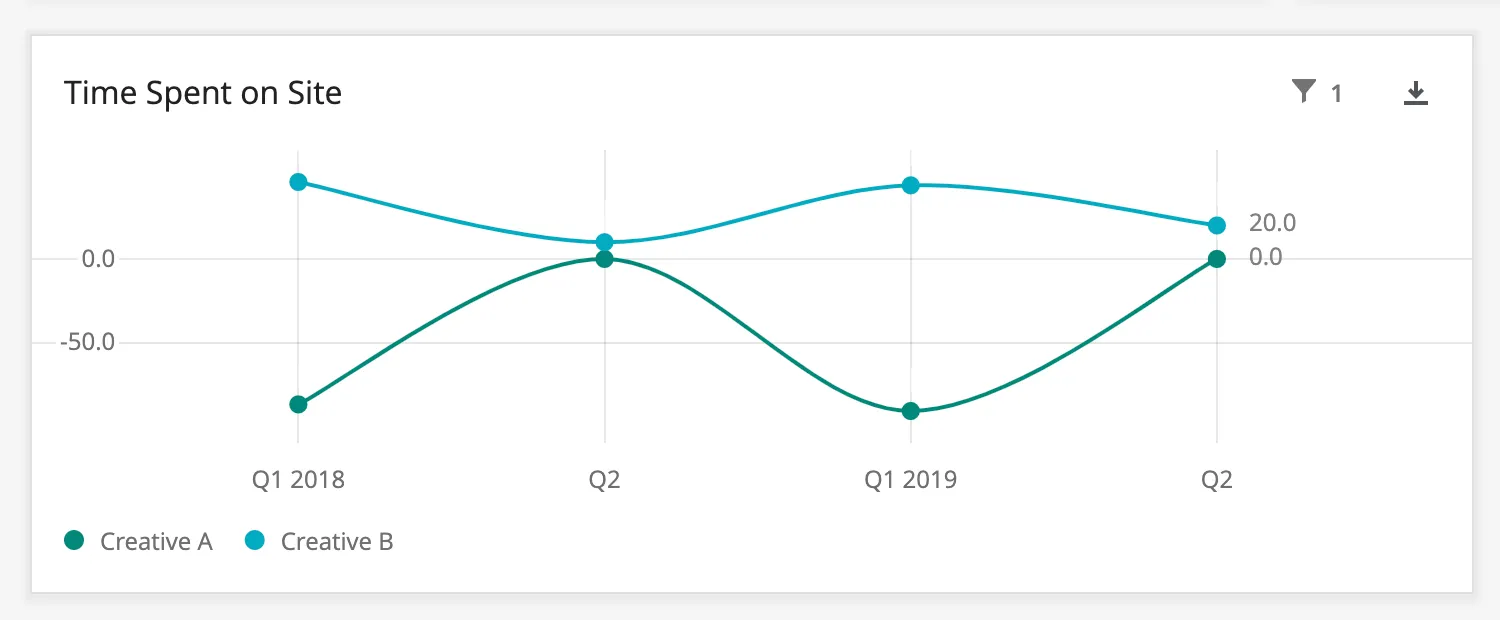
Example: A simple chart widget displaying comparison of time spent on the site after exposure to 1 version of the creative vs. another.
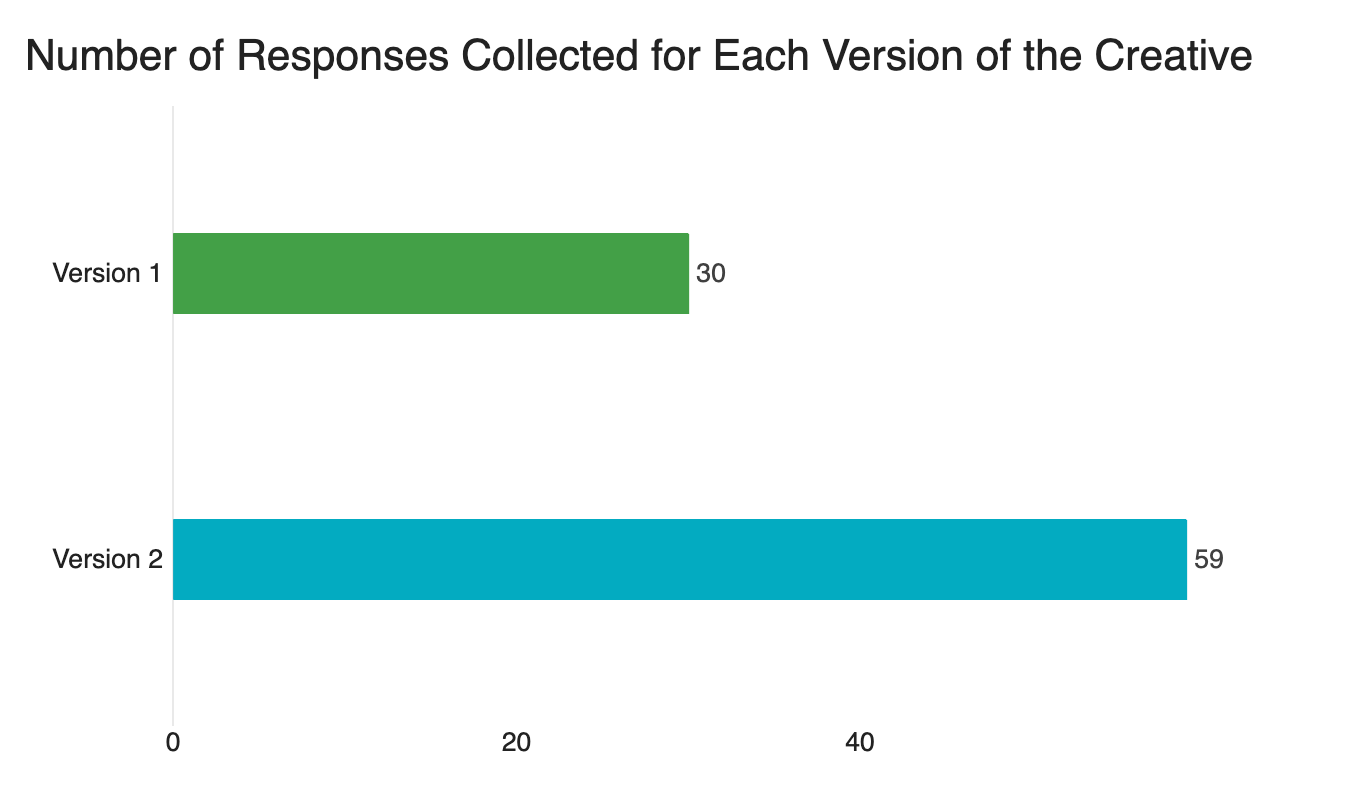
Example: A bar chart comparing responses for each version of the creative.

That's great! Thank you for your feedback!
Thank you for your feedback!