
Digital Experience Analytics Overview
What's on this page
About Digital Experience Analytics
Digital Experience Analytics allows brands to quantify the digital experiences of their customers by capturing moments of frustration that occur during their time on your site, allowing you to make improvements where needed. The experience of individual customers across a single web browser, including the detection of 4 frustration behaviors, can be tracked on mobile web and desktop, allowing for proactive identification of issues within digital properties.
Example: If users are struggling with the checkout process on your website, using session replay to detect frustration behaviors can help you understand which part of the checkout process is confusing for customers.
Digital Experience Analytics is set up all in one easy-to-navigate space. After you collect data, you can dive into user sessions and see quantifiable points of frustration they experienced. In addition to a series of pre-built analyses, you can also move your data into dashboards and build reports from scratch, so you can share your insights with stakeholders across your company.
Digital Experience Analytics is currently only intended for use with website analytics and is not yet compatible with the Mobile App SDK.
Qtip: For information about adhering to applicable data privacy and security regulations while using Digital Experience Analytics, see Data Security & Privacy for Digital Experience Analytics.
Session Replay
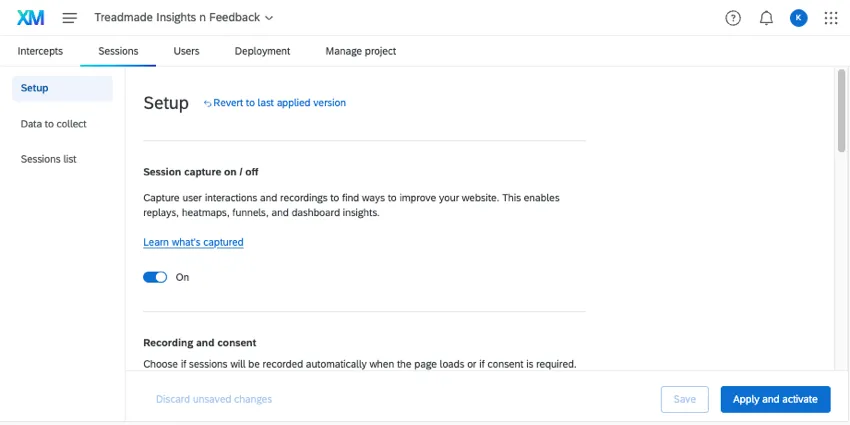
One of the features at the heart of Digital Experience Analysis is session capture and session replay. The visitor’s time spent on your website is “captured,” from their mouse movements to their page navigation, to any frustration behaviors they express. You can then later replay these sessions, giving you insight into your visitor’s experience so you can understand the reasoning behind their behavior.
To use session replay, you need to enable session capture. Once user data starts to come in, you can watch replays of user sessions in Digital Assist.
Qtip: To track your organization’s session replay usage, see Digital Usage.
Frustration Detection
Frustration signals are one of the key data points provided for you throughout Digital Experience Analysis, and they are tracked with each session captured. Frustration signals help you identify the highest points of user friction across your website by highlighting moments when users exhibit frustration.
There are 4 signals currently tracked:
- Rage Click: At least 4 consecutive clicks with less than 200 pixels and 300 milliseconds between each click.
- Mouse Thrash: At least 6 sudden rapid movements of the pointer when it reaches a speed of 4 pixels per millisecond.
Error Click: Clicking an element that results in an uncaught Javascript error within 50 milliseconds of click or 500 milliseconds of a finger tap.

Qtip: You can view additional details about the error message a user saw watching the replay Tab.
- Dead Click: A click on a web button or hyperlink that should have produced an action and does nothing.
Frustration signals can be viewed during session replays and while browsing your data in Digital Assist.
Qtip: You can also use frustration signals to display intercepts when visitors show common frustration behaviors on your website. See Frustration Targeting Logic.
Set Up Digital Experience Analytics
Qtip: If you’re interested in adding Digital Experience Analytics to your license, reach out to your Qualtics Account Executive.
Digital Experience Analytics is a series of features that can be enabled for any Website / App Insights project you’ve created. This feature can be used to analyze activity on desktop and mobile websites. You can use Digital Experience Analytics with or without standard website feedback collection.
Division Permissions
Once Digital Experience Analytics is available in your organization, a Brand Administrator will need to make sure you’re in a division with access to this feature. If you’re a Brand Admin, you can enable the following division permission:
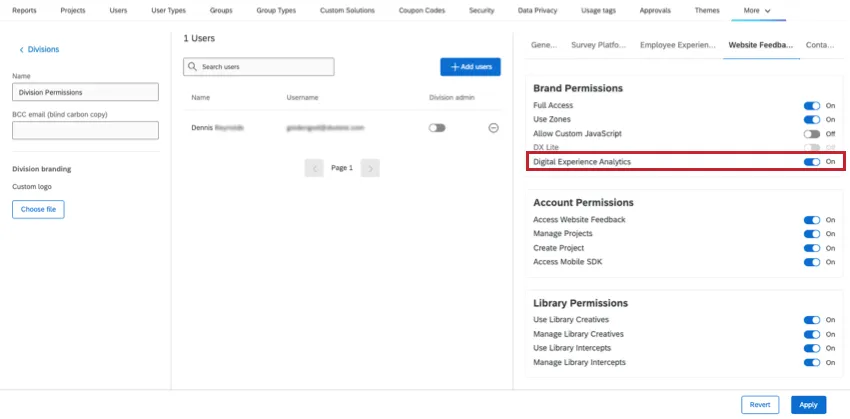
- Website Feedback
- Brand Permissions
- Digital Experience Analytics
- Brand Permissions
Once division permissions are granted, users do not need additional permissions enabled. So long as you have access to Website / App Insights projects, you should also have access to the session replay settings within. See Website Feedback project permissions.
Project Setup
Once the feature is available, you set it up in one of your project’s Sessions tab.
Qtip: If you’re collaborating on the same Website & App Insights project with other users and want them to have access to session replay, they need to have the Manage Projects permission. Only the project’s owner can adjust this permission. See Sharing Permissions.
Digital Assist
Once you’ve enabled session replay and recorded user sessions on your site, you can go to Digital Assist to look at your data and start analyzing. Digital Assist is home to all recorded user sessions, as well as some additional tools to help you get insights on your data, such as conversion funnels and navigation heatmaps. You can even share these reports once you’re finished creating them.
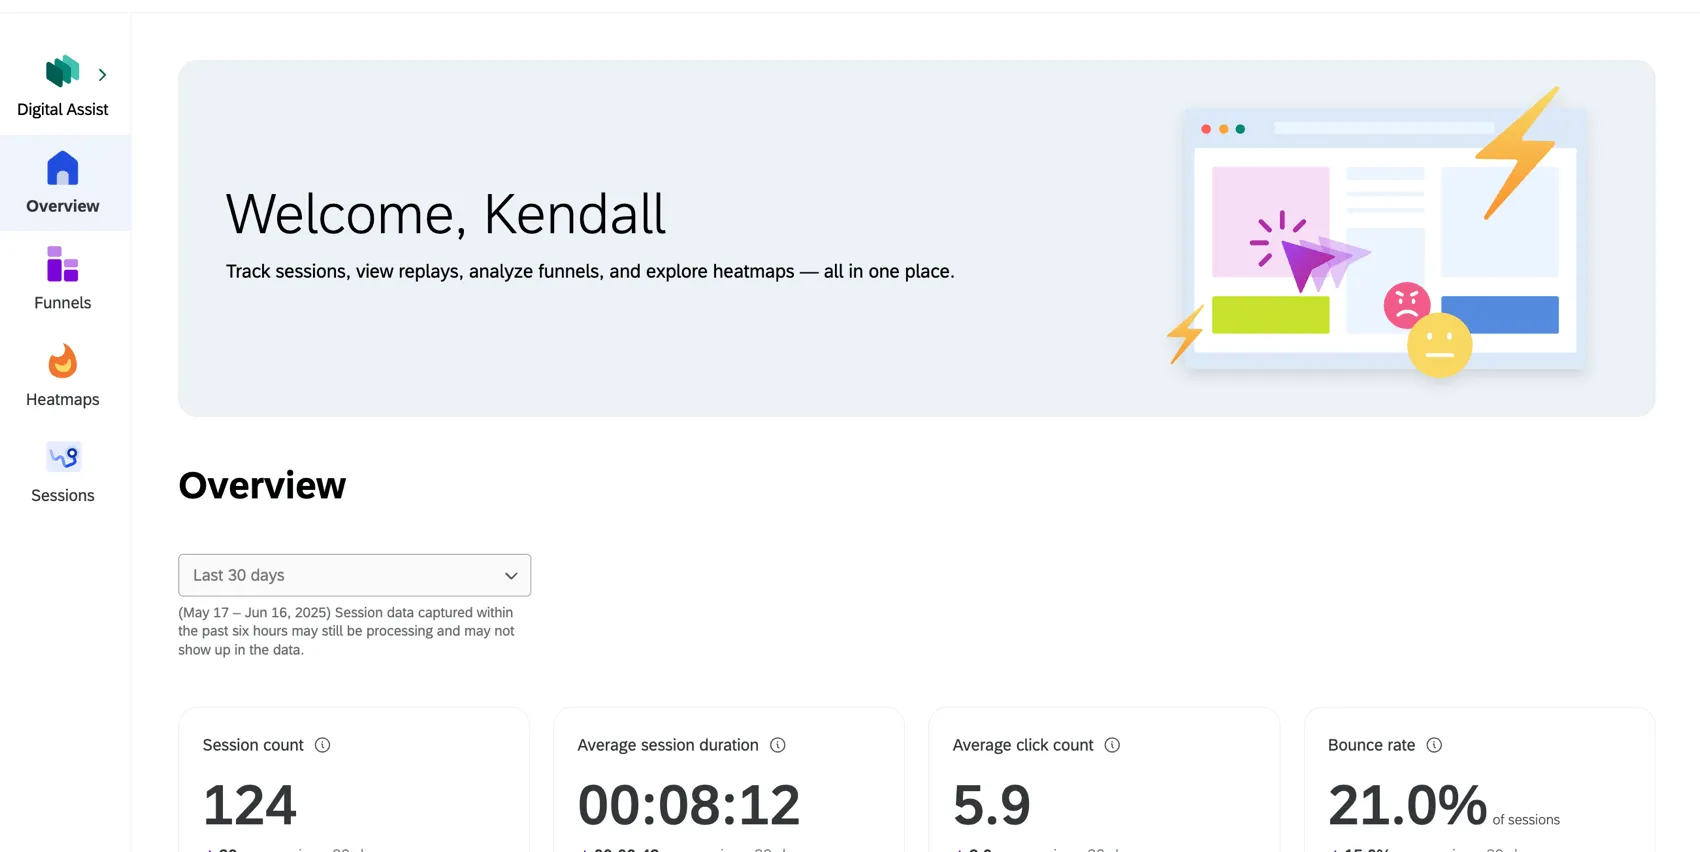
To learn more about Digital Assist, see the Digital Assist Overview.
Viewing Data in a Dashboard
In addition to Digital Assist, you can visualize your Digital Experience data using CX Dashboards. Report on session data and frustration signals within a dashboard to see frustration trends over time and explore insights about where peak frustration is occurring for specific web experiences.
Data can be used in the Digital Opportunities Widget, or added to widgets in existing dashboards.
Qtip: Text iQ fields are not supported in the Digital Experience Analytics dataset. However, you can join this dataset with another dataset that contains Text iQ data (such as a survey). This is described in the “Joining Session Replay Data with Survey Data” subsection below.
Available Fields
Here are a few of the fields included in Digital Experience data sources:
- Data type: What kind of record this is, which affects the meaning of the rest of the rows. Possible values include:
Mouse thrashes, rage clicks, dead clicks, and error clicks: Counts of specific frustration signals.

Example: You can filter specific frustration signals by a PageName to see the number of times that signal occurred for a specific page tag.
Example: If you filter DataType to Session Totals, you can see the number of times a given signal occurred across the whole session.
- Behavior: The total number of frustration signals detected across this session or a specific page tag within the session.
- Conversion: A “true or false” field indicating whether a conversion event occurred.
- Device / device type: The visitor’s device type, desktop or mobile browser.
- Custom metadata: Visitor details set up in the project.
- Custom signals: Custom events set up in the project.
- Number of pages visited: If the record is for an entire session, this field shows the number of different pages visited.
- Page name: If the record is for a page tag instead of a session, this field shows the name of the tag.
- Page tags: If the record is for an entire session, this field shows all of the page tags included within the session.
- Session length: The length of the session, in seconds.
- Session start time: The date and time the session started.
- Source referrer: The HTTP referrer header URL detected at the start of the session.
Mapping Digital Experience Analytics to a Dashboard
To visualize session data in a dashboard, all you have to do is create a data model, then find that Website Feedback data source.
Qtip: These steps can be completed by the user who enabled Session Capture or collaborators with the “manage data source” permission.
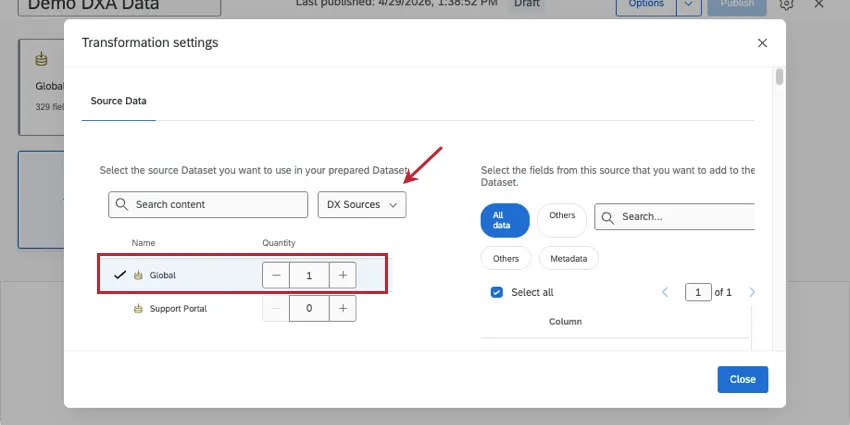
Add a source.
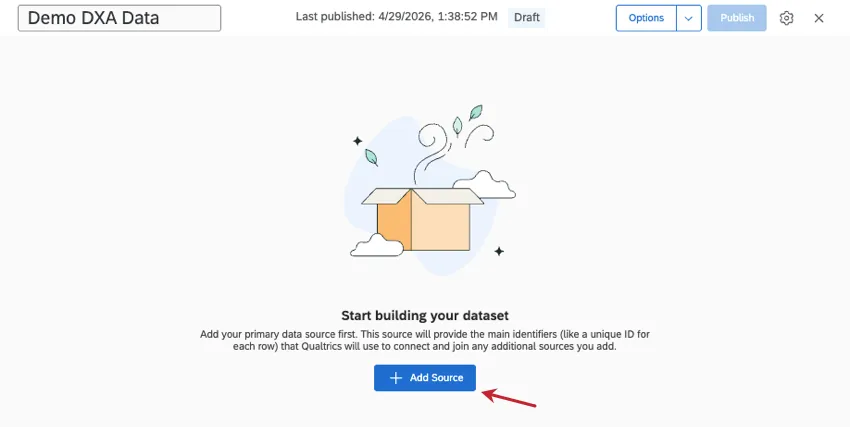
Search your Website Insights project by name, or filter by DX Sources.
You can add other sources, make unions, and add joins, or you can just immediately add an output dataset if you only want Digital Experience Analytics data.
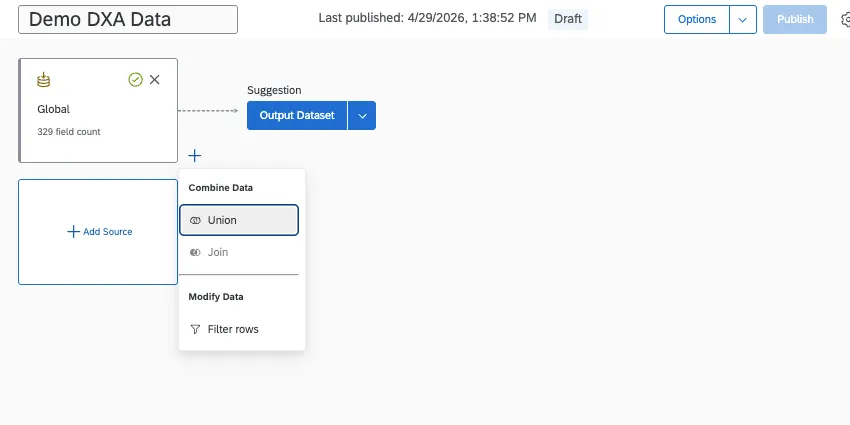
Once you’ve added your output, publish your changes.
Joining Session Replay Data with Survey Data
To visualize session data in the same dashboard as survey data, make sure any survey you want to add has Text iQ enabled. These surveys must also have embedded data fields that capture the Session ID and Playback URL.
Qtip: These steps can be completed by the user who enabled Session capture or collaborators with the “manage data source” permission.
Attention: Session ID and Playback URL are only compatible with Digital Experience Analytics datasets. You cannot use these fields with a digital program health dataset.
Attention: Joins with Digital Experience Analytics (DXA) work in a unique way. Once you create a join with a DXA dataset, only those resulting fields will carry into the final output dataset. Every source you include must be joined with the DXA dataset in some way in order to be included in the output dataset.
- If you joined survey 1 and a DXA source, and then tried to add a union between your join and survey 2, only survey 1 and DXA’s fields would actually be included in the dataset.
- However, if you first make a union of survey 1 and 2, and then join with the DXA dataset, your output will include fields from survey 1, 2, and the DXA source.
Make sure this is one of the surveys you’re using in your DXA project. This survey can be a target in any of the intercepts in your project.
Navigate to the survey you want to include in your dashboard.
Add an embedded data element at the top of the survey flow.
Enter “Q_SR_ID” for the first field name.
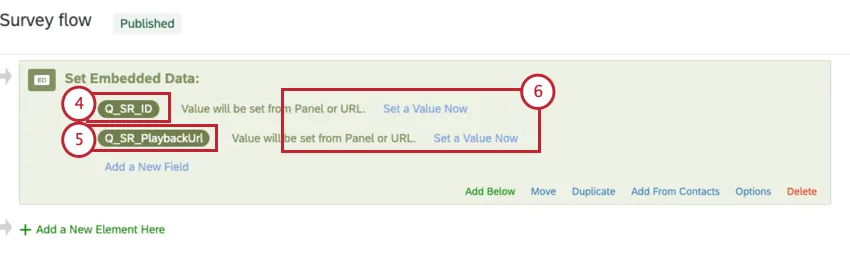
Enter “Q_SR_PlaybackUrl” for the second field name.
Leave the values blank.
Save your survey flow.
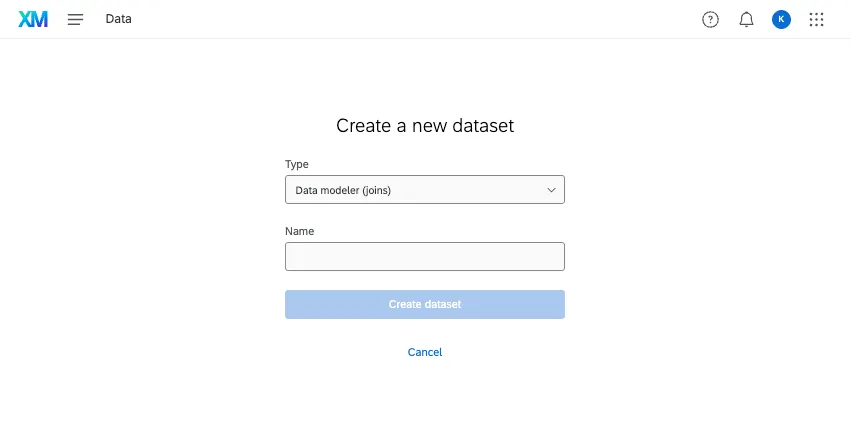
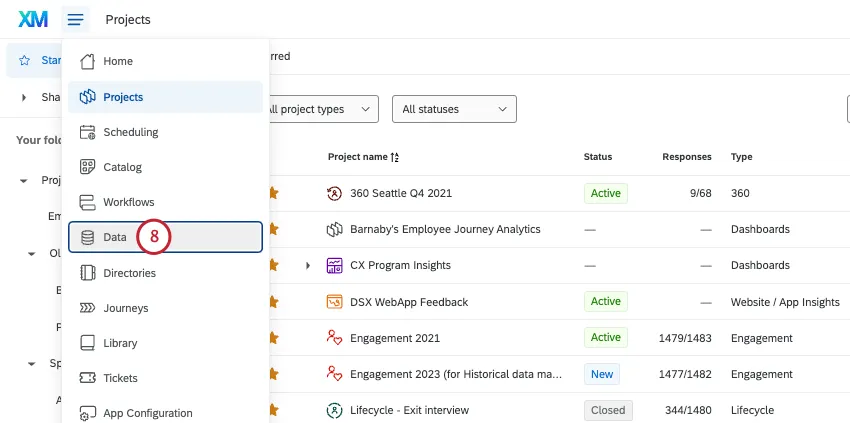
Go to the Data page.
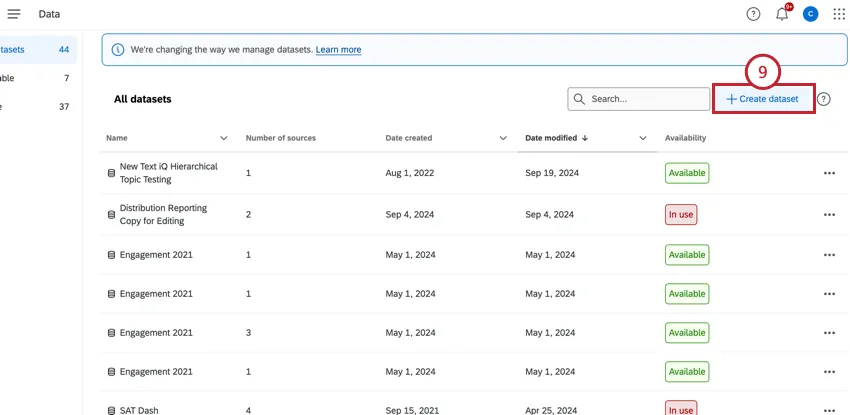
Click Create dataset.
Choose Data modeler (joins) and give the dataset a name.
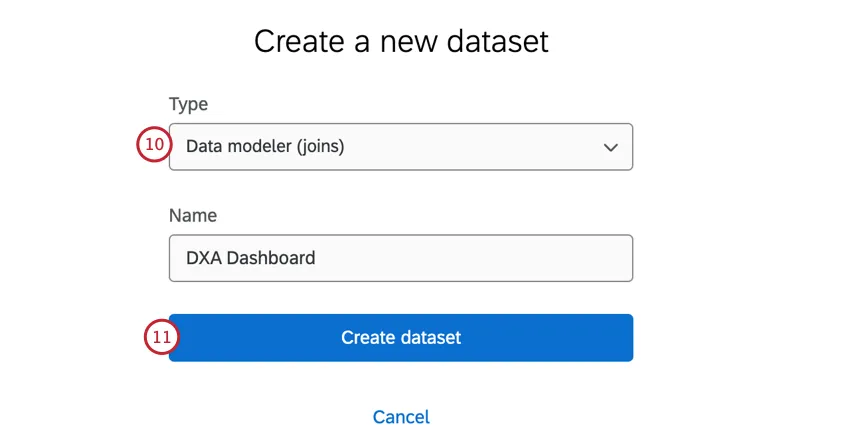
Click Create dataset.
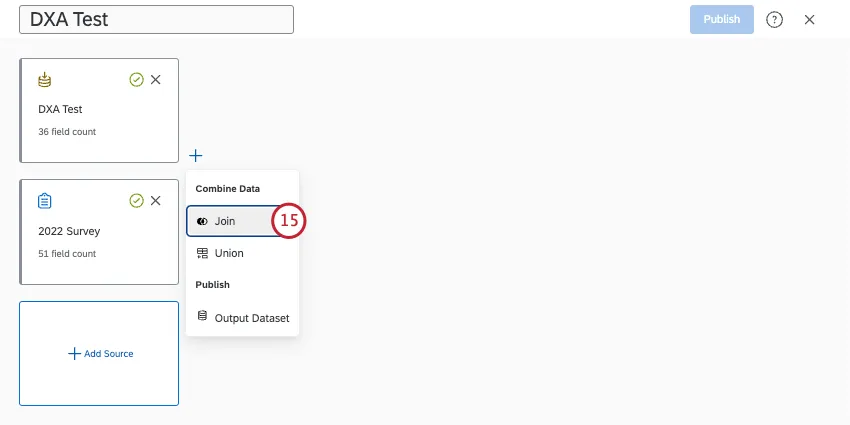
Click Add Source and search for your DXA project. You can filter for DX Sources to quickly find eligible data sources.
Add another source.
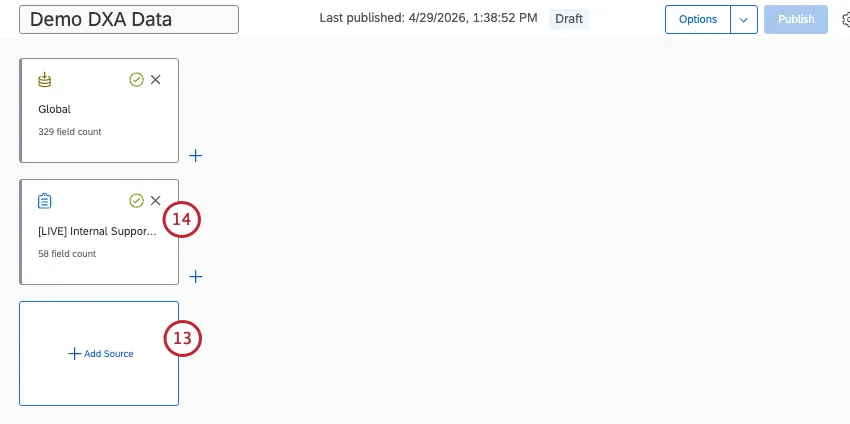
Find your survey and add it to the dataset.
Qtip: Need to add more than one survey? Before you create a join, make a union between all of your surveys. Then create a join with the DXA data as the left source and the union as the right source, following the steps below.
Create an outer left join.
The Website Insights data (DXA) should be Source 1 (the left source, or primary table).
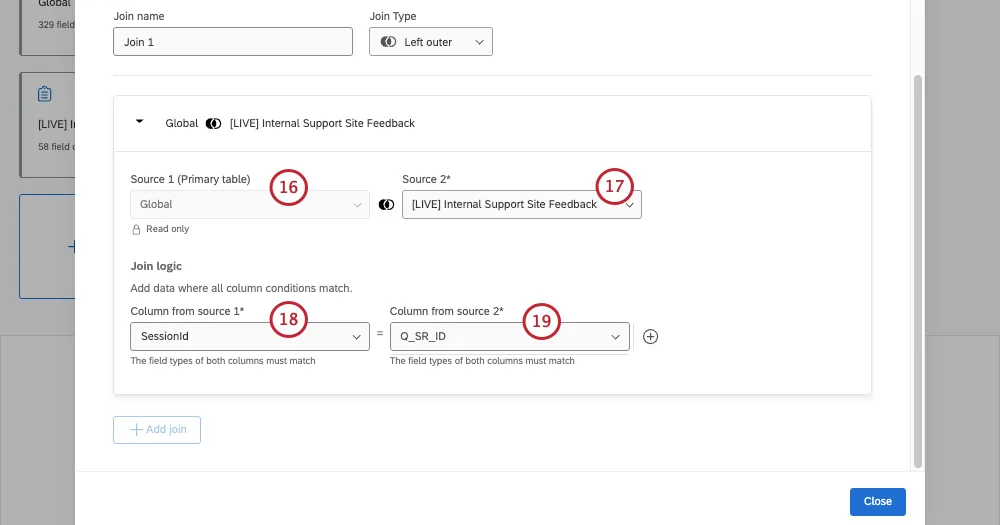
The survey should be Source 2 (the right source).
The left Join condition should be SessionId.
The right Join condition should be Q_SR_ID.
Add an output dataset to your data model.
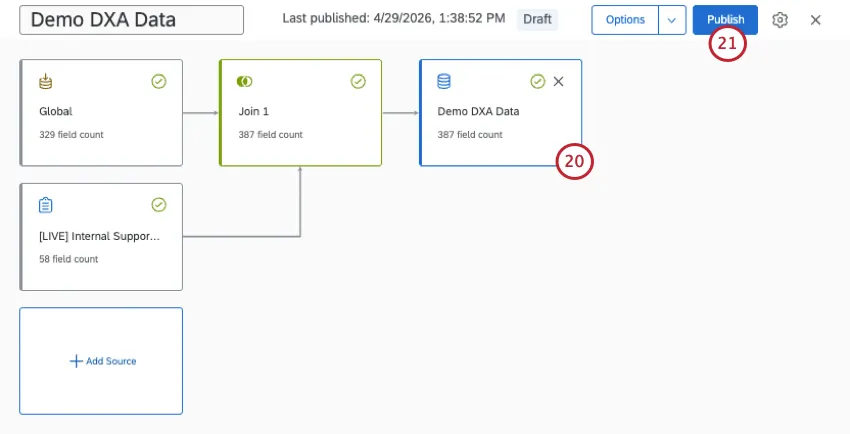
Publish your changes.
Qtip: For more information on customizing your dataset, see Editing a Data Model (CX).
FAQs
What should I be basing frustration targeting logic on?
What should I be basing frustration targeting logic on?
If I sample with Digital Experience Analytics, will that affect who sees intercepts with frustration targeting logic?
If I sample with Digital Experience Analytics, will that affect who sees intercepts with frustration targeting logic?
Does Digital Experience Analytics have to be in a separate project?
Does Digital Experience Analytics have to be in a separate project?
Do I have to deploy new code for Digital Experience Analytics or session replay?
Do I have to deploy new code for Digital Experience Analytics or session replay?
That's great! Thank you for your feedback!
Thank you for your feedback!