
Response Rate Table Widget (EX)
What's on this page
About Response Rate Table Widgets
The response rate table widget displays the response rates for your engagement survey. It can also display response rates by participant metadata fields, so you can see a breakdown by department, gender, location, or other information you have preloaded into your participant list.
Qtip: Unsure which Employee Experience projects have this widget? See our Widget Types and Project Compatibility table.
Understanding Response Rate Tables
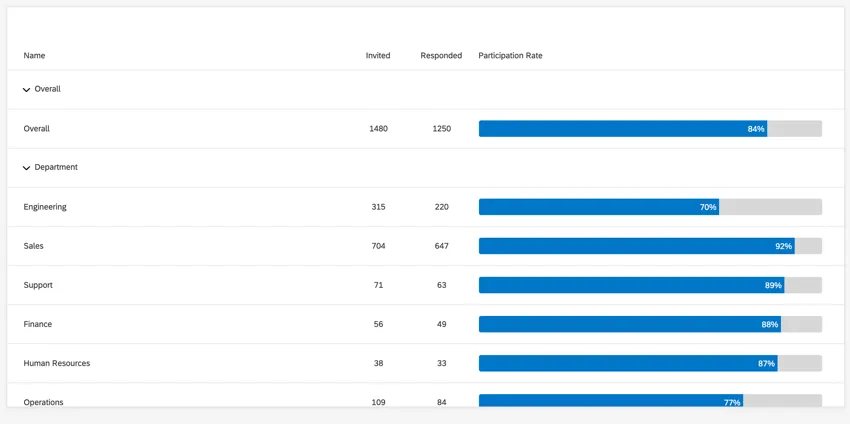
The response rate table widget has three unique columns:
- Invited: The number of participants invited to complete your project. Actual invites do not have to go out for this number to be generated. This is the number of people in your hierarchy listed as respondents. Anonymous responses are not counted. Qtip: A respondent is a participant who is expected to answer the survey; all participants are respondents by default. When you upload your participants, you can include a column called Respondent and specify a 0 for participants you don’t want to have to complete the survey, but who might still be in charge of dashboards or validating the org hierarchy. These participants will not be included in the Invited count. You can also specify the individuals who are and aren’t respondents by selecting or deselecting the Is Respondent option in the participant information window.
 Qtip: When using an Employee Lifecycle project with Multiple Responses enabled, your invited count may look different than expected. When respondents submit multiple responses for a Lifecycle survey, each response is included in the invited count along with the number of participants who are eligible to take the survey. In order for your widget to show new participants that were added, make sure to update the invited count.
 - Responded: The number of completed responses.
- Participation Rate: The percentage of those invited who responded. This should be ( Responded / Invited ) x 100.
Qtip: Response rates are calculated differently for 360 projects depending on when your project was created:
- If your project was created after December 11, 2024, self reflections are included when calculating the response rate.
- If your project was created before December 11, 2024, self reflections are not included when calculating the response rate. These projects will be updated to use the new behavior by the end of January 2025. You can update a project to include self reflections by navigating to your self reflection options, clicking Manage settings, making sure self reflections are set to Visible, and then clicking Save.
Other evaluations (e.g., peers, manager) are included. You can only filter this widget by relationshipID, not relationship name.
There are two key pieces of information to note about response rate table widgets:
Qtip: You cannot filter response rate table widgets by metadata fields that have been recoded. To filter by these fields, you will need to do one of the following:
- Edit the metadata field values directly in the participant window so they match the recoded values.
- Add a new metadata field with your recoded values and map the new field into your dashboard.
Attention: If you’ve made changes to your participant list or Org Hierarchy after creating your dashboard, you may need to Update Invited Counts so this widget displays your updated participants.
Field Type Compatibility
Response rate table widgets are compatible with participant metadata fields that are mapped with the following field types:
- Text Set
- Multi-Answer Text Set
Attention: Response rate table widgets only work with metadata fields that are automatically mapped to the dashboard. If you manually add another field or change the field type of the original field, then these fields won’t work in the widget.
Qtip: This widget can only be filtered by metadata fields mapped as “Multi-Answer Text Sets” or by org hierarchy filters. Filtering by data source is currently not supported. Additionally, this widget cannot be used on any pages that contain a drill down filter.
Widget Customization
For basic widget instructions and customization, visit the Widgets Overview support page. Continue reading for widget-specific customization.
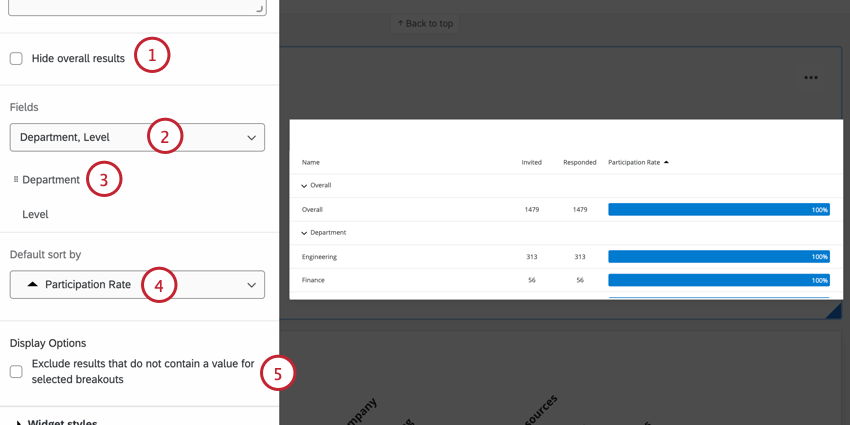
The response rate table widget does not need to have a source or a metric added to function correctly. However, you still have a number of customization options for this widget if you want it to display more than just the response rate.
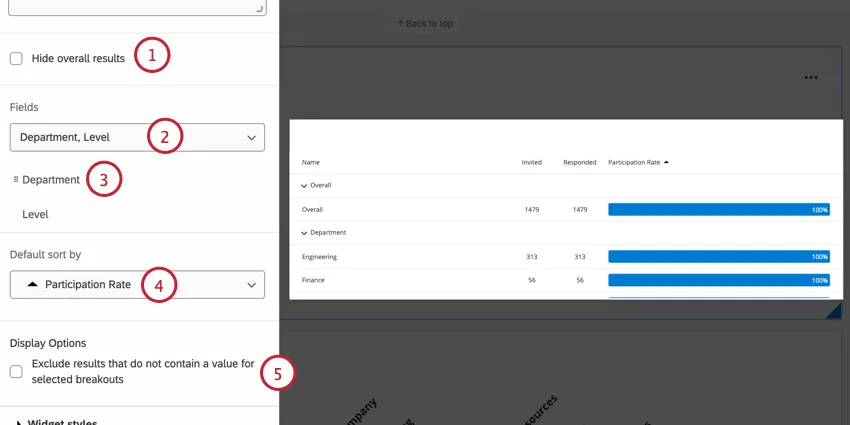

Attention: We only recommend breaking out your response rate widget with fields that have fewer than 5000 values. For example, departments, rather than individual employees. Once a response rate widget is broken out by more than 5,000 rows, only those first 5,000 alphabetically will be included in the invited counts.
Qtip: When displaying org hierarchy units or filtering by an org hierarchy unit, the manager of the selected unit will not be included in the invited and responded counts.
FAQs
Why are my response rates showing up wrong in my widget in my EX dashboard?
Why are my response rates showing up wrong in my widget in my EX dashboard?
That's great! Thank you for your feedback!
Thank you for your feedback!