
Results Table Visualization
What's on this page
About Results Tables
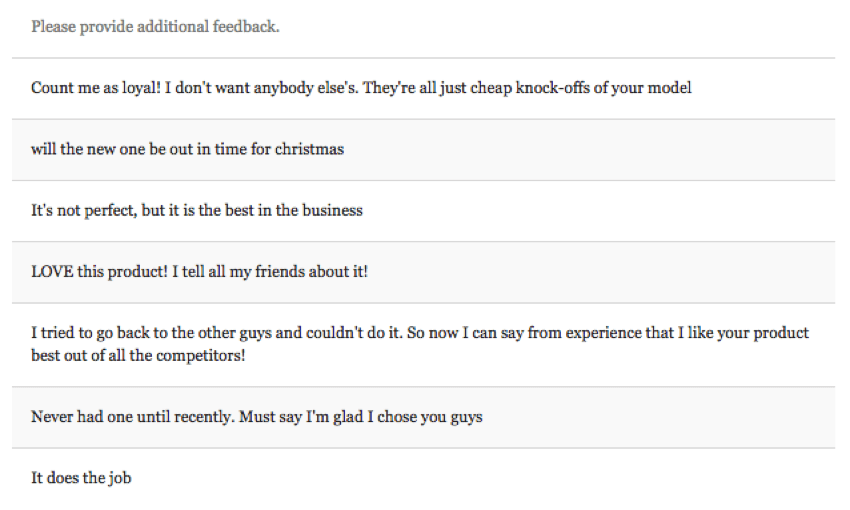
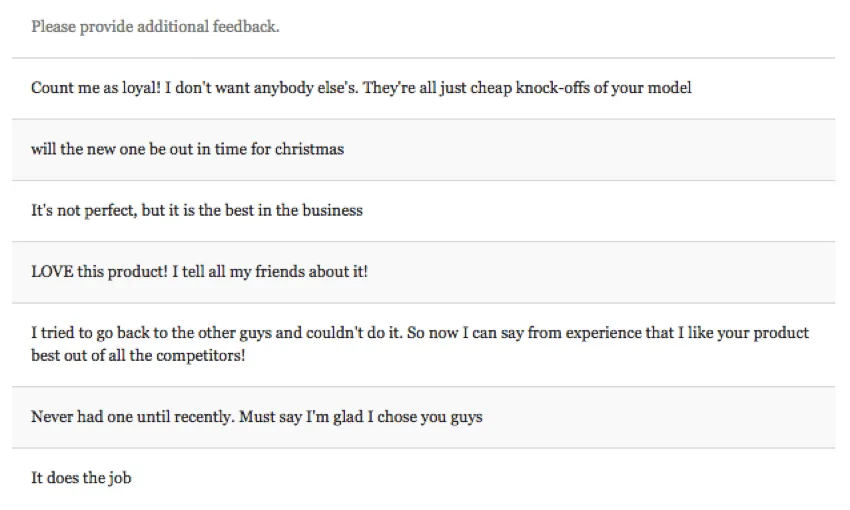
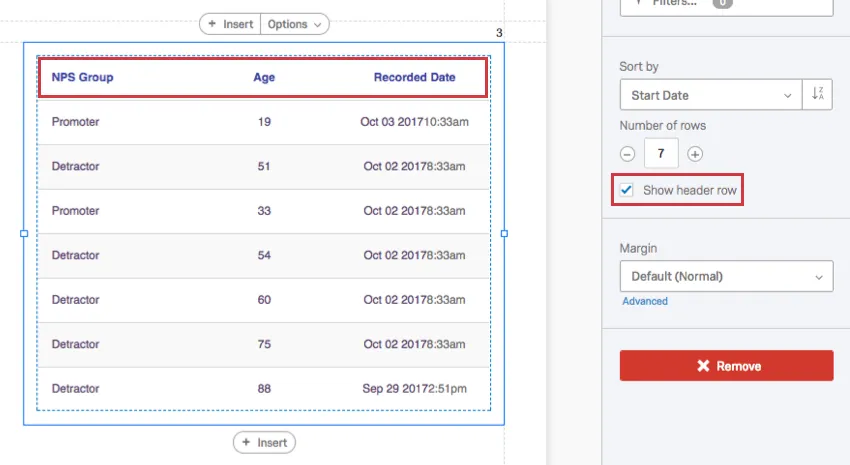
The Results Table visualization displays data in a list format. It breaks out each response as a separate row, and allows you to customize what columns of collected data to include. The Results Table is best if you want to see individual responses or open-ended feedback; if you want to display aggregate data, use the Statistics Table or a Data Table.
Qtip: Don’t like your table colors or fonts? Head over to the Global Settings!
Customization
For basic visualization instructions and customization, visit the Visualizations Overview support page. Continue reading for visualization-specific customization.
Adding Field Columns
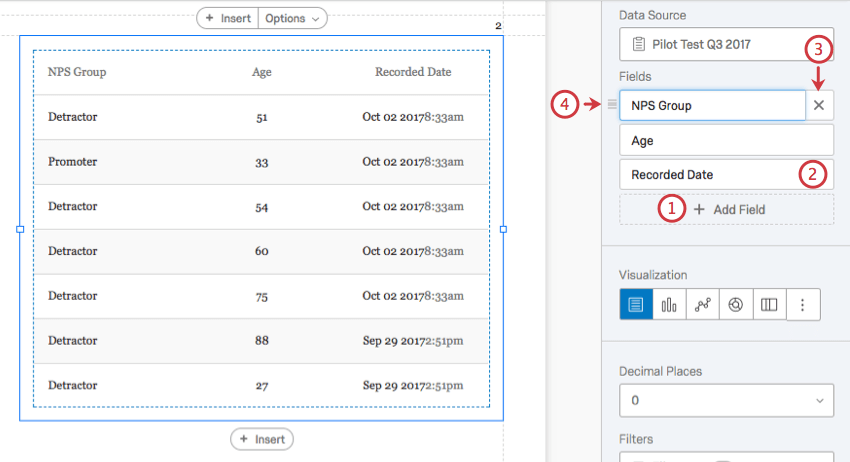
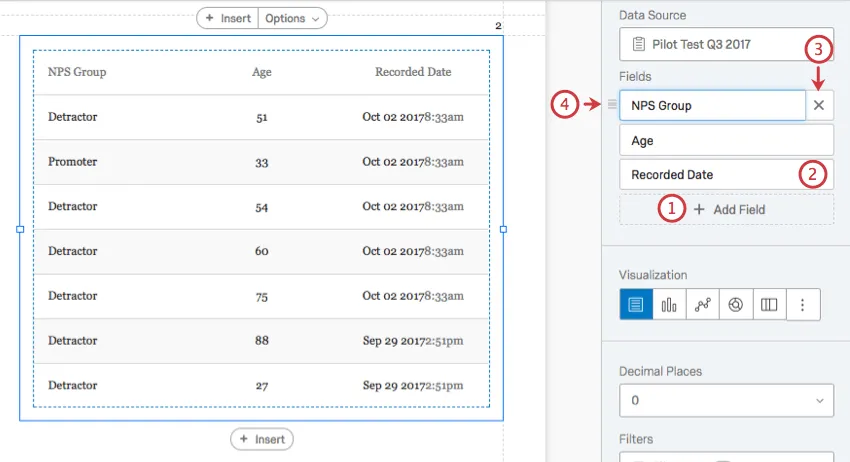
Instead of choosing one question as the source of your Results Table, you can add multiple fields that serve as data columns.
Qtip: Want the edited field to revert back to its default name? Just erase what you’ve written, and it’ll automatically go back to what is was before.
Sort by
Click the Sort By dropdown to change how the rows are sorted. You can only sort by columns you’ve inserted and dates.
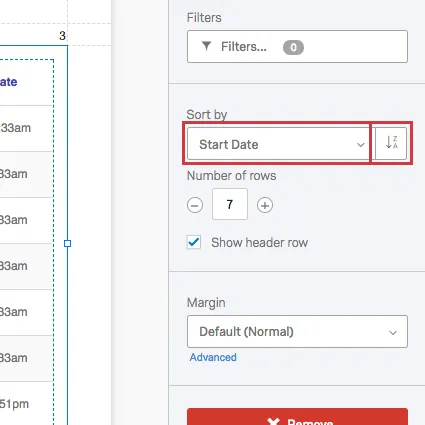
Reverse the sort by clicking the arrow button to the right.
Qtip: If you have Embedded Data or Manual Variables in date format, these will also appear in the Sort By dropdown!
Rows
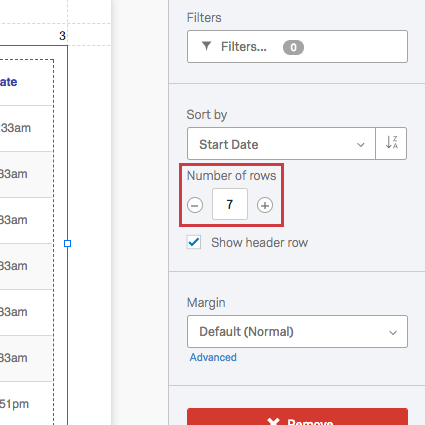
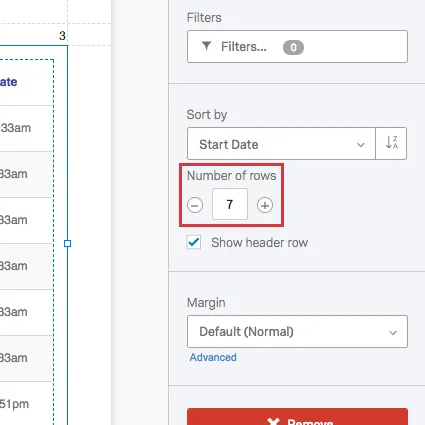
You can manually adjust the Number of rows the table displays by typing in the field or clicking the plus (+) and minus (–) buttons.
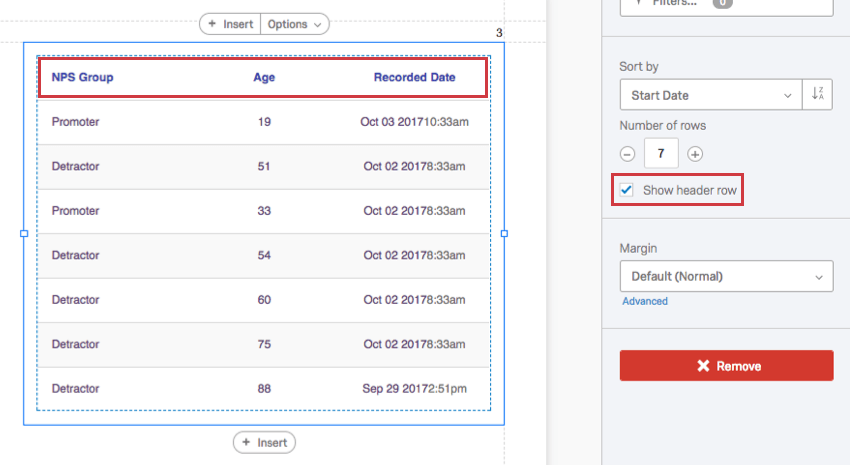
Include the first row of column headers by selecting Show header row. Deselect this option to hide it. Remember that you can edit the text of headers above, where it lists Fields.
Qtip: Want to create a title for your table? Try inserting a Text Area above it.
Table Cell Length
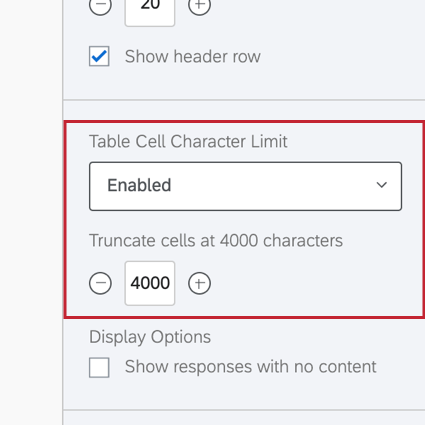
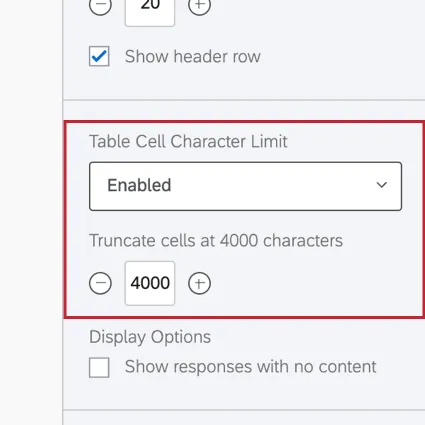
By default, your table cells will show the full cell values. However, you can decide to truncate your cell values using the Table Cell Character Limit option. After enabling this option, enter the desired character limit in the box below.
Hiding Empty Responses
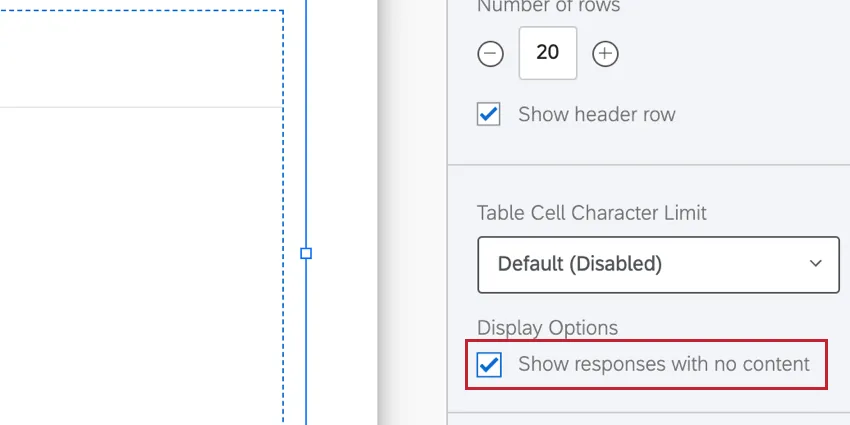
The Show responses with no content option is disabled by default. Responses that do not contain a value for your selected field will be automatically excluded from your results table. If you wish to display empty responses, then enable this option.
This option is only available for results tables containing one field. If your results table contains multiple fields, then this option will be hidden.
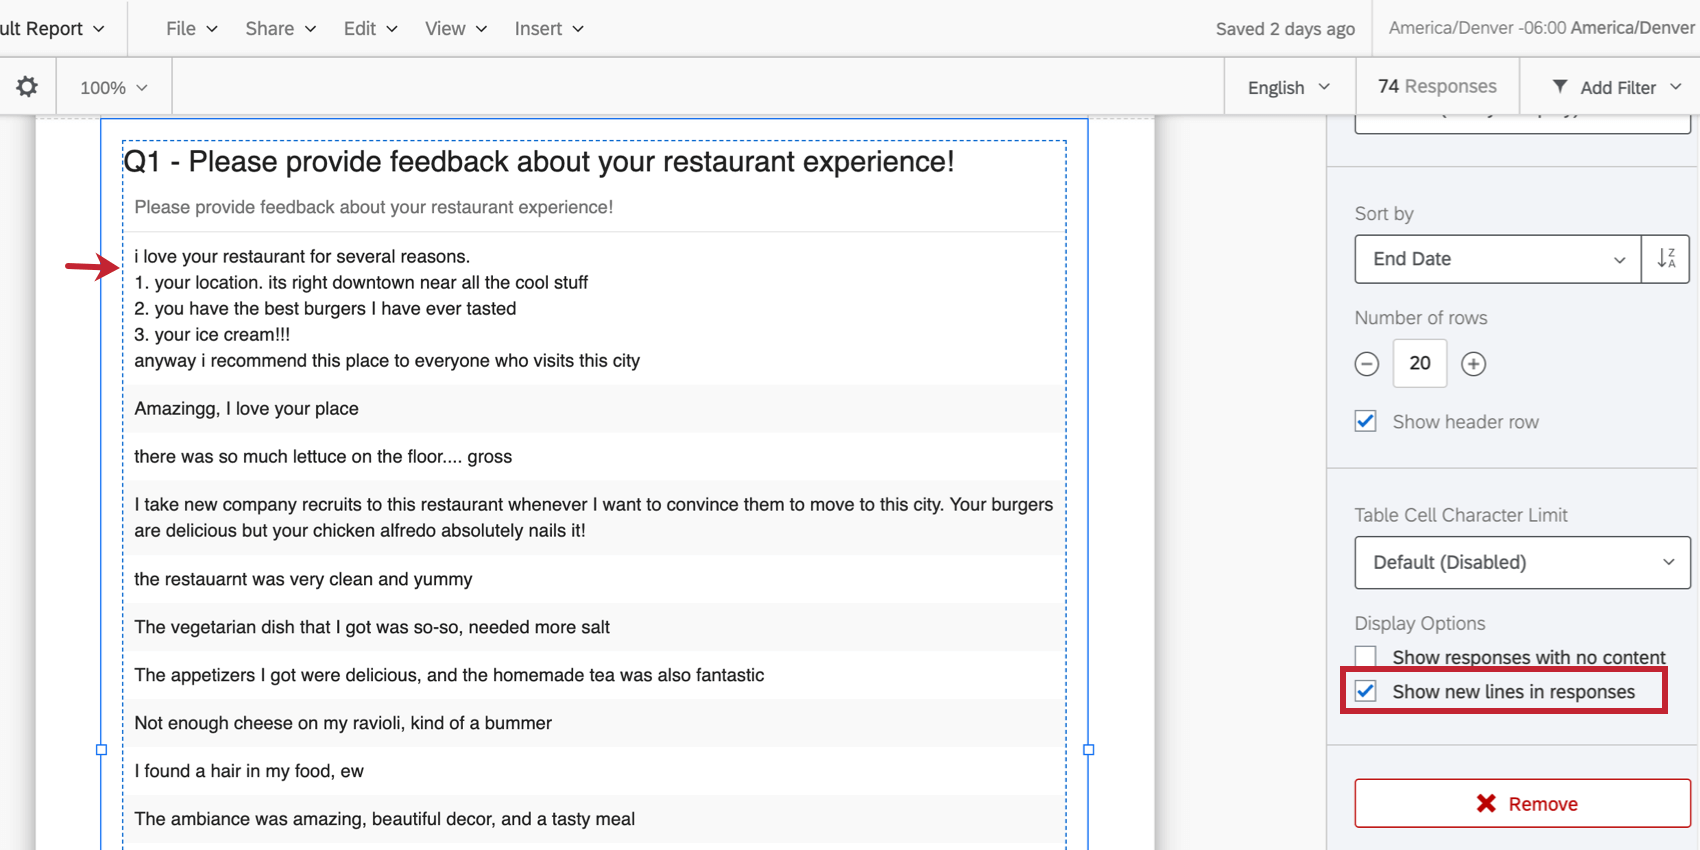
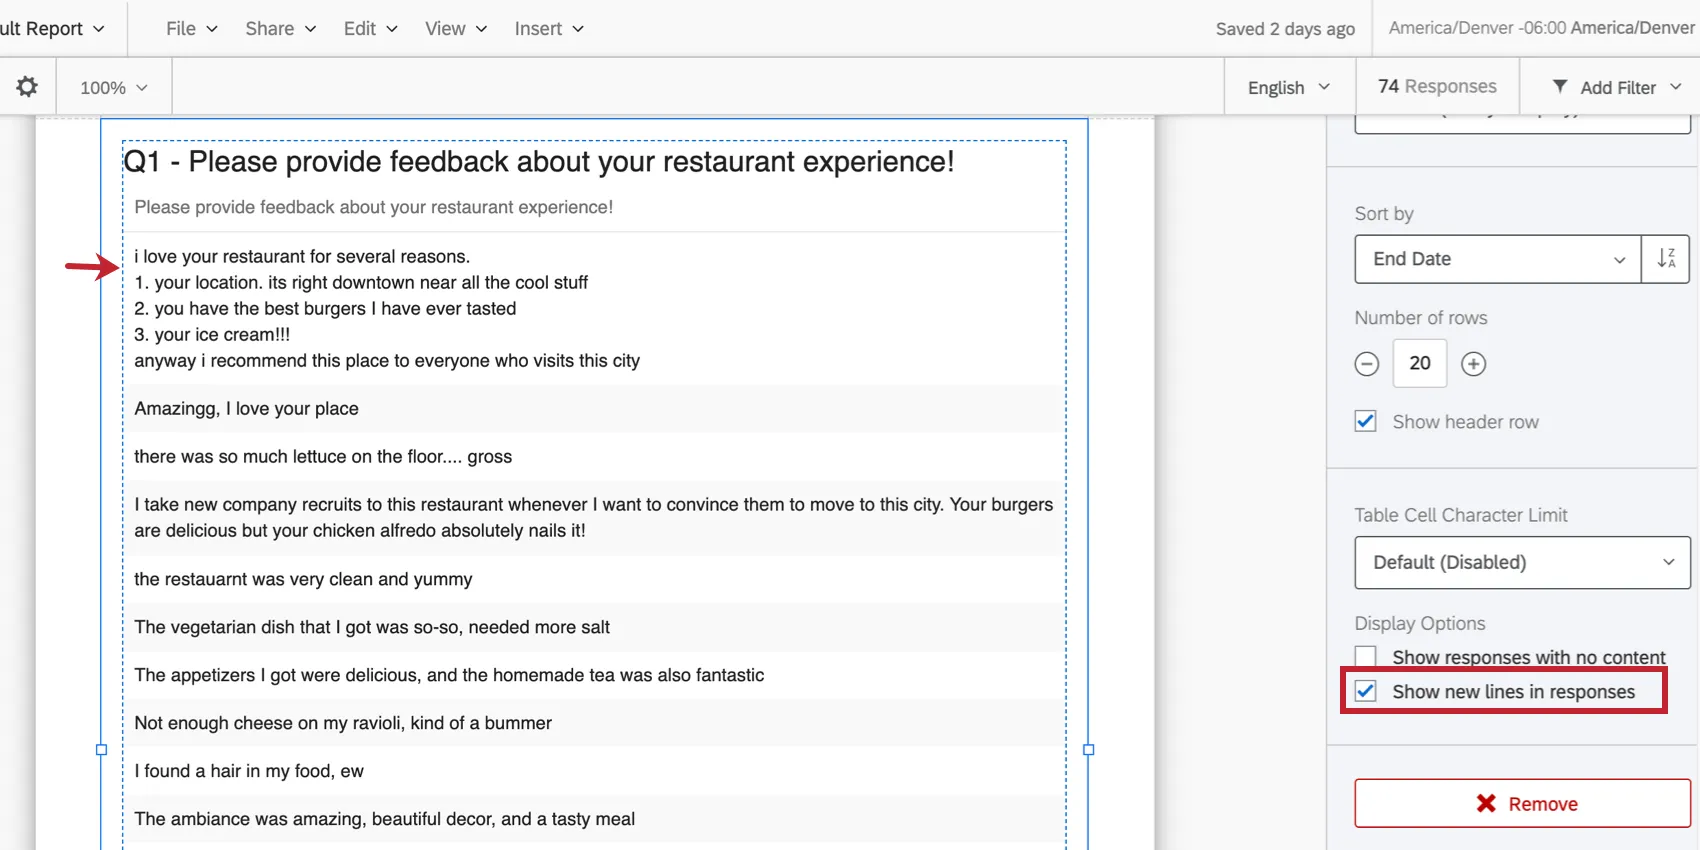
Show line breaks in responses
Some open-ended feedback formats, like essay, allow respondents to add line breaks to their responses. By default, these line breaks are displayed in responses added to results tables. If you’d like to enable or disable this option, use the Show new lines in responses checkbox.
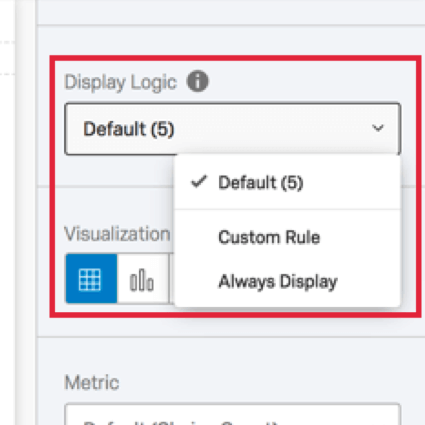
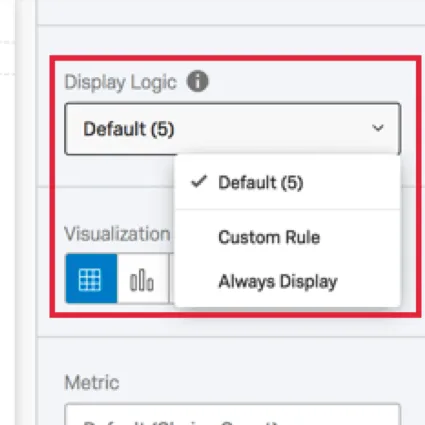
Rater Category Display Logic
This feature is only available for results table visualizations in 360 subject reports. If you’ve created a rater group filter, you can add it to your widget by clicking Display Logic and choosing your filter.
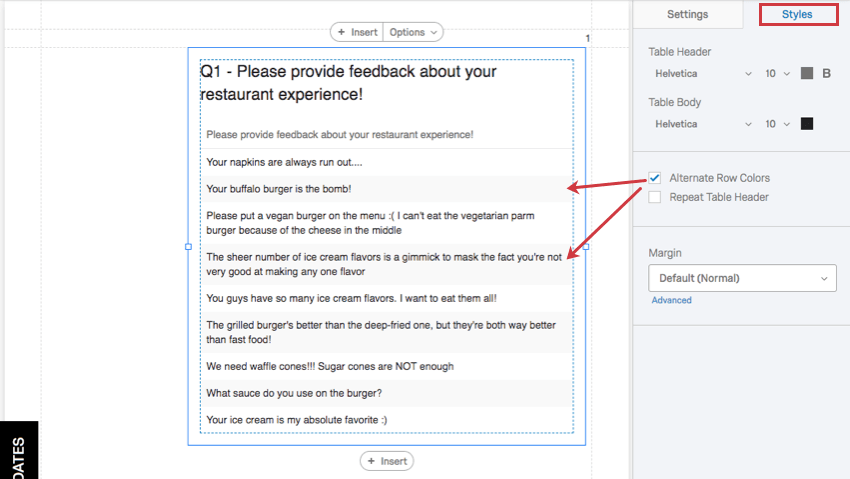
Styles
Select the Styles tab to modify table header and body fonts.

Select Alternate Row Colors to shade every other row and make them easier to read.
Selecting Repeat Table Header will make sure that the header row (not the title) will repeat as the table gets much larger and has many rows.
Use Margin to adjust the table’s margins.
Compatibility
Results Tables are compatible with all question types, custom variables, survey metadata, and Embedded Data options.
Results tables can be used in survey advanced-reports, 360 reports, and employee report templates.
FAQs
Can I add other columns of information to my visualizations?
Can I add other columns of information to my visualizations?
In the visualization editing pane for either visualization, you will be able to select Add Additional Columns.
No other visualization can add additional columns like this.
That's great! Thank you for your feedback!
Thank you for your feedback!