
Digital Open Door
What's on this page
About the Digital Open Door
During times of crisis and extreme change, keeping communication lines open with your customers is critical. Combined with the accelerated digital transformation driven by COVID-19, any websites or apps you company runs are critical touchpoints with your customers. Quickly stand up a digital open door to ensure customers always have an open, two-way line of communication.
This solution consists of the following, developed by CustomerXM people scientists:
- A pre-written survey
- A pre-written email task that triggers to your support team
- A Website Feedback project with digital touchpoints
- A custom dashboard
Qtip: This project involves the deployment of intercepts onto your company website. You will need to be in contact with your IT or web development team for certain steps of this project. We recommend using a Tag Manager to expedite the deployment if you have one already.
Qtip: If you don’t currently have access to the Digital Open Door and are interested in learning more, check out this page for more details.
Creating a Digital Open Door
Qtip: This XM Solution is only available in English, and you will only be able to make this project if your account language is set to English. However, you can upload translations or auto-translate using Google Translate for content as needed. See FAQs for more details.
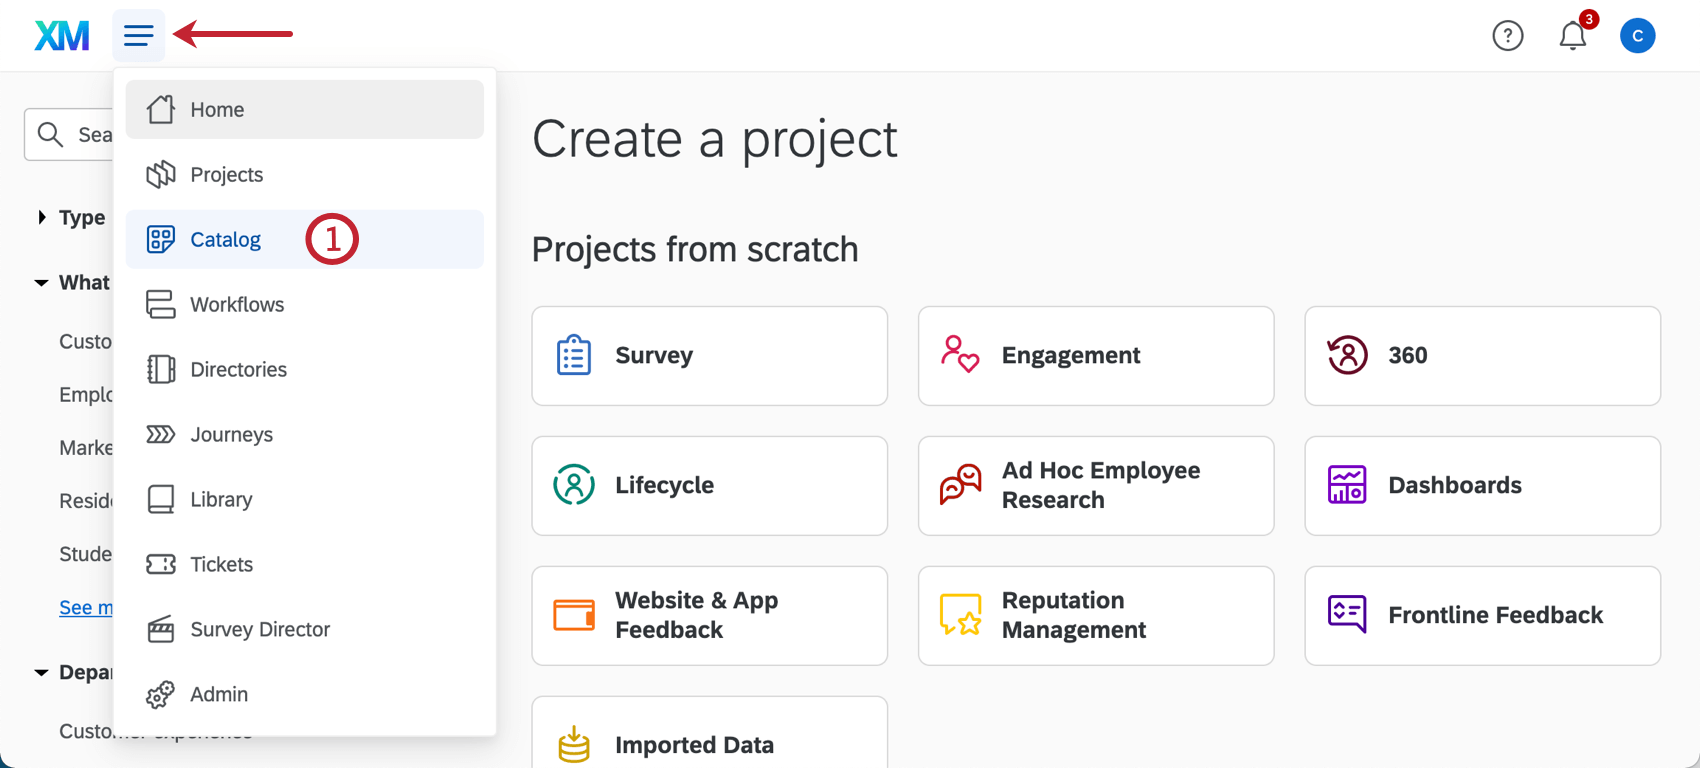
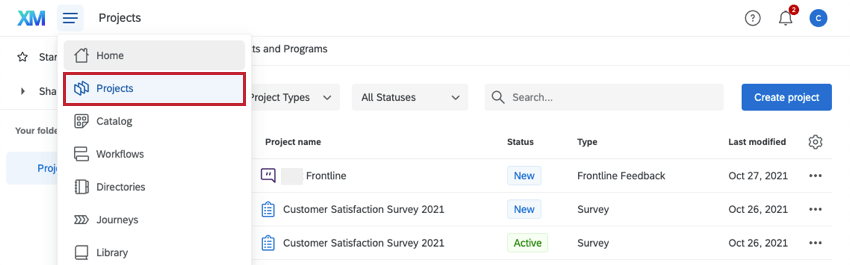
Qtip: A project can also be created from the Projects or Homepage.
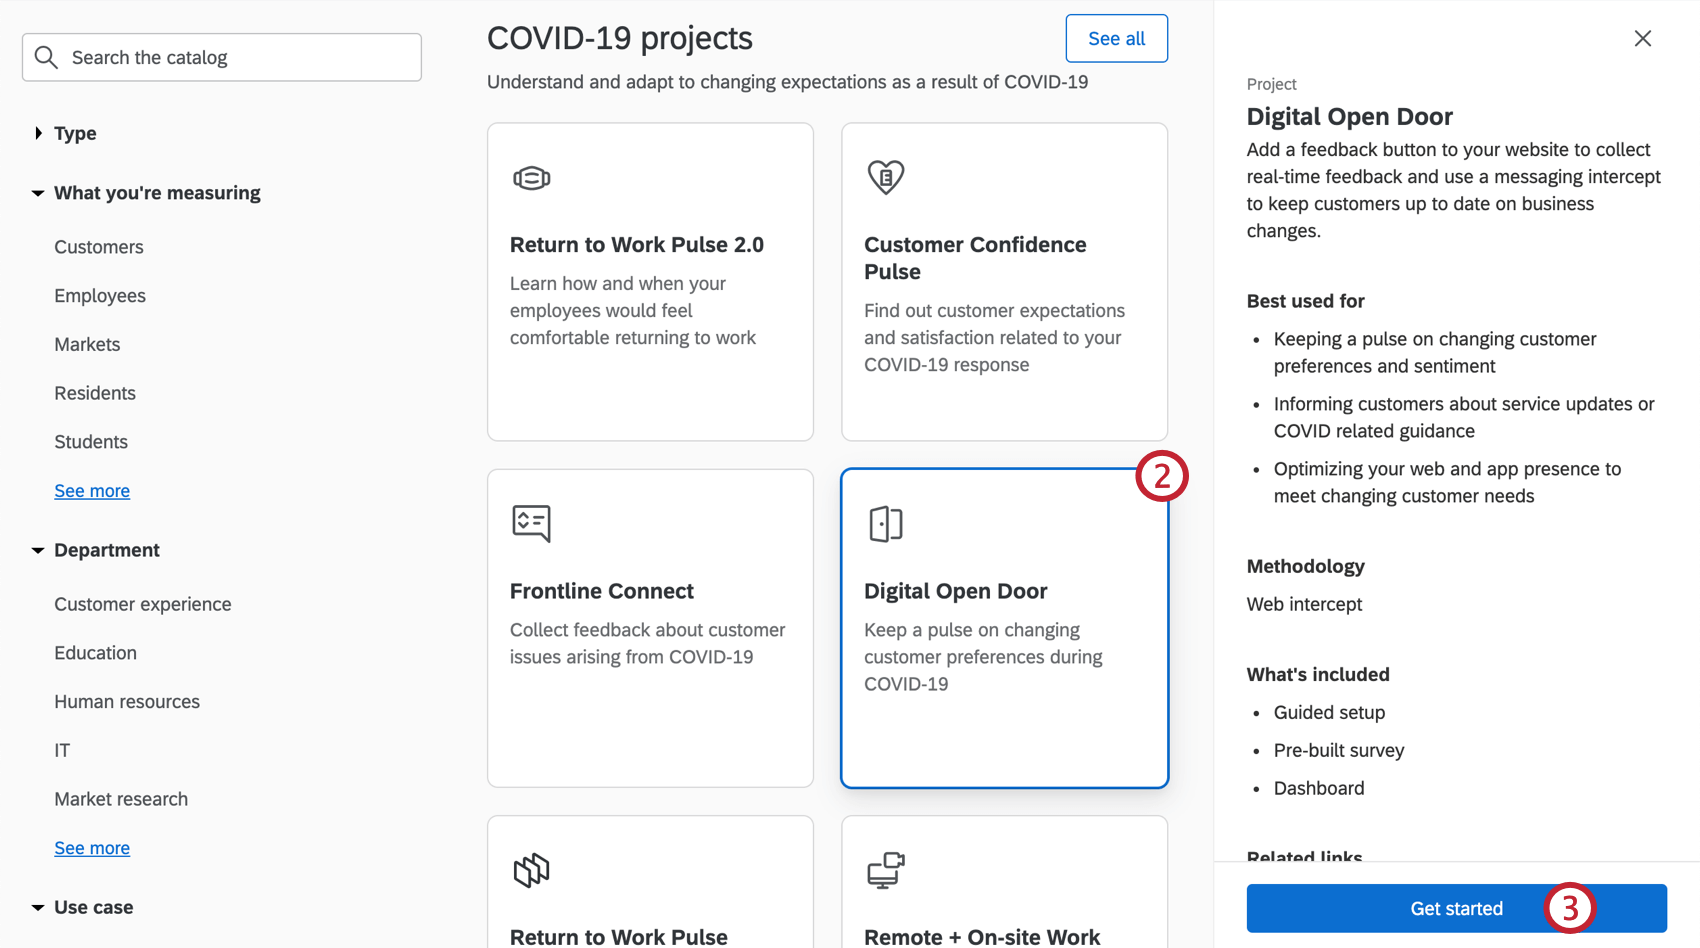
Qtip: You can also use the search in the catalog to find this project.
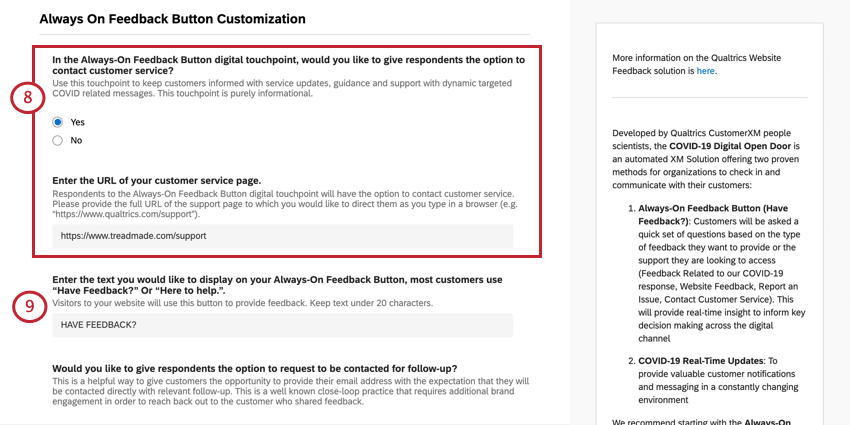
Qtip: Although you can edit the color and text, this button will look like the Feedback button in gray on the right side of this support page.
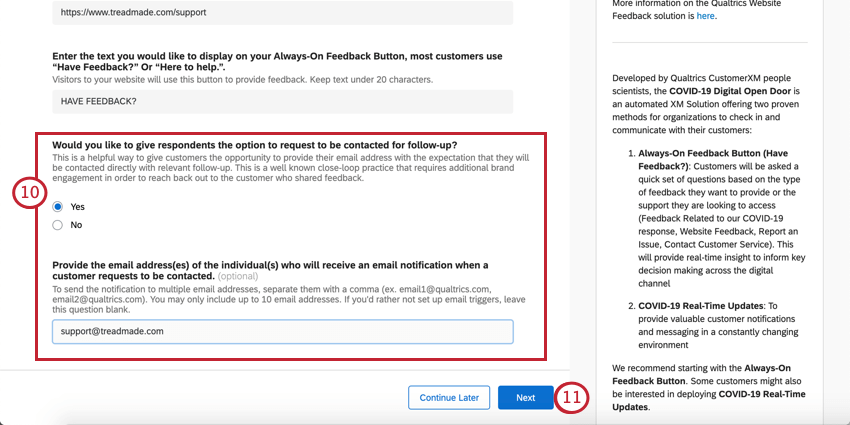
Qtip: You can add up to 10 email addresses, comma-separated.
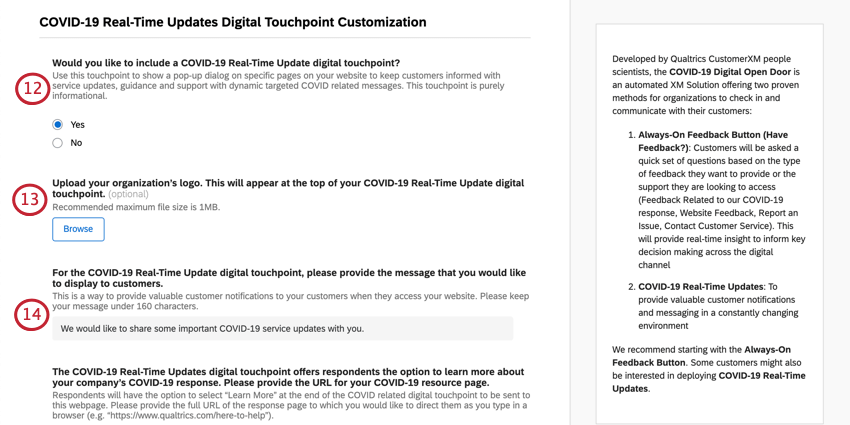
Qtip: This will make the logo appear on your website Creatives.
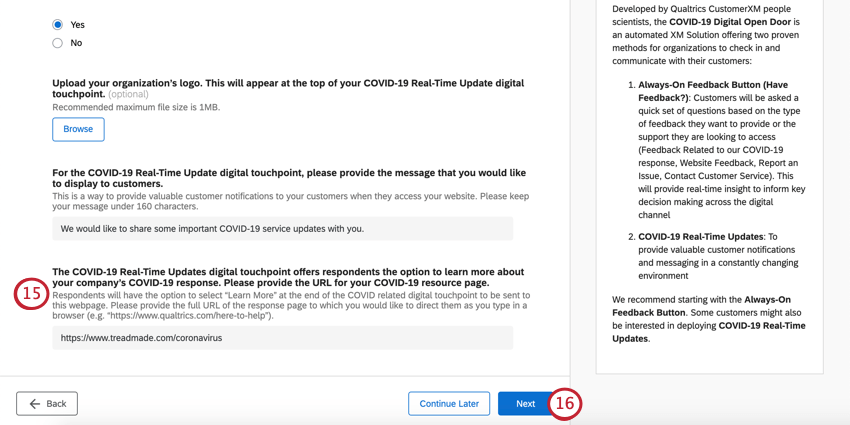
Example: “We would like to share some important COVID-19 service updates with you.” This line is meant to be short because it will be accompanied to a link for more information.
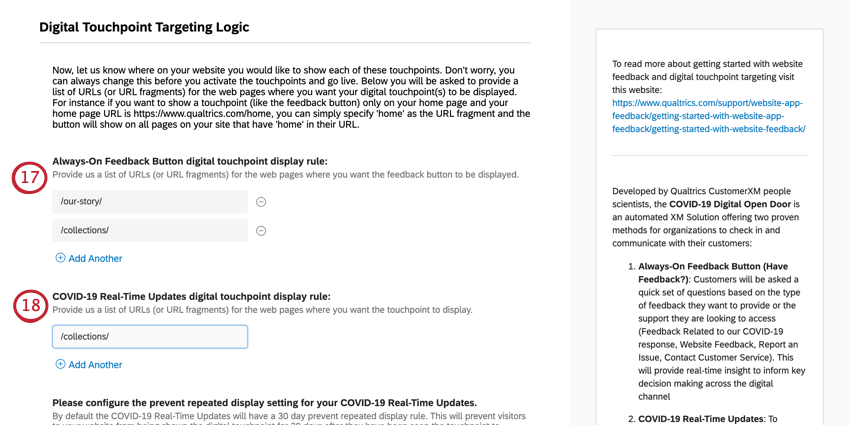
Example: If you want to show a touchpoint (like the feedback button) only on your home page and your home page URL is https://www.qualtrics.com/home, you can simply specify “home” as the URL fragment and the button will show on all pages on your site that have “home” in their URL.
Qtip: Don’t worry, you can always change this before you activate the touchpoints and go live.
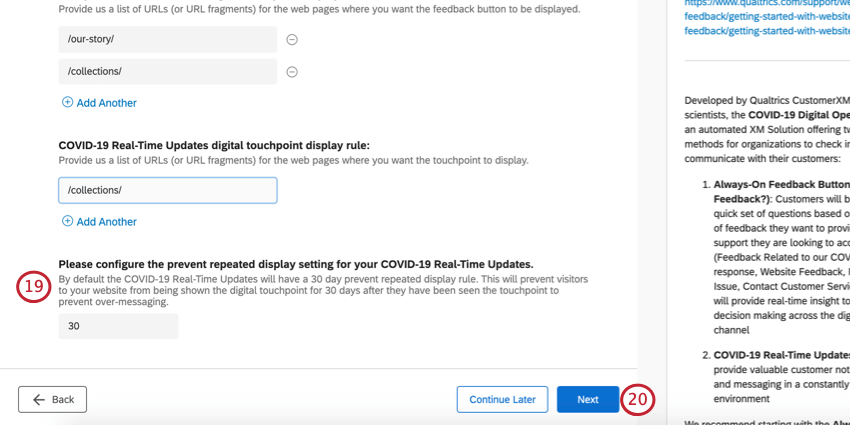
Qtip: The purpose of this setting is to prevent the same website visitors from being over-surveyed and over-messaged.
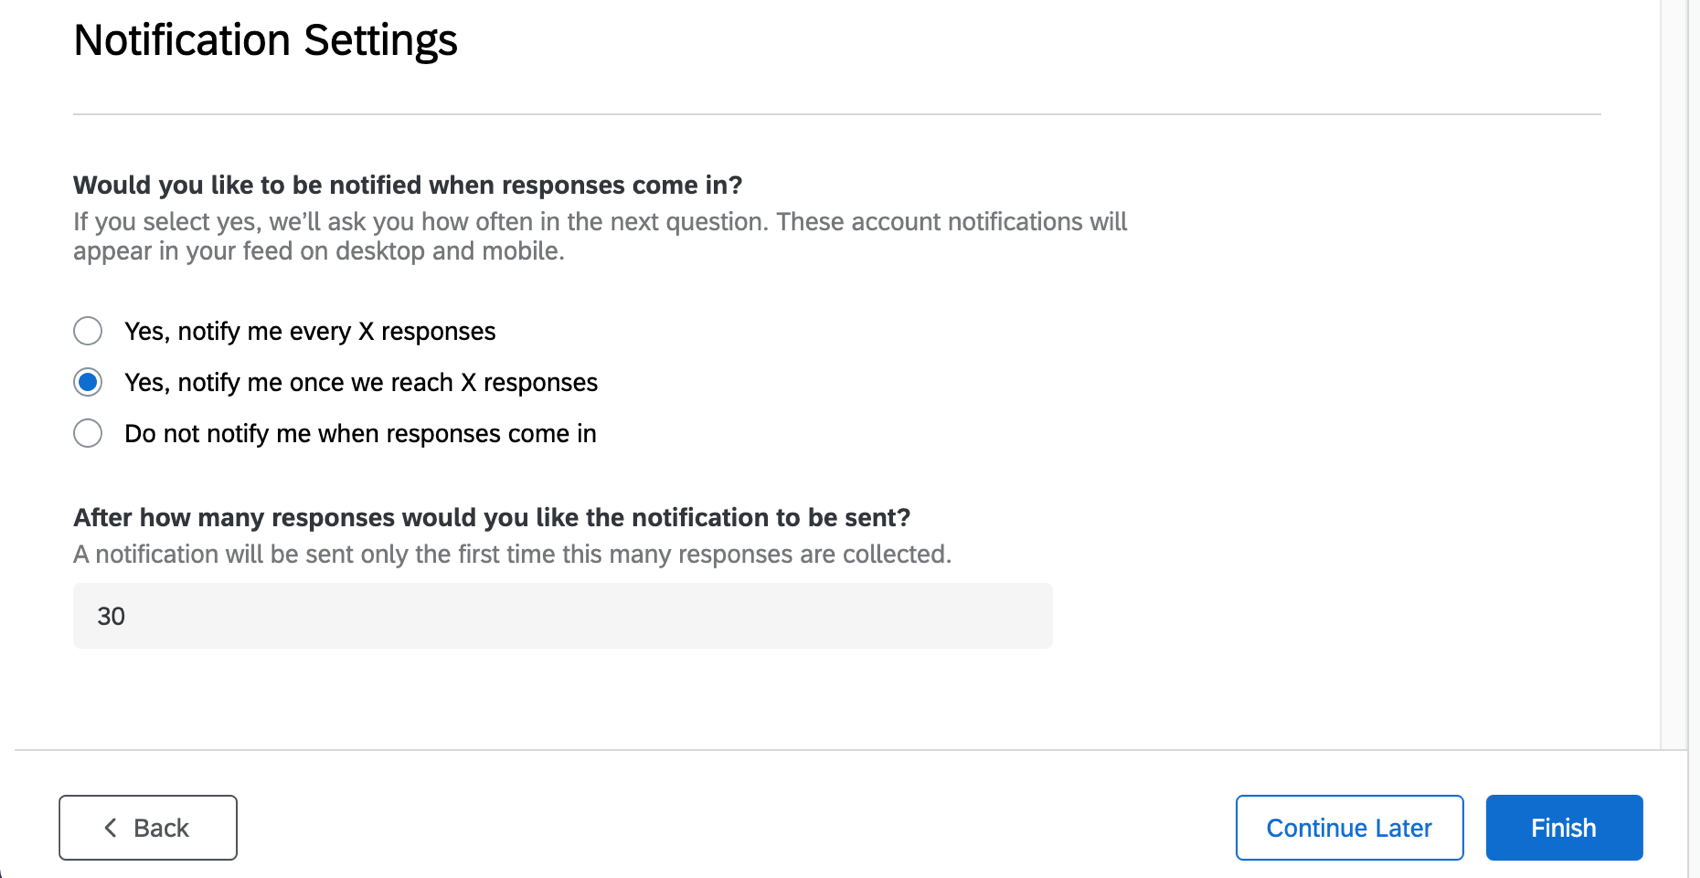
- Yes, notify me every X responses Example: Get notified for every 50 responses you receive, so you don’t get a notification for every response.

- Yes, notify me once we reach X responses Example: Get a notification once you reach 150 responses, total.
- Do not notify me when responses come in
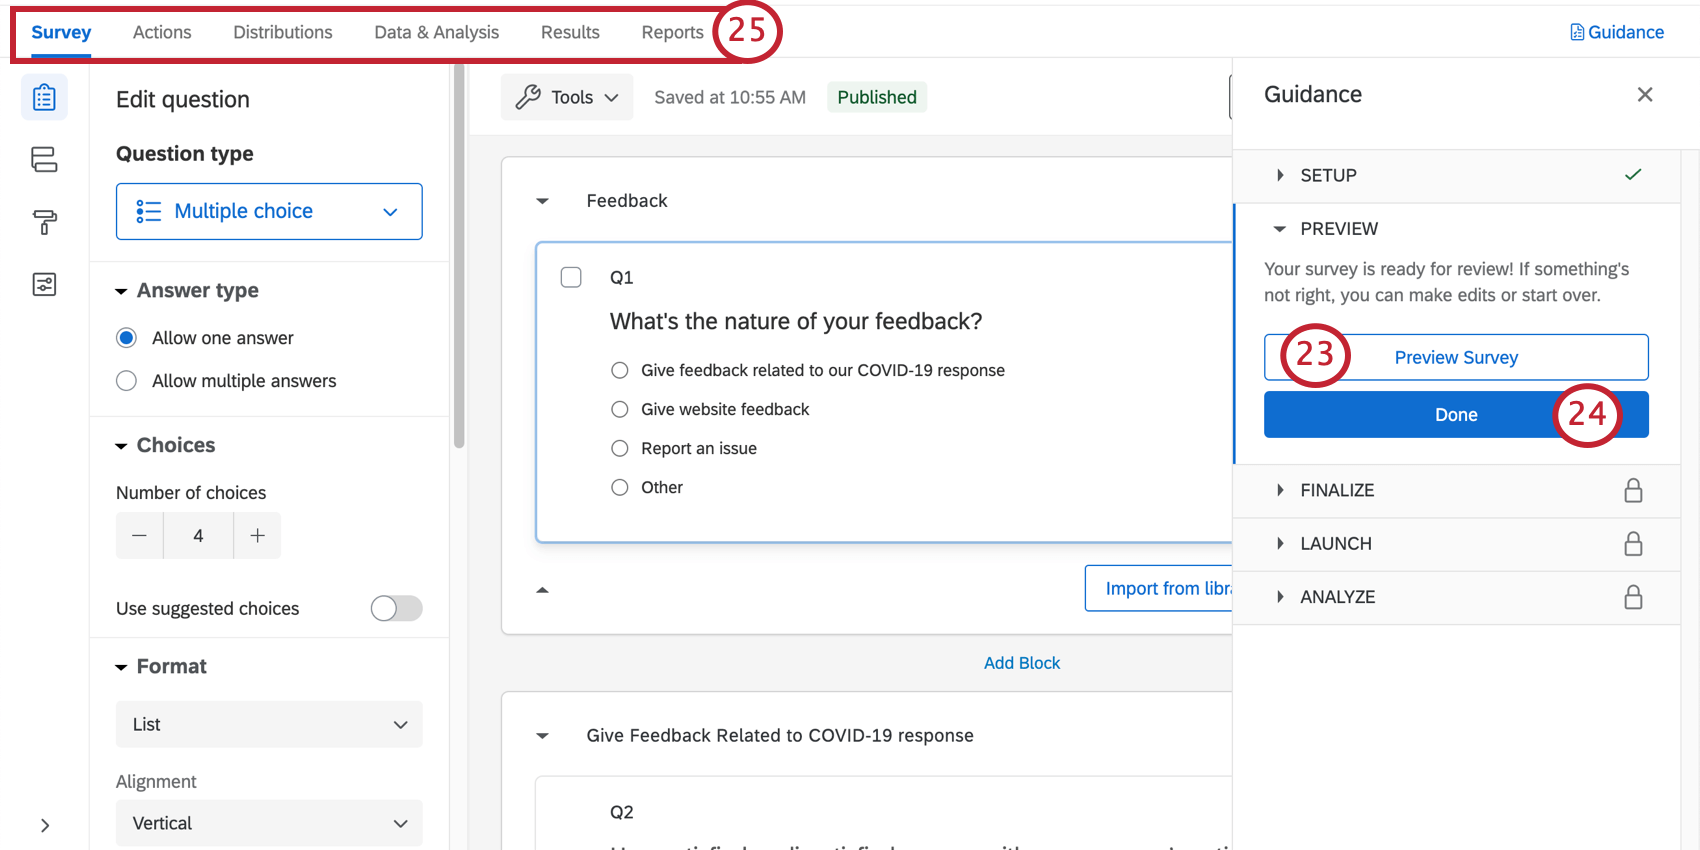
Qtip: Did your survey Preview not appear? Make sure your browser doesn’t block pop-ups on Qualtrics.
Digital Open Door Survey Customization
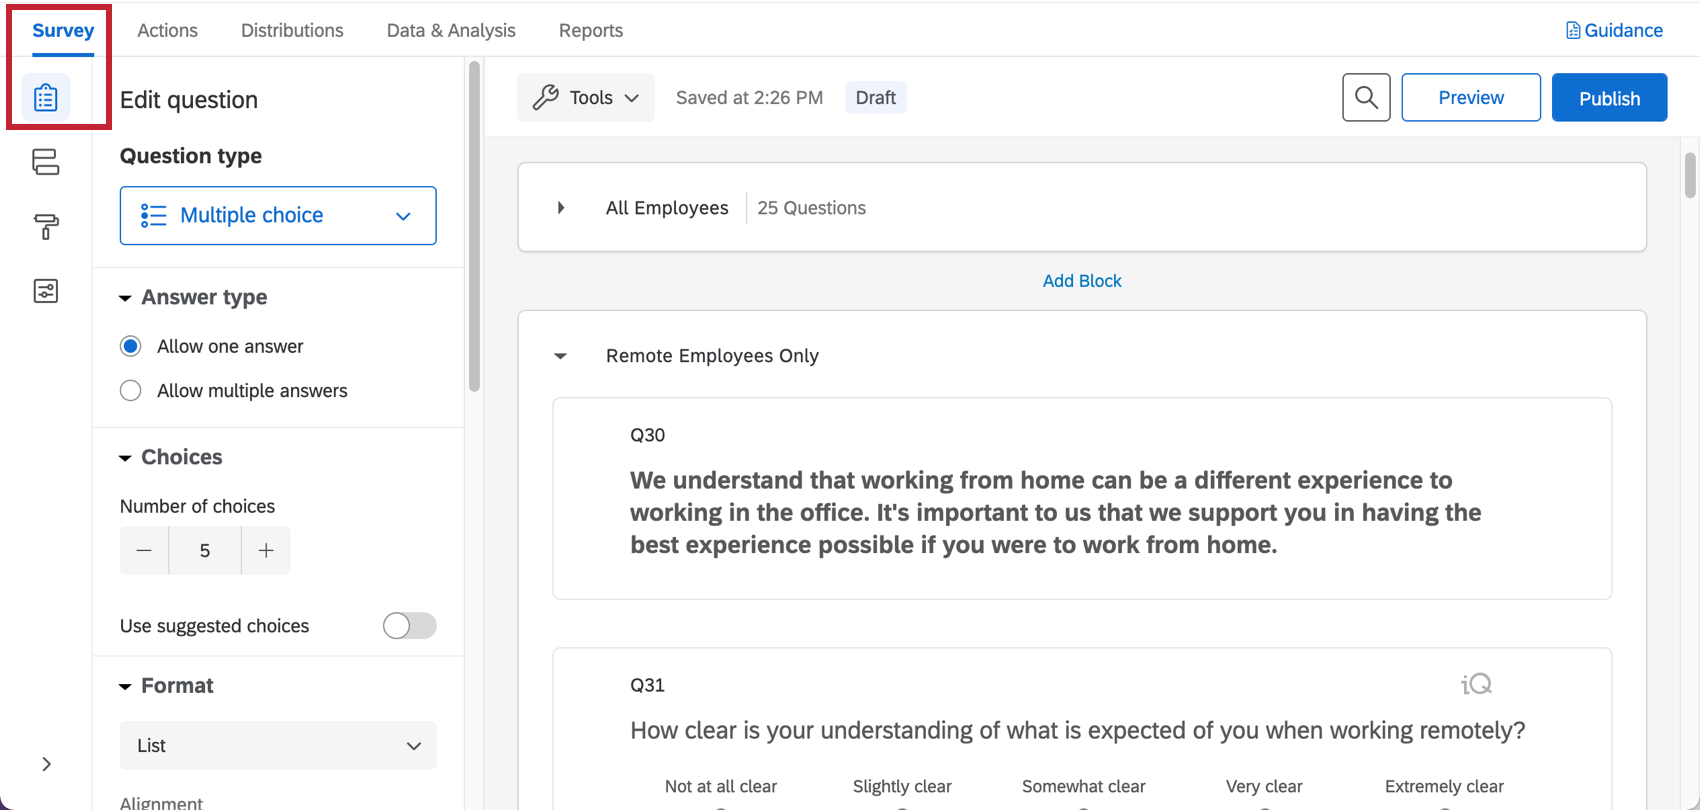
If you want to see the questions in your survey or edit them, click the Survey tab. Once inside the survey builder, you can add new questions, tweak the wording on existing ones, edit the survey theme, and much more.
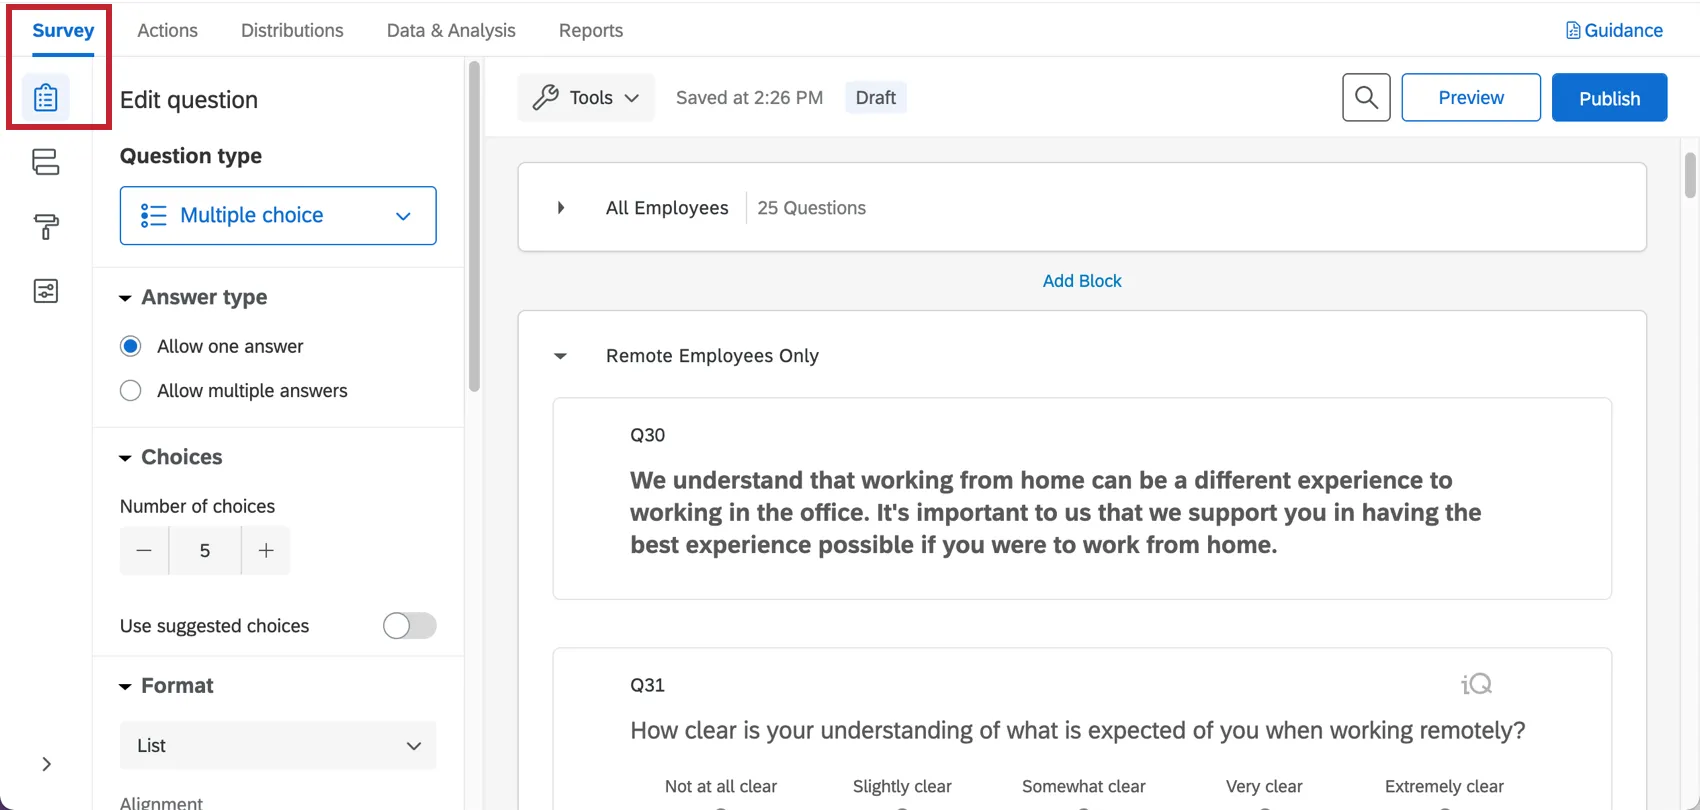
If there’s particular functionality you’d like to add, try searching the Support Site, or use the Support Site’s menu to the left to pick a page. In this section, we’ll cover some of the fundamentals of survey editing.
Qtip: The questions included in this survey were developed by our top subject matter experts. We advise trying to keep your survey as similar to the original template as possible, and not making too many large-scale changes.
Adding and Editing Questions
Warning: It’s important to make edits to the survey before you distribute it to customers. If possible, avoid making edits to a survey actively collecting data, or you may risk invalidating your data and changing the premade reports that come with this solution. See Testing / Editing an Active Survey.
You can add as many additional questions as you want. However, keep in mind that the shorter the survey, the more likely customers are to fill it out.
For guides to adding and editing questions, see:
- Creating Questions
- Formatting Questions
- Formatting Answer Choices
- Question Types
- Screen Capture Question
Qtip: For surveys like these, we generally advise sticking to multiple choice and text entry questions.
Qtip: For any questions or fields you add after the survey’s setup, you will need to manually add this content to the dashboard by mapping the field and then adding to the desired widgets / dashboard pages.
Warning: If you change the order of survey content or majorly change questions, this can negatively impact the branch logic in the survey flow, and thus how certain embedded data are recorded. Do not make major edits to the order of questions or blocks in your survey unless you are absolutely sure and have tested how this will impact your data collection. To restore older versions of your survey flow, see Survey Publishing & Versions.
Deleting and Restoring Questions
Warning: If you delete a question, it’ll affect the premade dashboard included with this solution! Be prepared to either make edits to dashboard widgets or create new data fields and widgets from scratch.
If you have sent a question to the trash, it is possible to restore it. To roll back many changes at once, see also how to revert a survey back to a previous version.
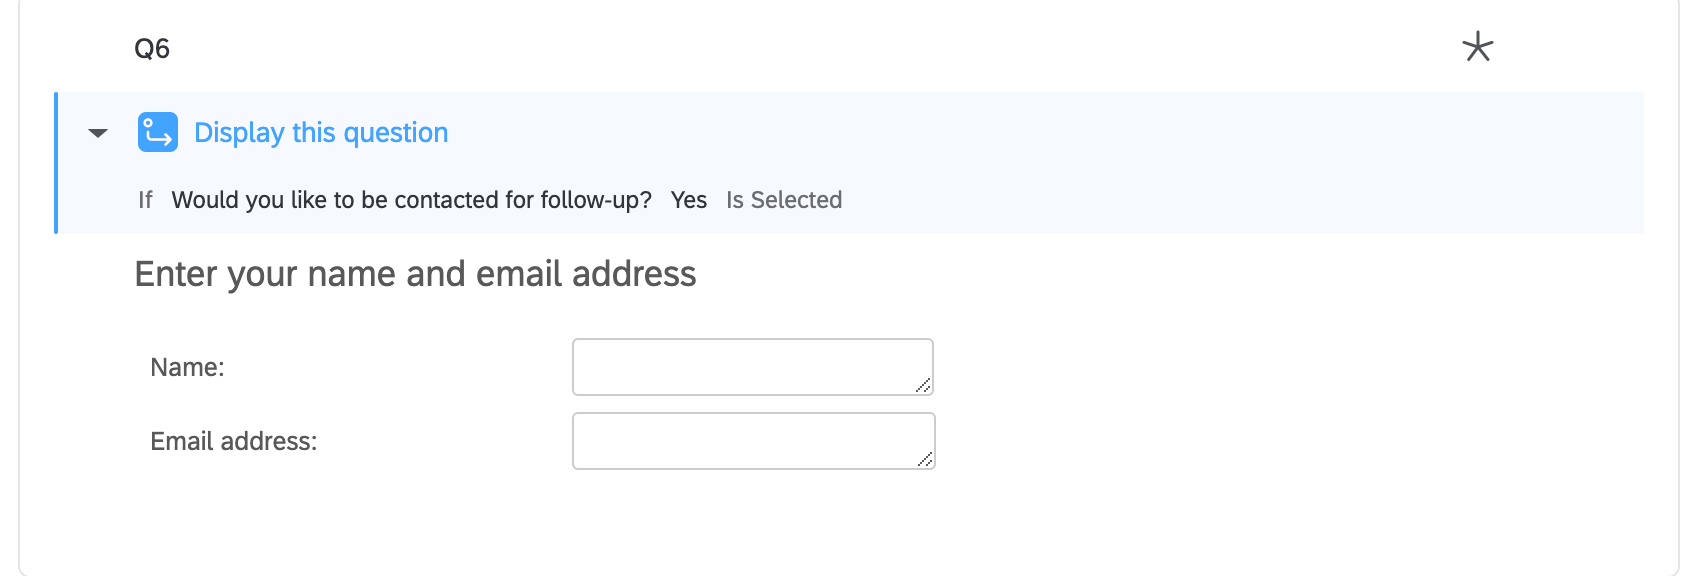
Display Logic
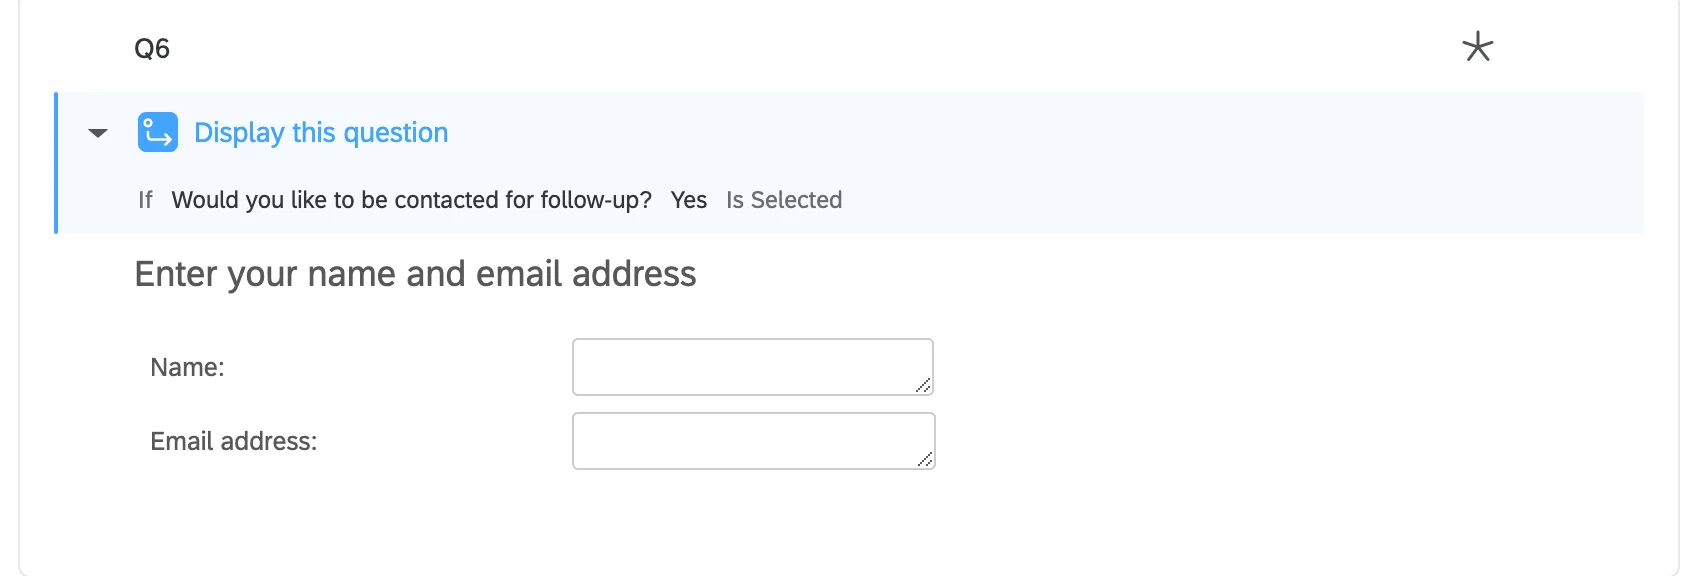
This solution comes with custom display logic. Display logic affects what questions respondents see, based on previous answers they provided. For example, we can ask whether a customer would like to be contacted for follow up, and then only request their contact information if they say yes.
Warning: When you remove or edit a question, it can affect display logic on another question. Be sure to double-check your survey before making these edits!
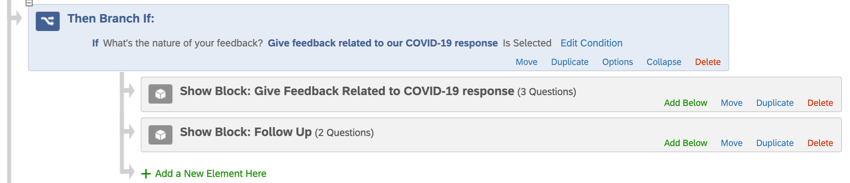
Survey Flow
The survey flow is where you customize the order in which respondents experience the elements of your survey. As the name suggests, it’s where you determine the “flow” of your survey. Here, you will find a few different elements.
In the survey flow, you’ll find an embedded data element at the top. This element helps organize your data for reporting and for use in your digital touchpoints. For example, the DeviceType will record whether the respondent reached your website from desktop or mobile.
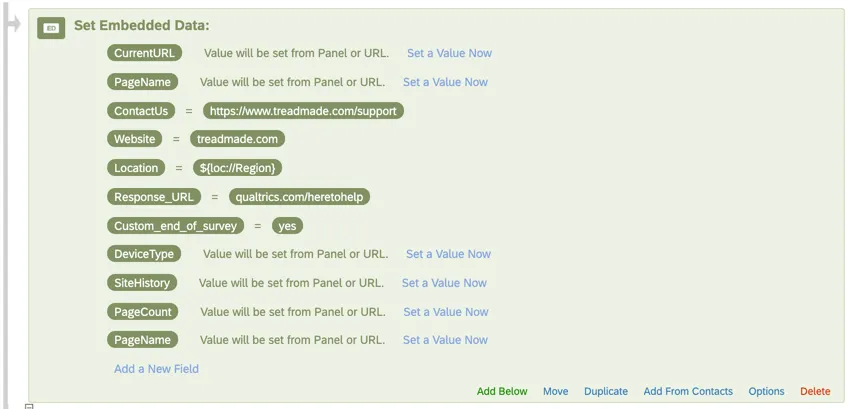
Warning: This element should remain at the top of the survey flow. Deleting or moving it can affect how this data is saved in survey responses.
Branch logic allows you to hide or show entire groups of questions based on answers respondents gave earlier in the survey. Please do not remove or edit this element without paying close attention to the question the logic is based off of and the block of questions the branch logic is controlling.
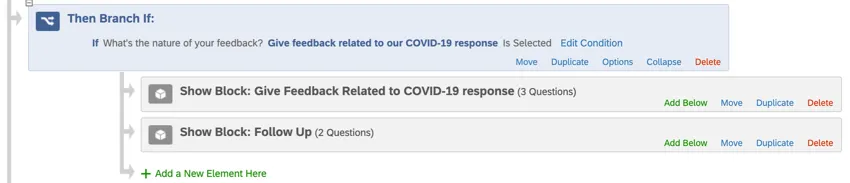
Warning: When you remove or edit a question, it can affect branch logic on another question. Be sure to double-check your survey before making these edits!
Saving and Publishing
All edits you make are saved automatically; however, they won’t necessarily be pushed to the live version of the survey. When you are finished with all of your edits and are ready to generate a link and share the survey with your customers, remember to click Publish in the upper-right.
For more on how this works, see Survey Publishing & Versions.
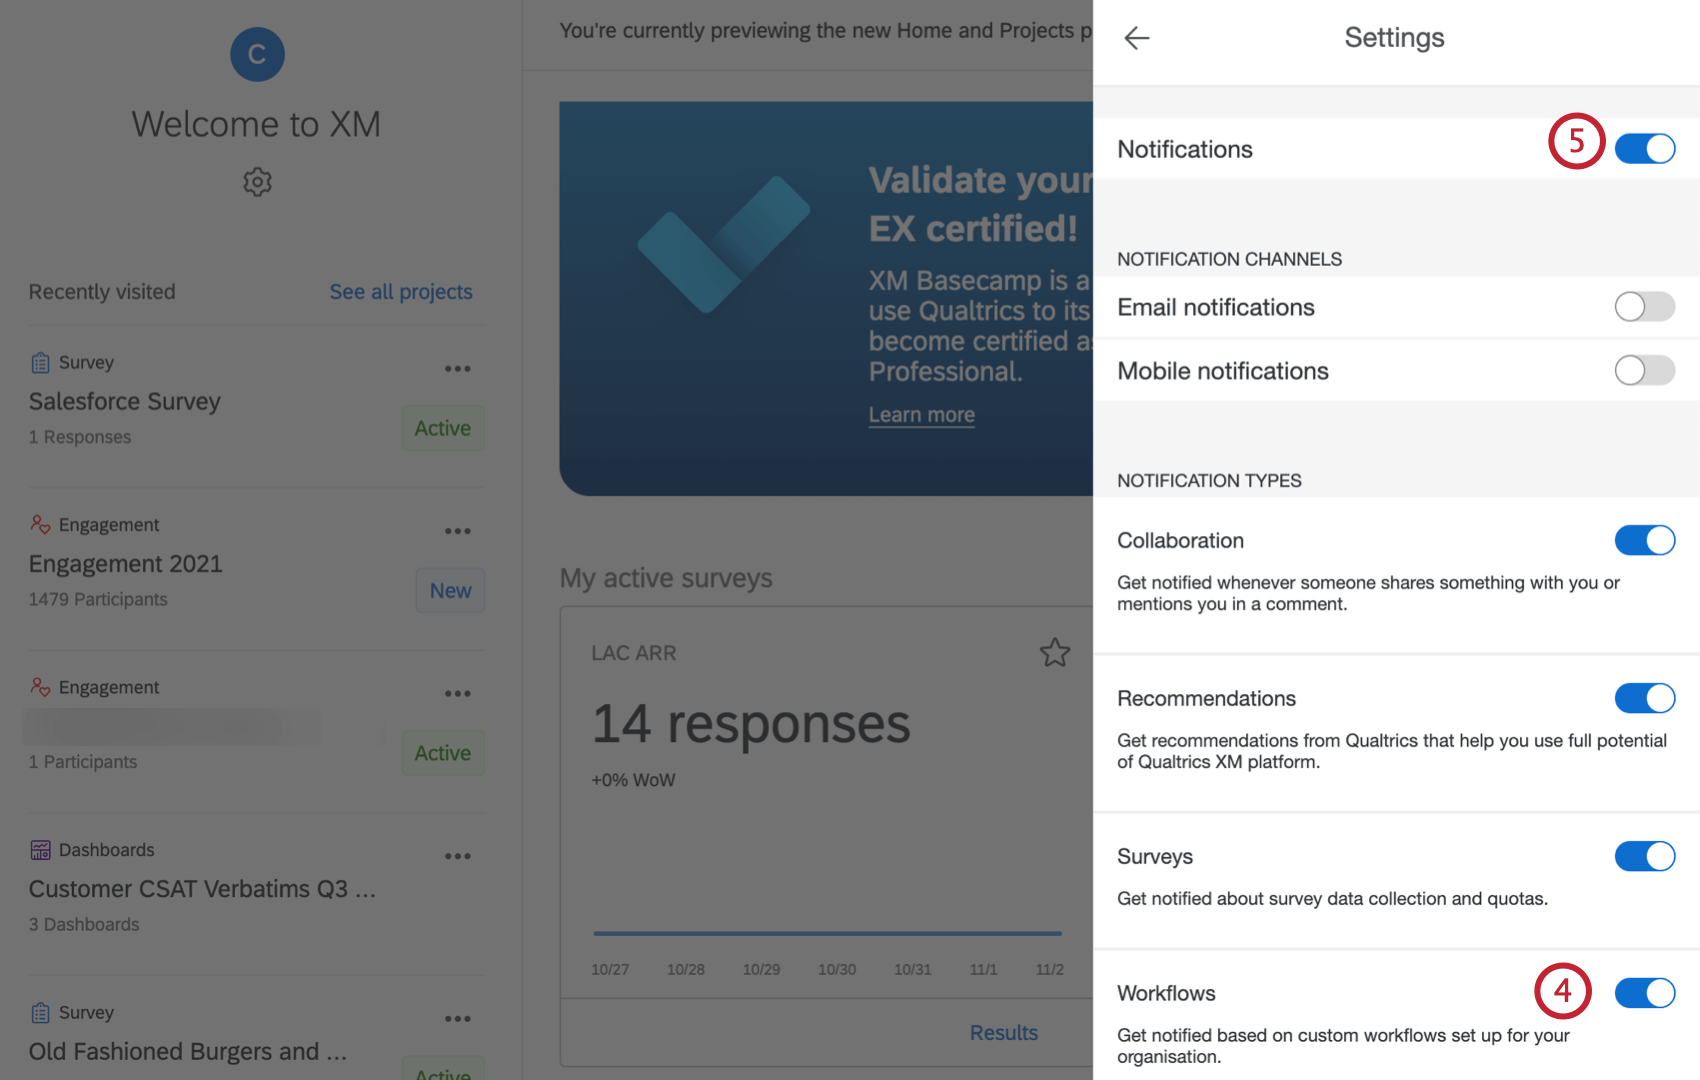
Pre-Configured Workflows
Your Digital Open Door comes with items already set up in the Workflows tab. This means that during the project’s setup you did one of the following:
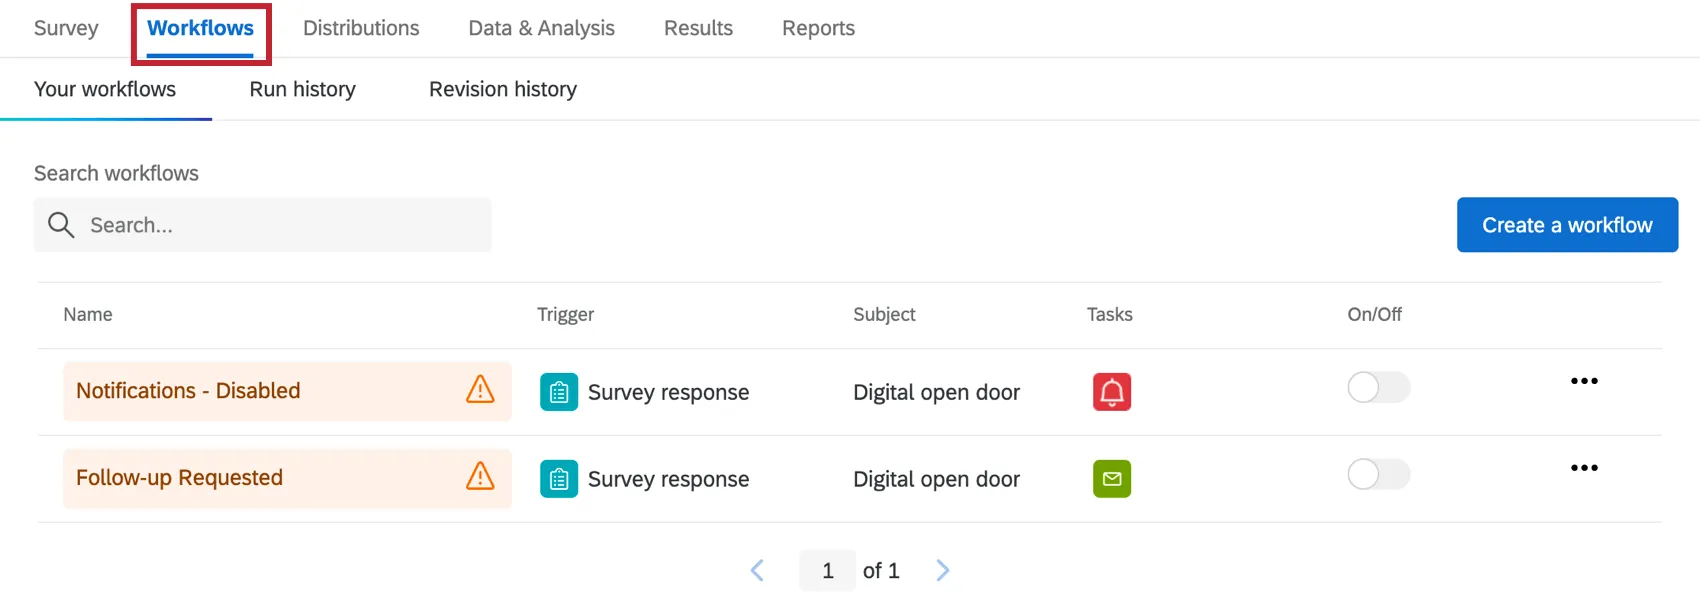
As needed, you can either review or edit:
- Who receives the notification
- The conditions under which the condition are sent
- The message included in the notification
Qtip: Once you’ve configured the tasks as desired, make sure they are enabled.

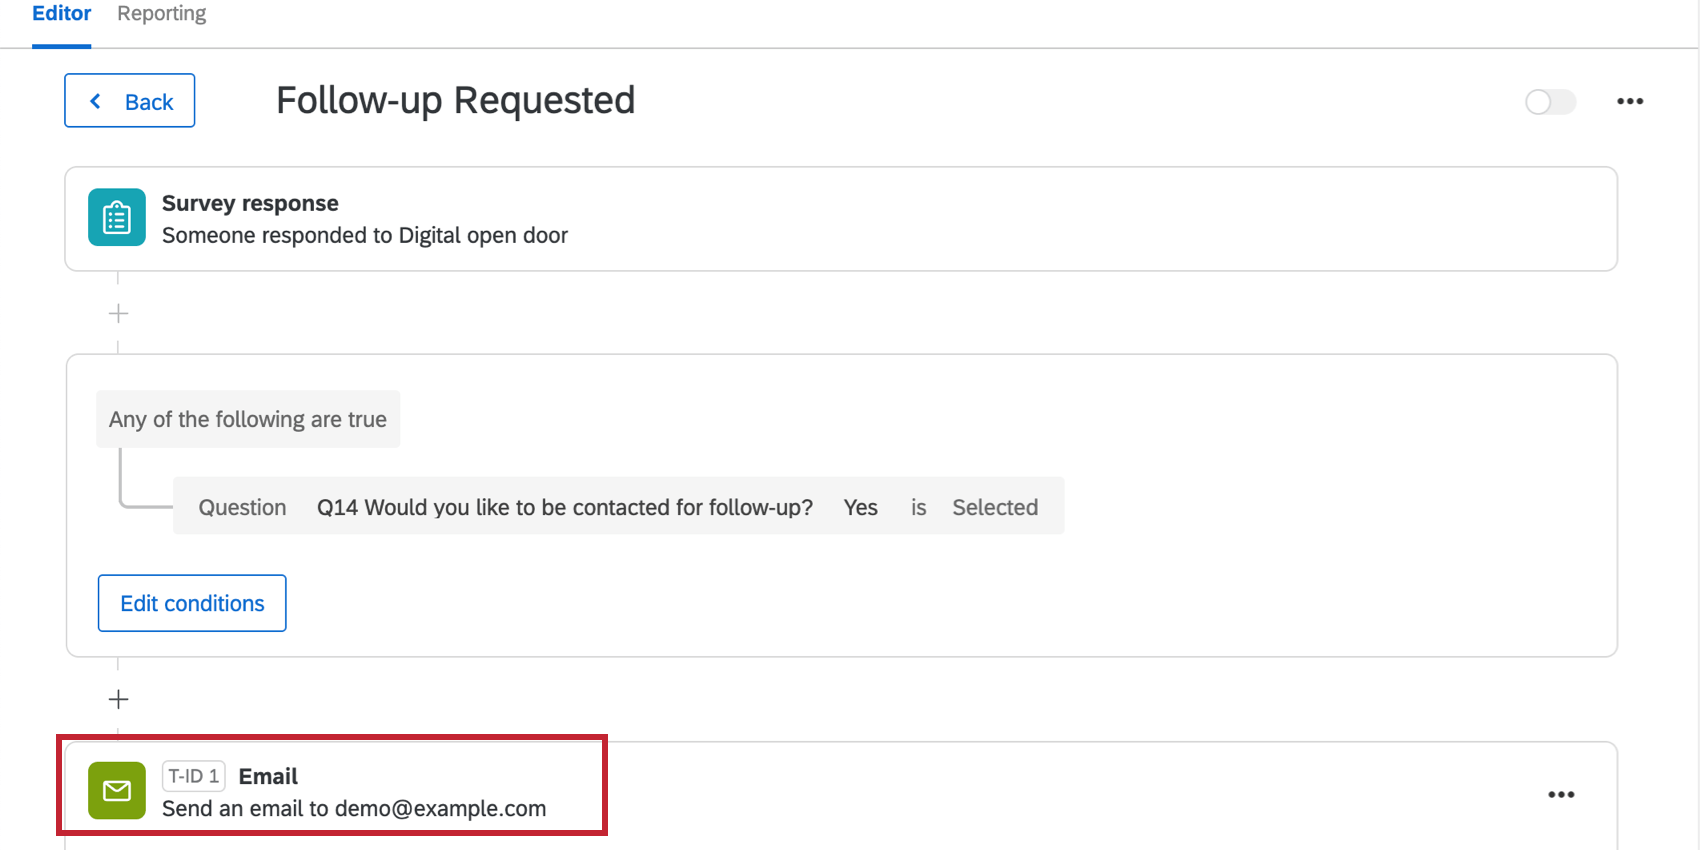
About the “Follow Up Requested” Workflow
The Customer Feedback Notification will only be sent if the customer indicated that they want to be contacted for a follow-up.
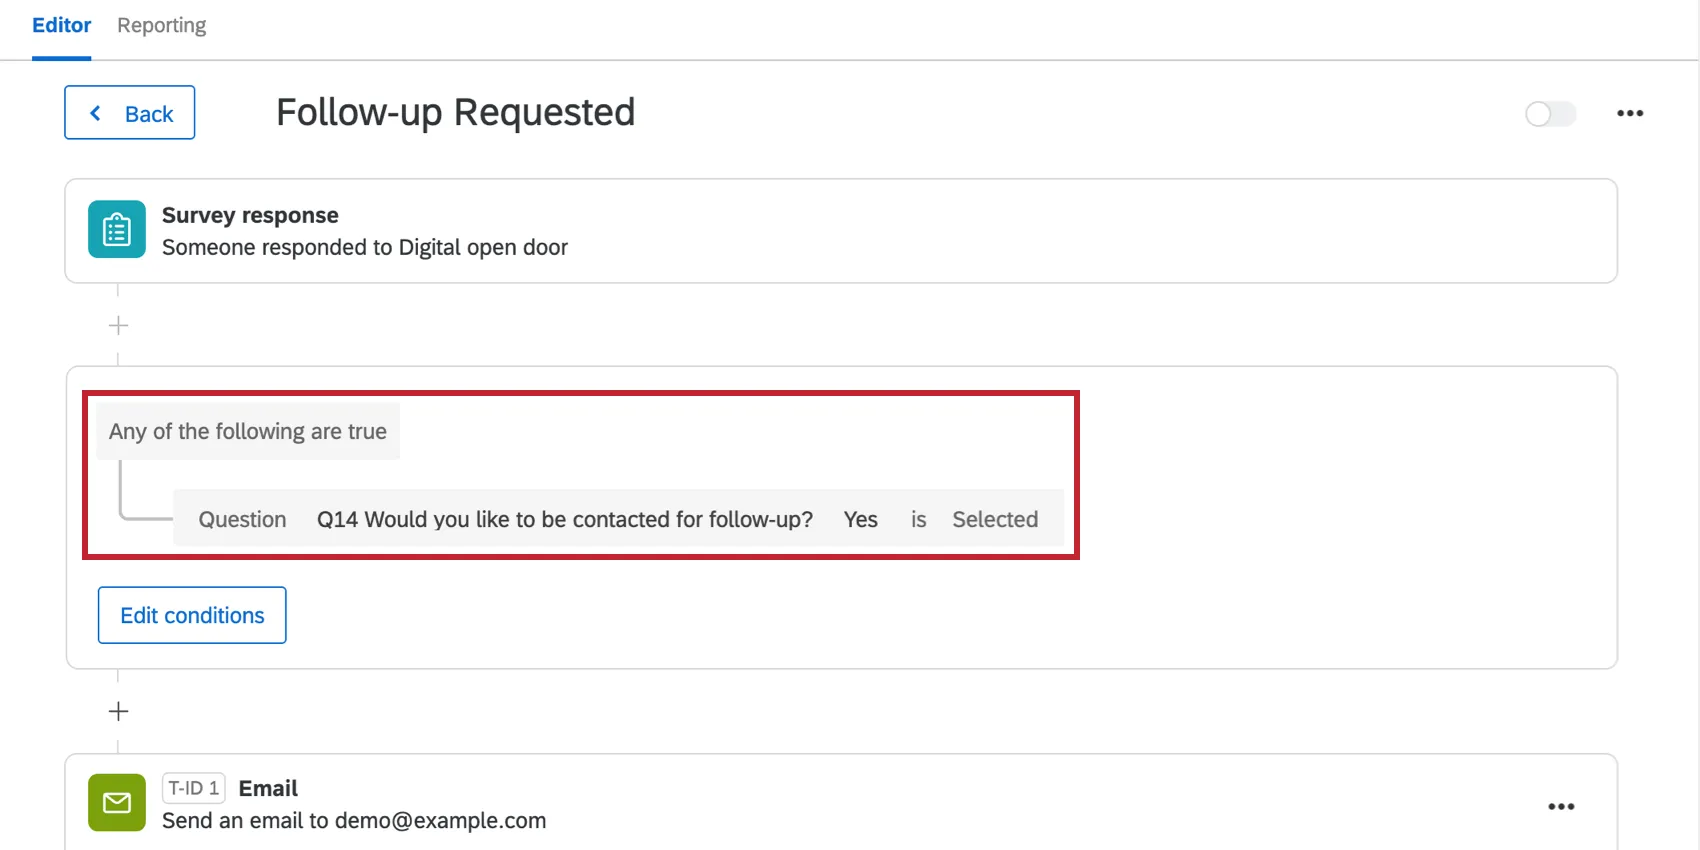
Qtip: For more on building conditions, see:
Click Email to view details such as who’s the recipient of the email notification, the message, and other settings.
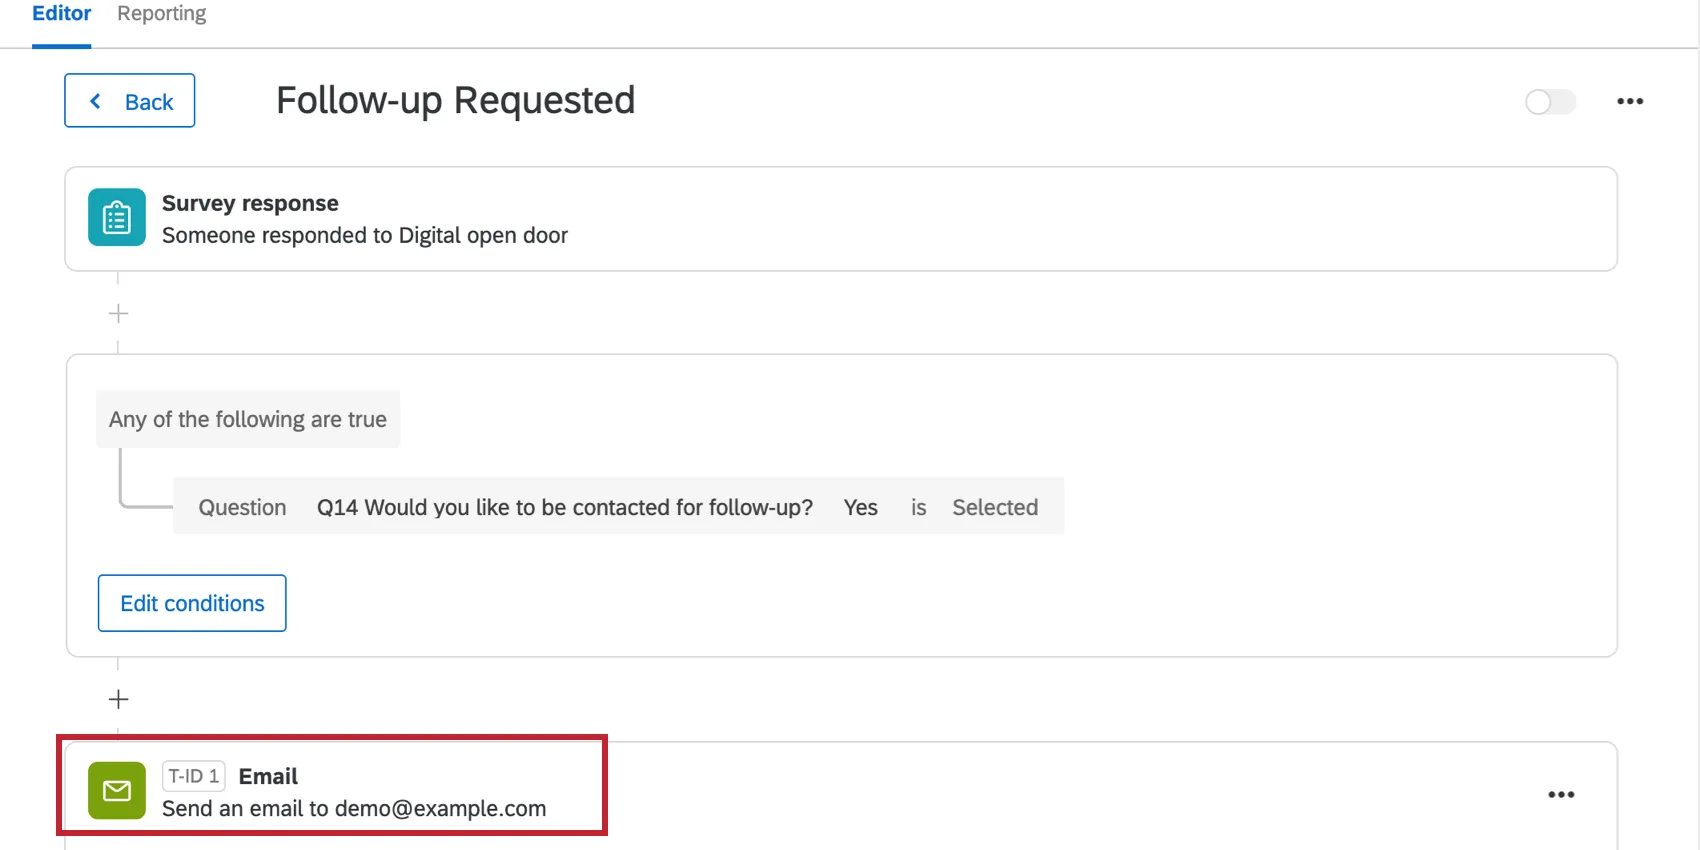
By default, the message contains:
- The date the customer completed the survey
- Their first and last name
- Their preferred email address or phone number
- The email saved for them in the contact list
- A recommendation to reach out to the customer within 48 hours
For additional details and editing options, see the Email Task support page.
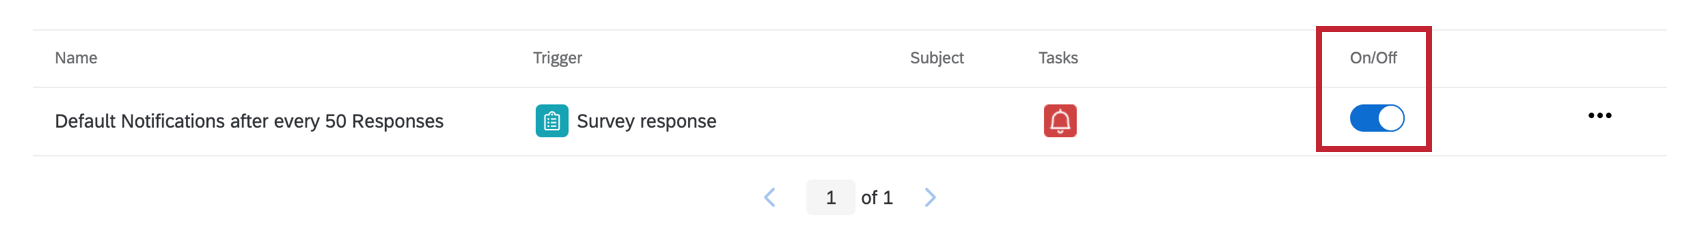
About the Response Notifications
Depending on the frequency you chose, these conditions are set up with one of the following:
Do not edit the conditions on these workflows, the corresponding embedded data in the survey flow, or the quotas involved.
If you don’t want to receive this notification after all, you may delete the workflow. Please note that once you delete a workflow, it cannot be retrieved.
Qtip: This workflow is unrelated to weekly response notifications. See the linked section to learn how to subscribe or unsubscribe to weekly digests.
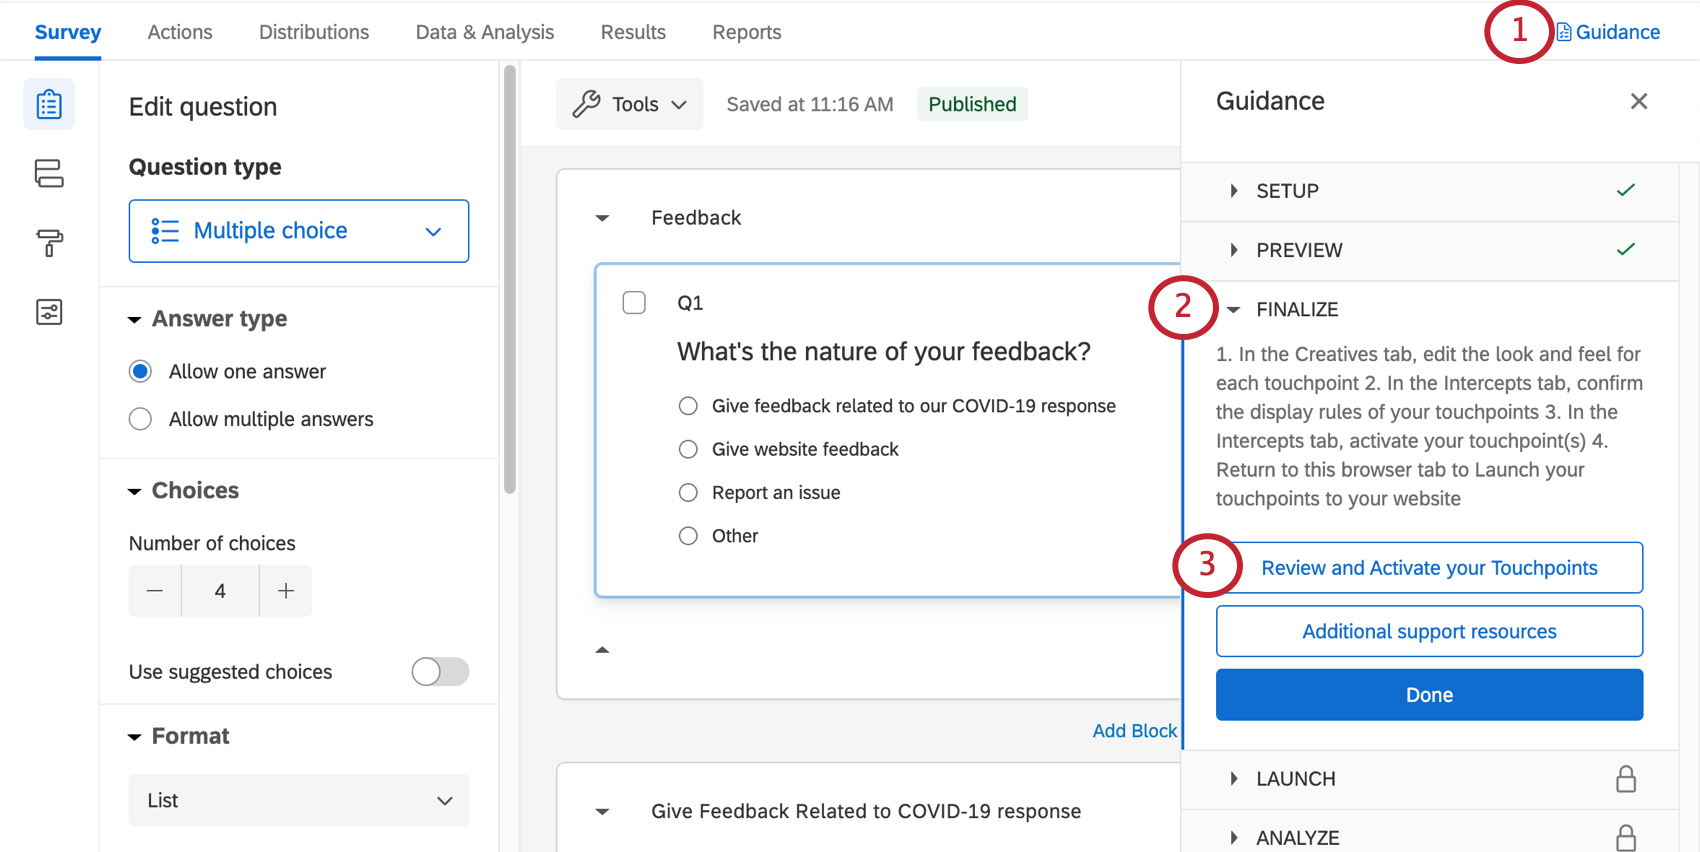
Review and Finalize the Digital Touchpoints
The Digital Open Door involves touchpoints that you can deploy on your website. In this section we’ll summarize what your next steps are and how to navigate to your digital touchpoints for editing. In the following / linked sections, we’ll go over the specific steps in more detail.
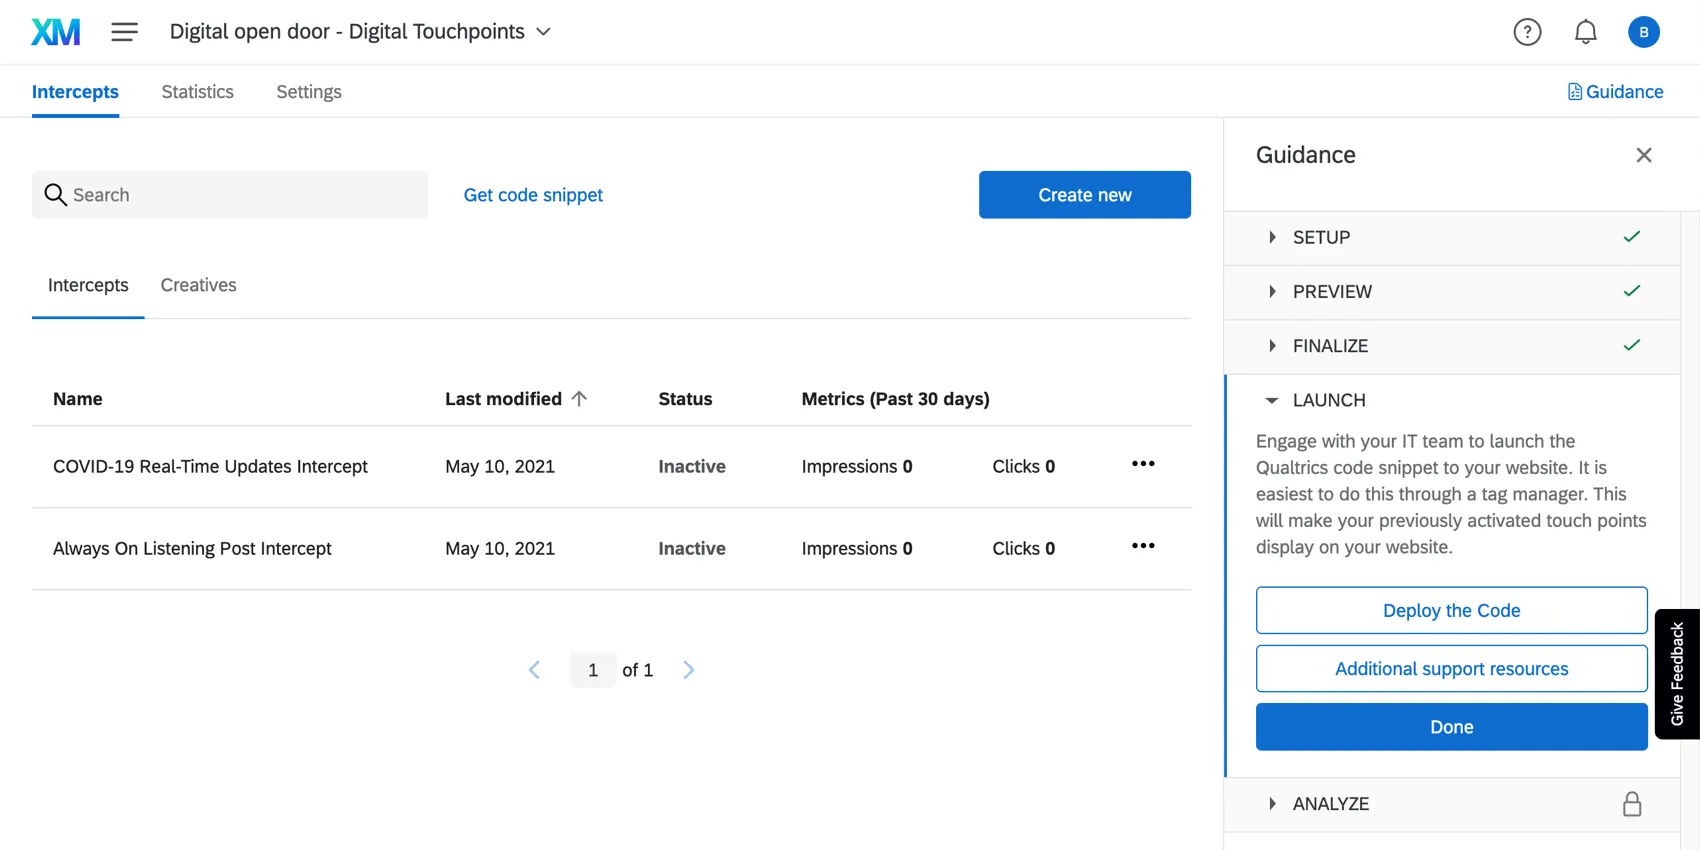
Manually Navigating to the Digital Touchpoints
Are you not seeing these options in your Overview tab? Want to go back after launch to make changes? No worries. Here’s how you can access your digital touchpoints:

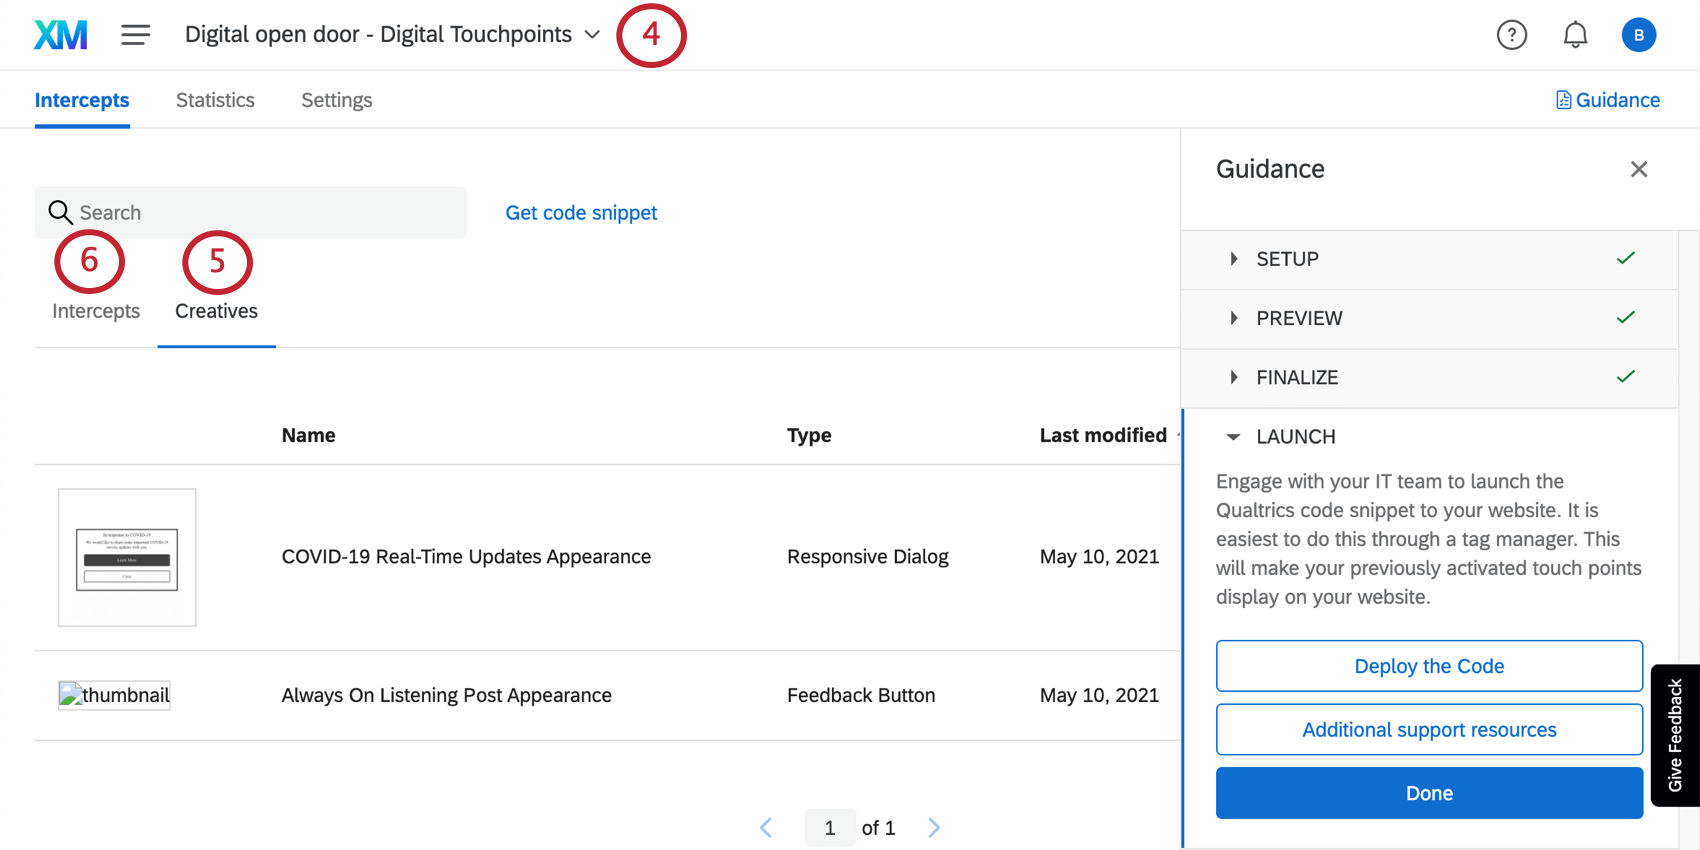
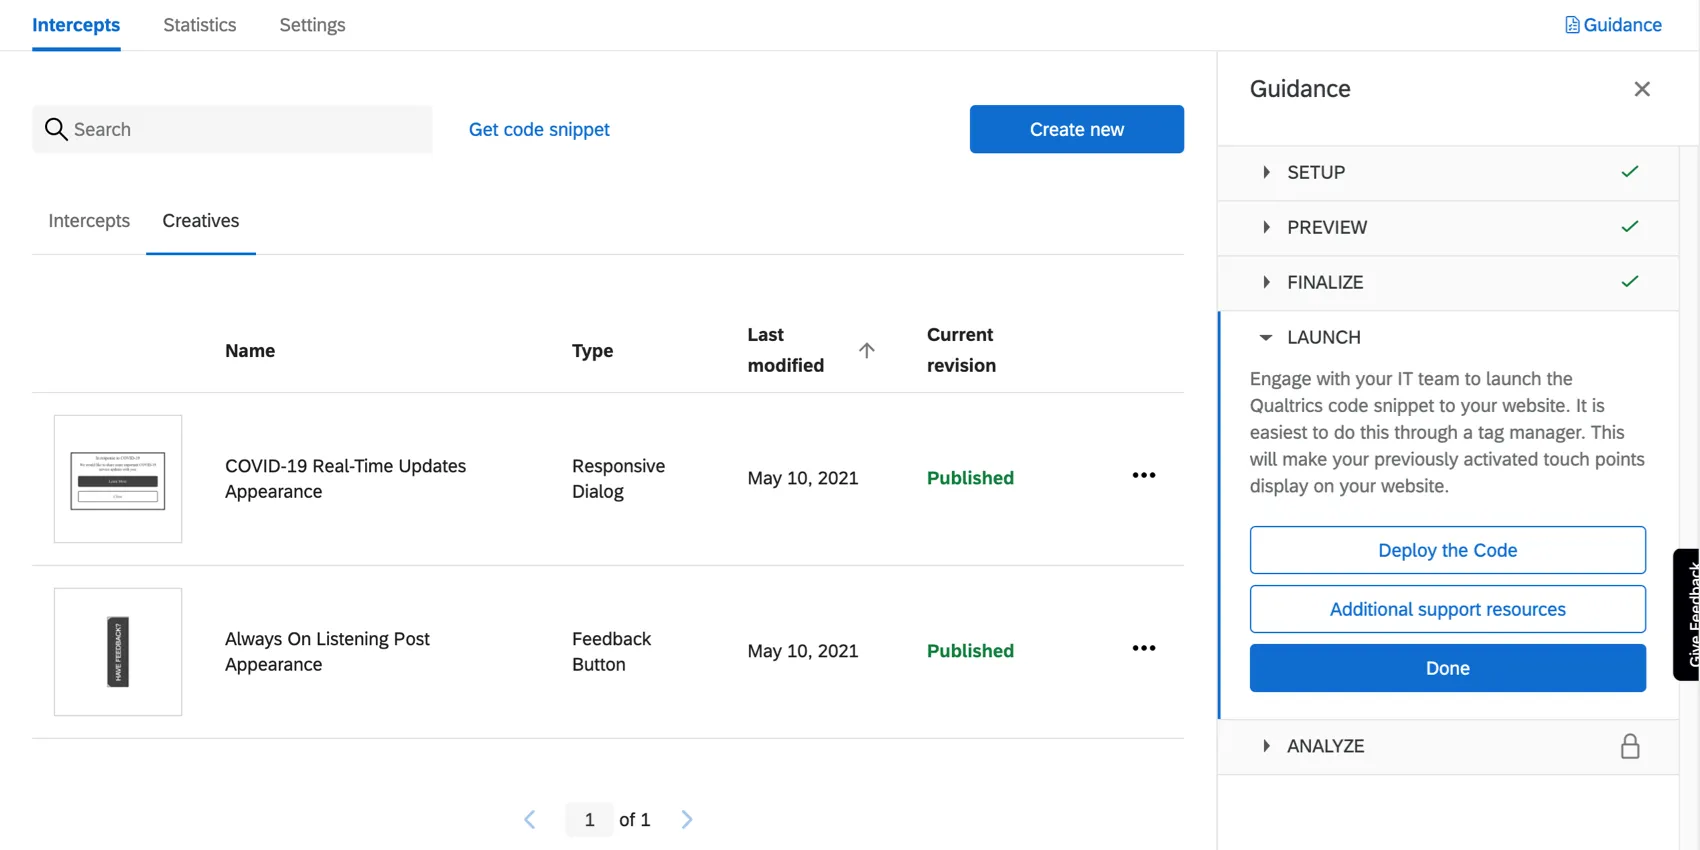
Editing Creatives
“Creatives” are the appearance a digital touchpoint takes on. This includes aesthetic changes, like button colors and text, but it also includes how the touchpoint is oriented on the website, such as the side of the webpage the feedback button appears on, the fading of the webpage behind the real-time update, and more.
Each one you see inside the Creative tab will be named after the digital touchpoint it corresponds to.
- For more on the options available for editing the Always On Feedback Button, see the Feedback Button support page.
- For more on the options available for editing the COVID-19 Real-Time Update, see the Responsive Dialog support page.
Qtip: You can also add your own translations to these creatives, so the button text appears in different languages. Note that these are separate from survey translations.
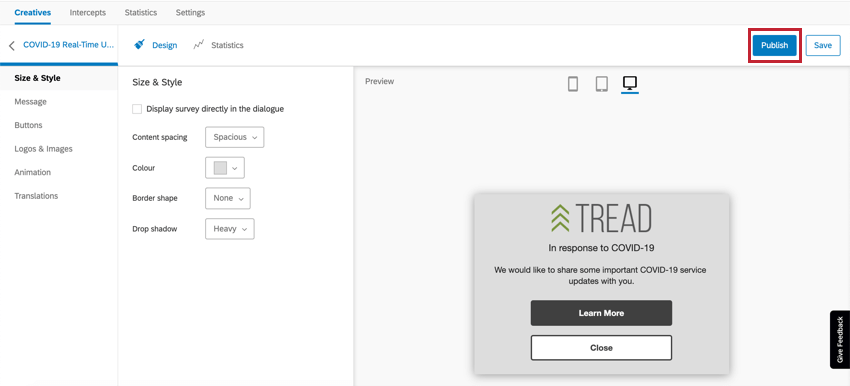
Publishing Creatives
If you make edits to your Creatives, make sure you publish them so that they are pushed to the live code. Only changes that are published will display on your website once you have the code placed on your website.
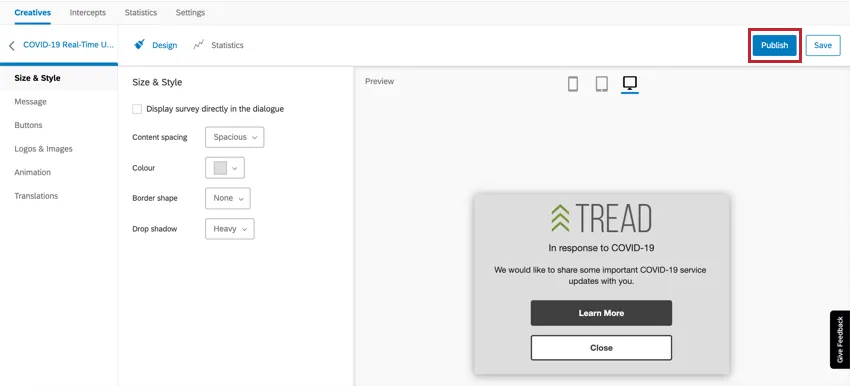
If you are editing a Creative, have the code deployed to your website, and do not want to push your edits live to website visitors, click Save instead.
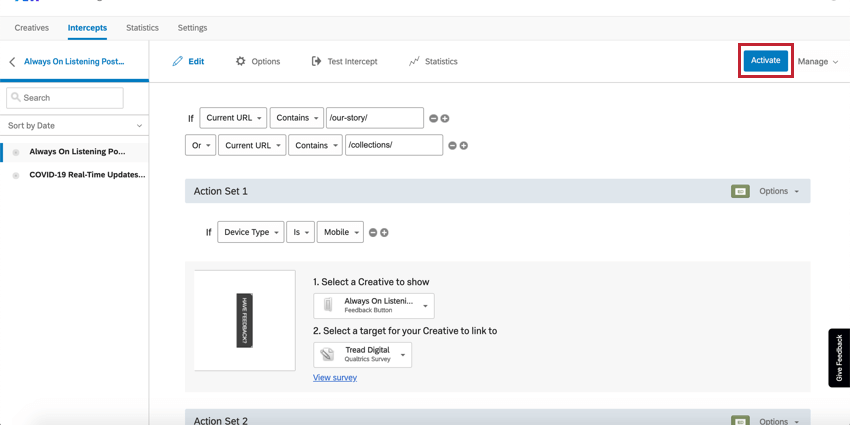
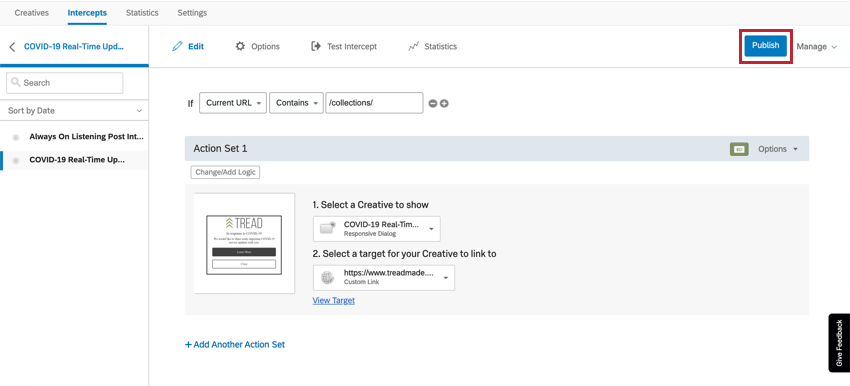
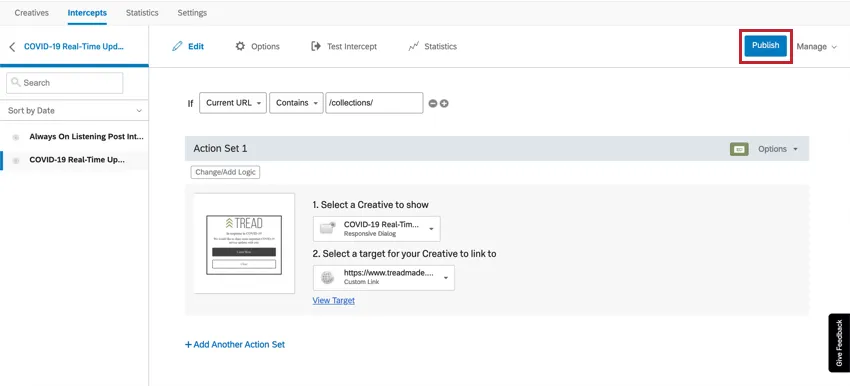
Editing and Activating Intercepts
“Intercepts” are the rules by which digital touchpoints appear to website visitors. That means the Intercepts tab is where you can edit the circumstances under which these touchpoints appear on your website. Here, we will also finalize the digital touchpoints.
Each Intercept will be named after the digital touchpoint it corresponds to.
Once you click into an intercept, certain settings you configured during project creation will be automatically implemented, such as the URL(s) you want to display the touchpoints on and the limit on how many days apart the same touchpoint can be showed to the same visitor.
By default, the targets will be already filled out. The target of an intercept is the website that the intercept should display in the creative, or take the website visitor to directly once clicked. For the Always On Feedback Button, this is the Digital Open Door survey, which it displays when it slides open. For the COVID-19 Real-Time Update, this is your company’s COVID-19 support site, which it links out to.
Example: Since you set up the project in Qualtrics, you have changed the URL of the website you want to redirect visitors to if they have questions on your company’s response to COVID-19. In this case, you would open the Intercept for the COVID-19 Real-Time Update and edit the Target.
Resources on Intercept Editing
When editing an intercept, think about how you want that specific touchpoint to behave towards website visitors. For more guidance on the options available to you, see:
- Setting Up Your Intercept: An introductory page the goes over top-level information on intercepts, and the types of edits you might want to make.
- Editing Intercepts: Step-by-steps on all the basics to intercept editing, from targets, to the rules under which they display (logic), and more.
Additional resources and advanced options:
- Multiple Action Sets
- Embedded Data in Website Feedback Qtip: Be careful when editing the pre-configured embedded data. If you remove or rename fields, you will not capture the desired information.

- Intercept Options
If you would like to test the edits you’re making without deploying them to your site, try testing the intercept.
Qtip: Remember to test on the correct URLs. If during project setup you said your intercept should only appear on “www.treadmade.com/home,” it won’t appear when you test it on other pages of your site.
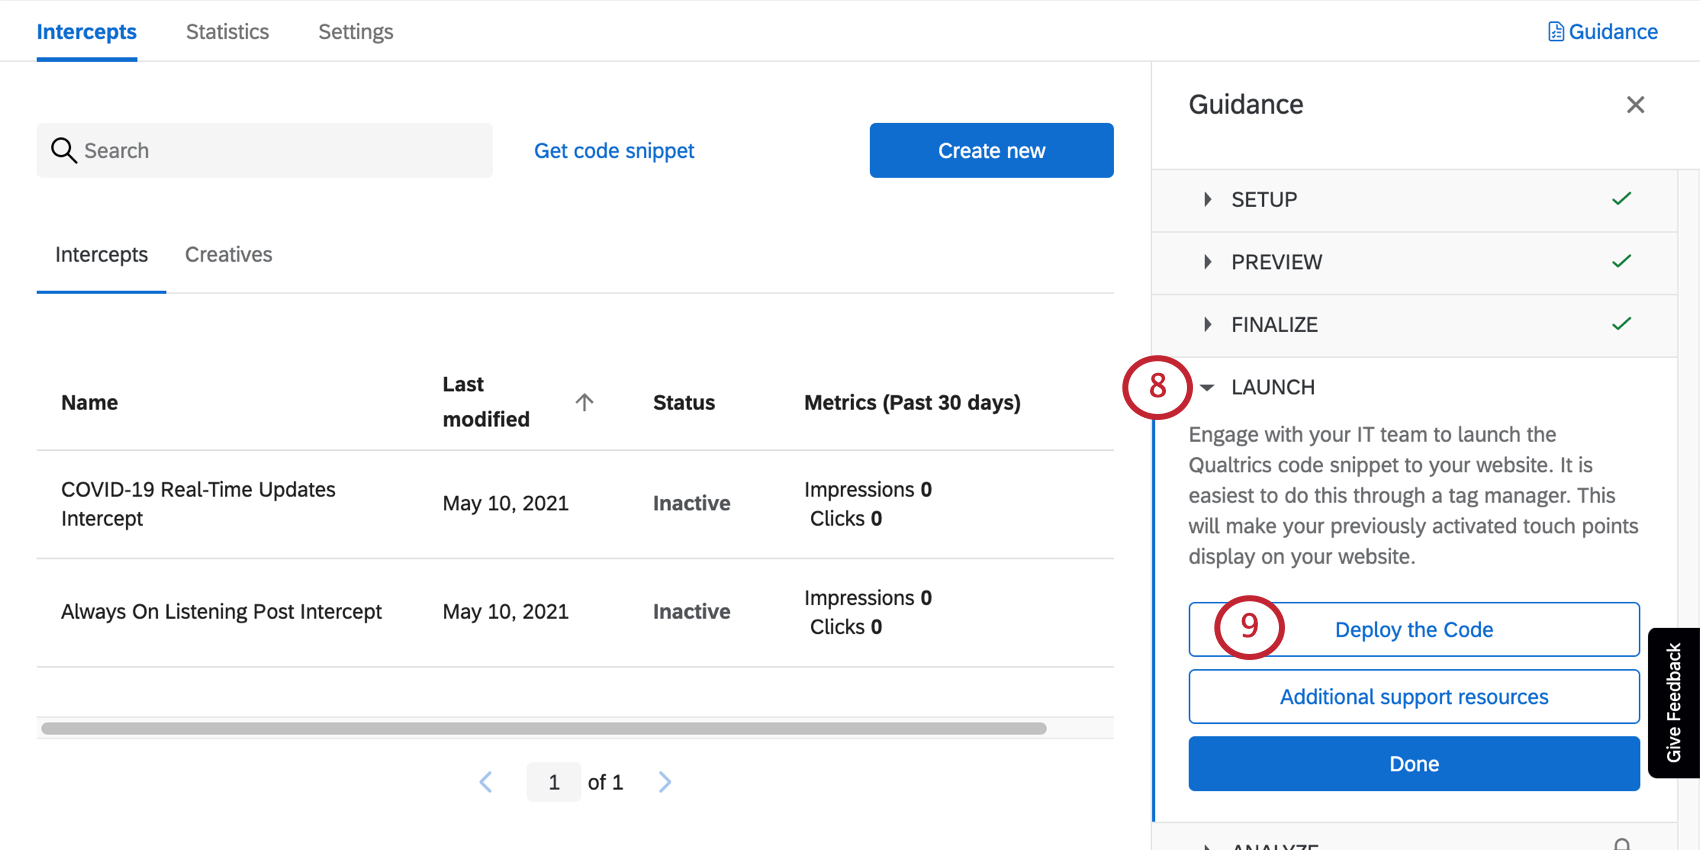
Publishing and Activating Intercepts
When you have made edits to your intercepts, publish them.
When you are ready for your edits to be live on your website, activate your intercepts.

Qtip: If you have both the Always On Feedback Button and the COVID-19 Real-Time Update, you must publish and activate both intercepts.
Qtip: Anytime you edit the intercepts going forward, you will only publish changes to push those changes to your website, because the intercepts are already activated. To disable one or both intercepts, you can deactivate them. See more on Activating, Publishing, & Managing Intercepts.
Deploying the Digital Touchpoints
Once you’re done customizing these touchpoints, it’s time to generate the code so your IT / web development team can deploy the touchpoints on your website.
Qtip: Please remember that your intercepts must be activated to display the digital touchpoints on the website.
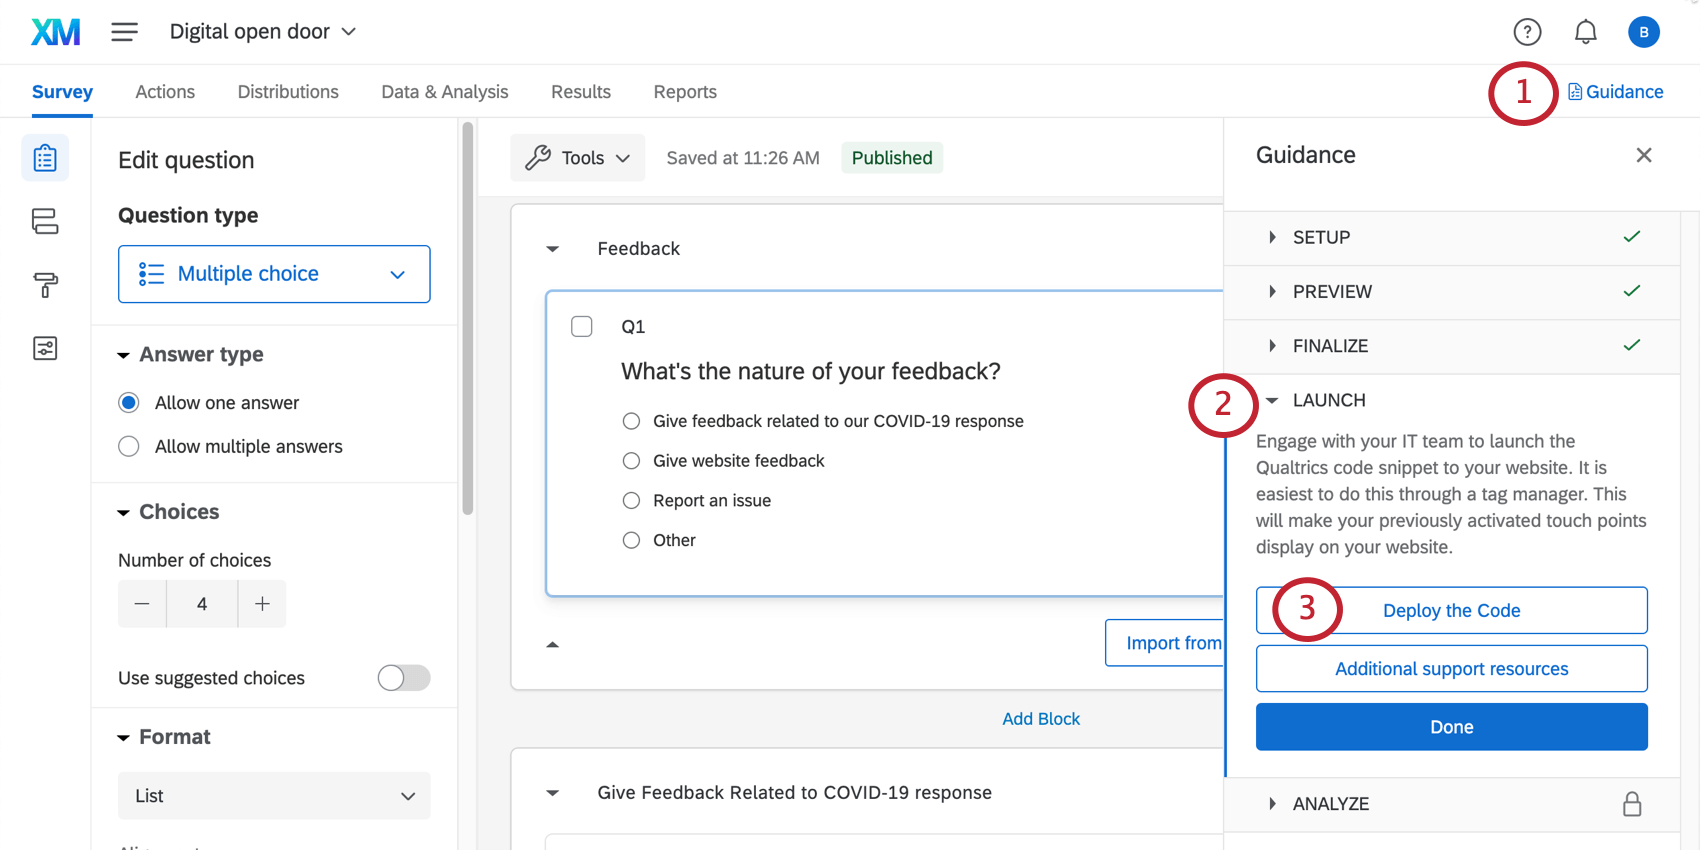
Qtip: We recommend saving this code in a plain text or TXT file to preserve formatting.
Qtip: Regardless of whether you decided to use both digital touchpoints, you will only need to generate one code.
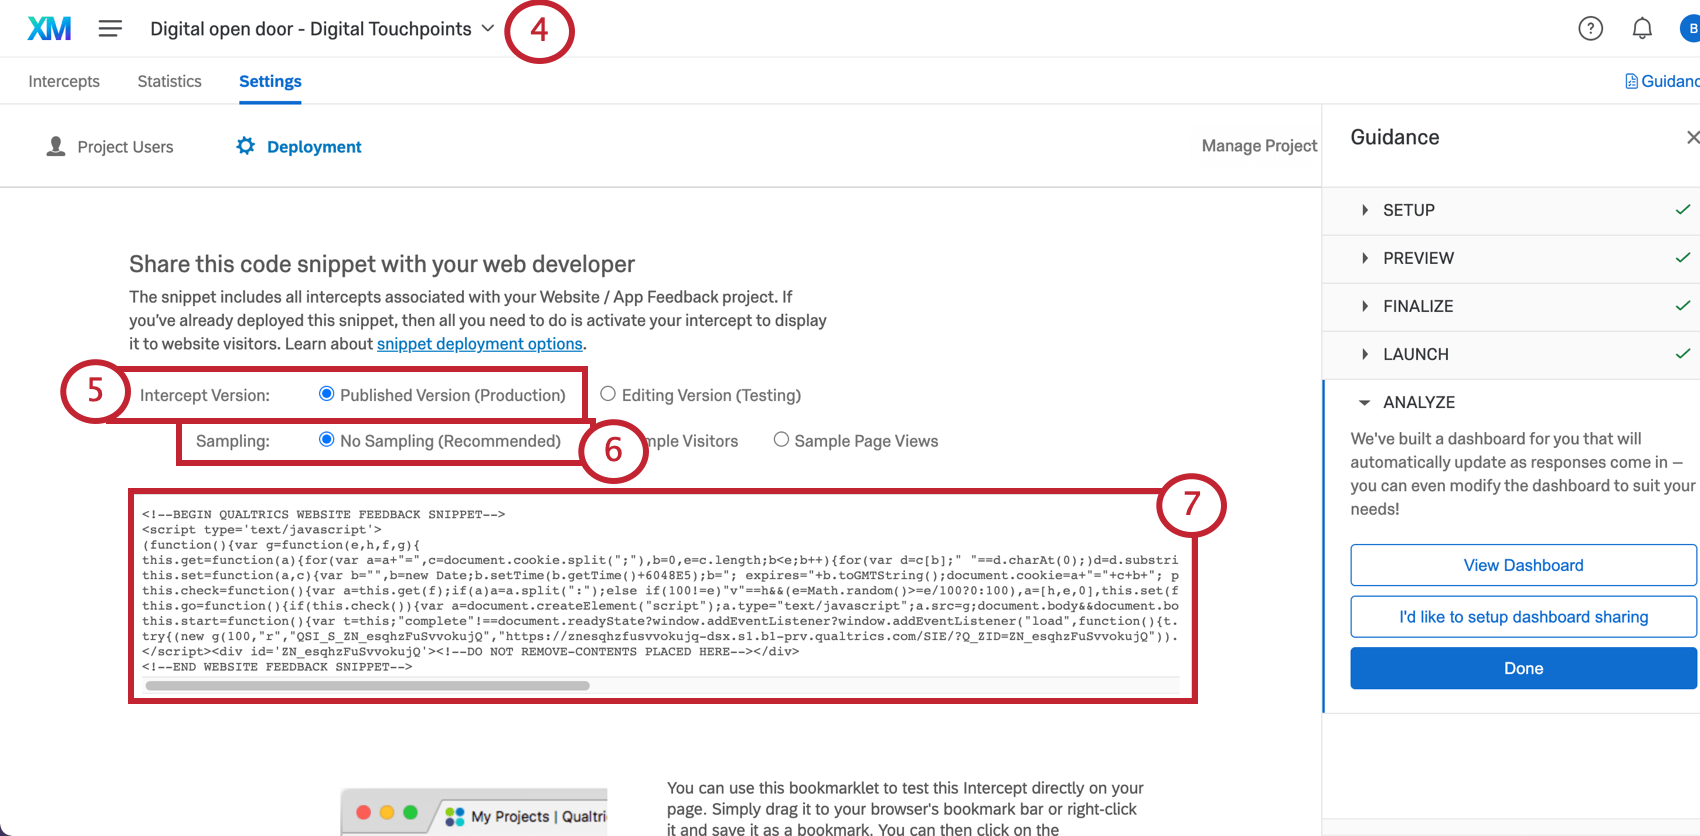
Resources for Development Teams
We have a few resources that can help your development team, once they have the code:
Qtip: We recommend using a Tag Manager to expedite the deployment if you have one already.
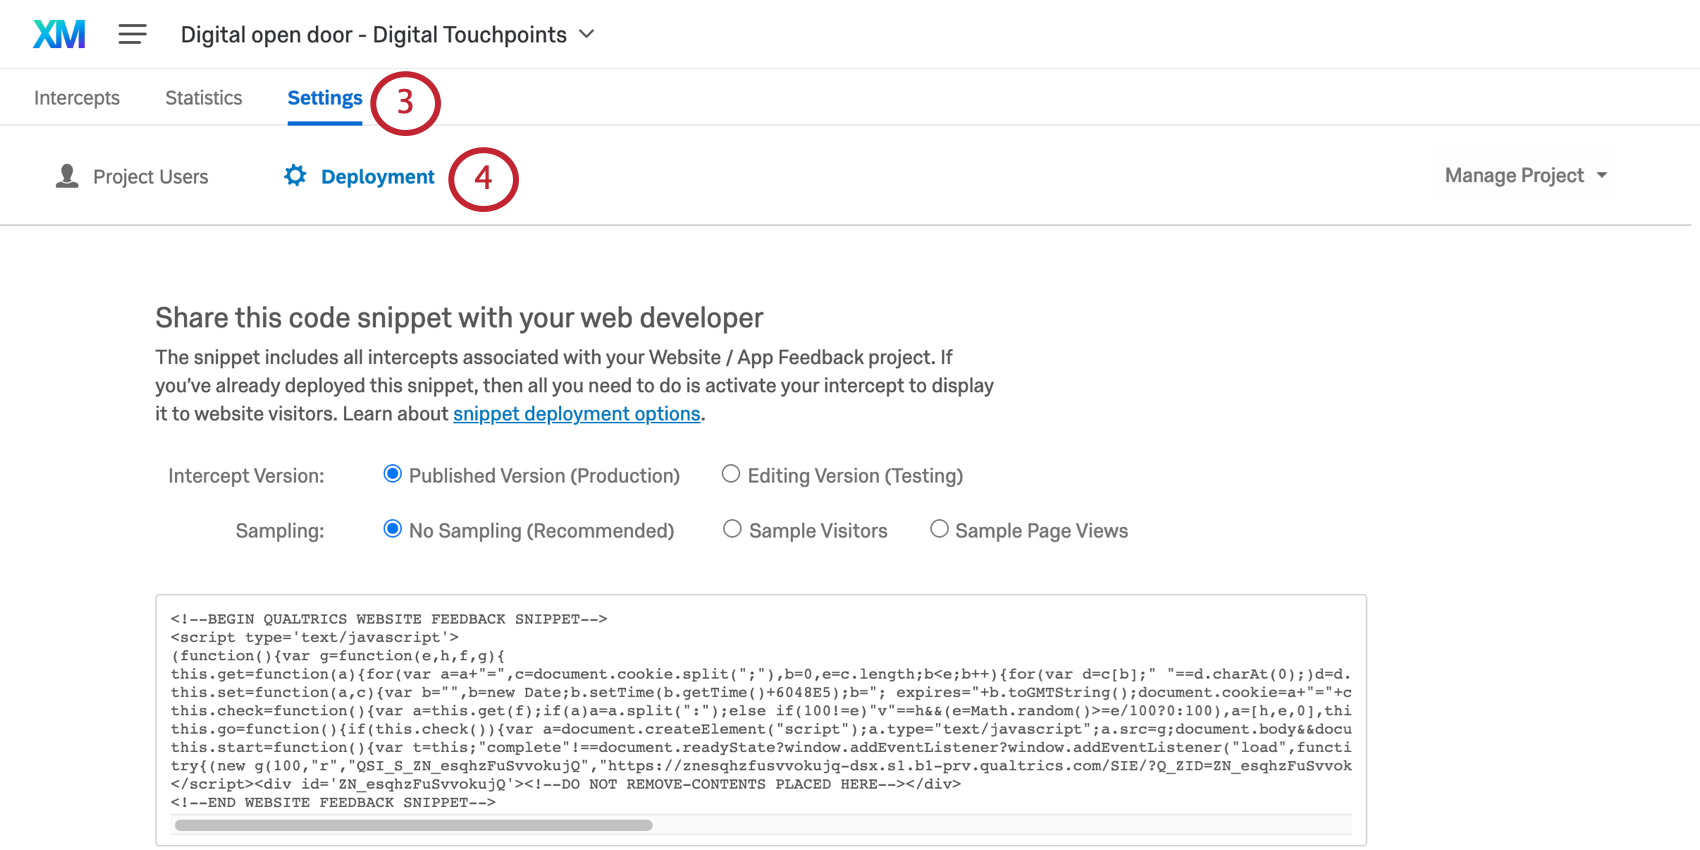
Manually Navigating to the Deployment Code
Do you need to grab the deployment code, but no longer see the Get the Code button? No worries. Here’s how you can find it:
Dashboards
Premade Dashboards
Our XM Scientists have developed a special dashboard for this XM Solution. This dashboard gives an overview of the results, and is ready to share as soon as you have collected data. The pages of the dashboard and the data included will depend on the type of assessment you chose and whether you have decided to give respondents an option for follow-up.
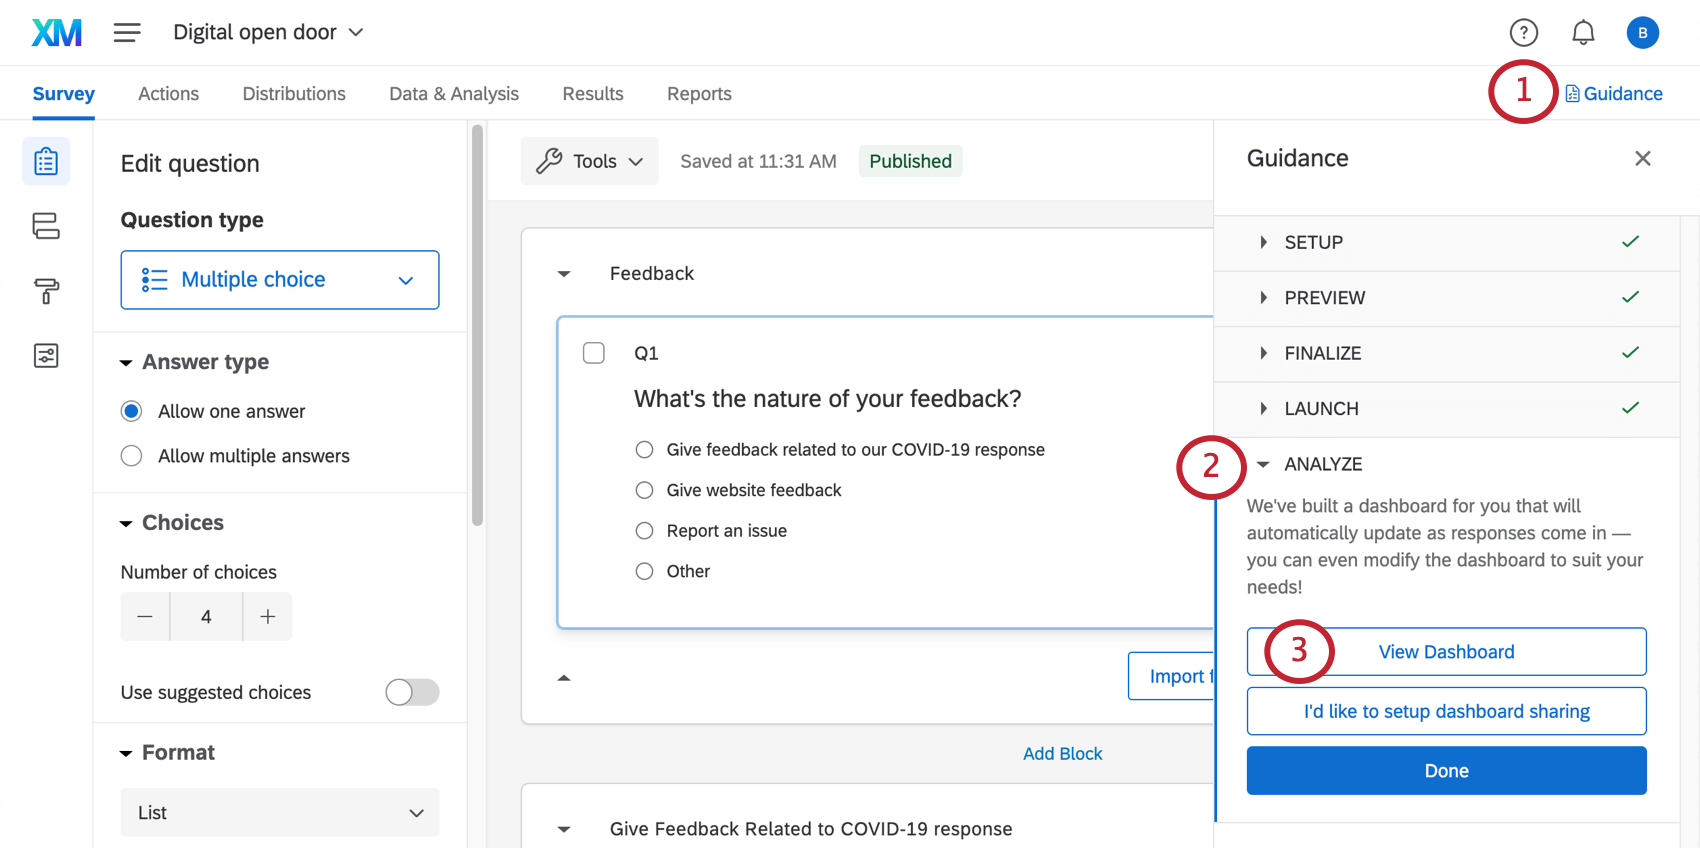
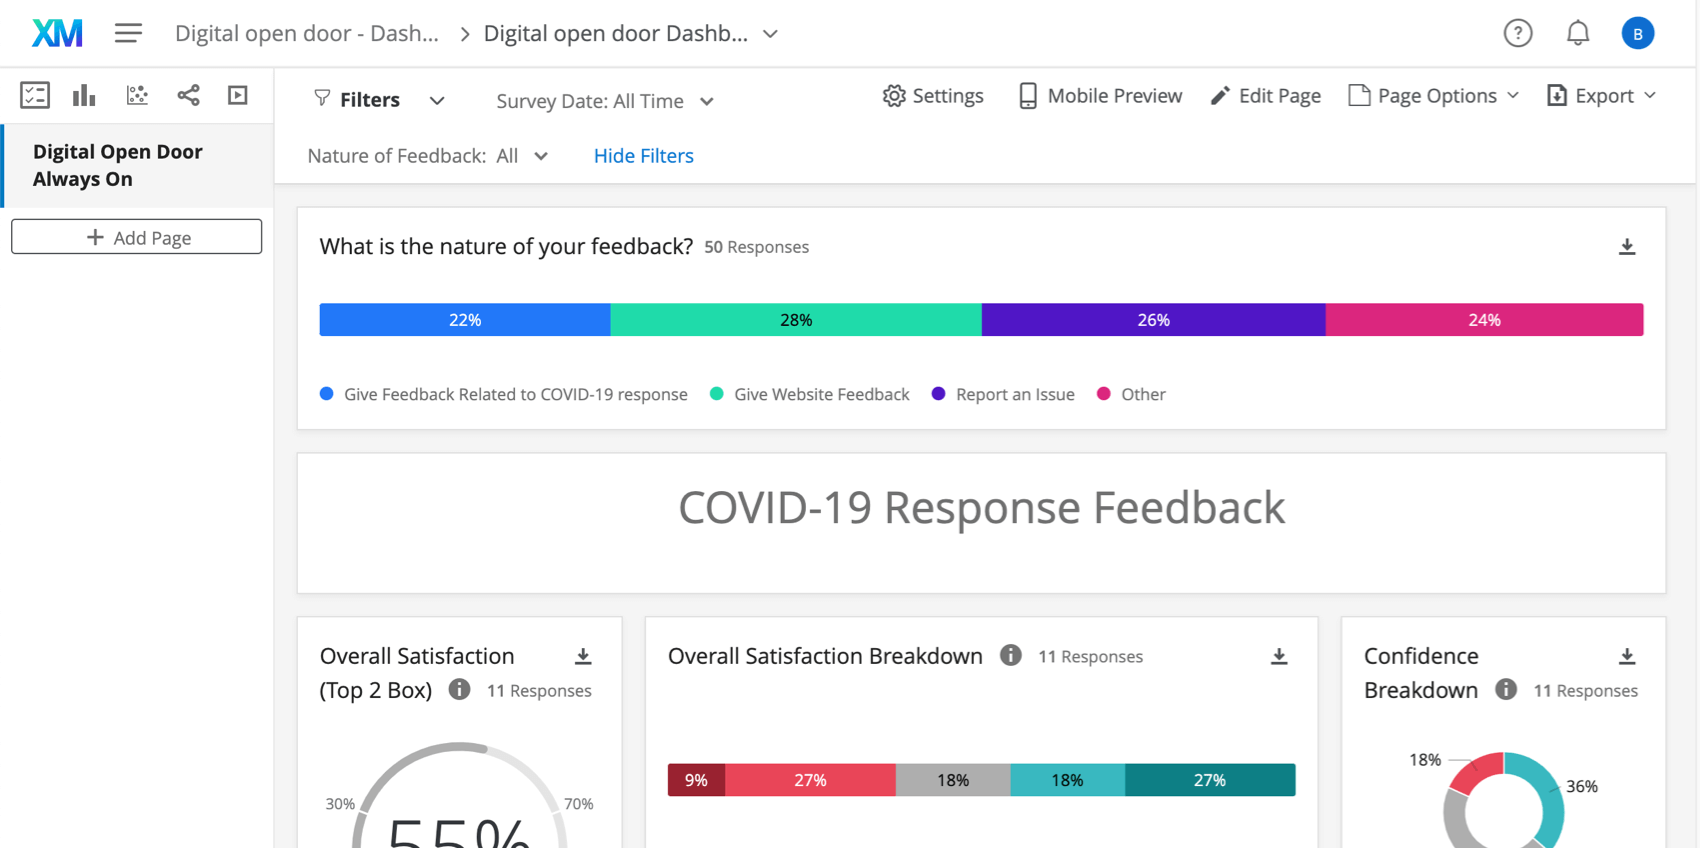
Qtip: This dashboard will not generate charts and tables until you collect data. Try completing the survey through the preview button if you want to test what these dashboards look like with data. Remember you can always delete preview data later.
Qtip: Line charts may appear as a single point until you collect multiple weeks worth of data. This is because they are displaying trends over time, and don’t have enough data to display a trend yet.
If you instead selected Set up dashboard sharing, you’ll be redirected to the User Admin tab. See Sharing & Administering Users for guidance on what changes you can make here, and what kind of Qualtrics users can access this tab.
Dashboard Editing
Qtip: The pre-made dashboard was developed by our top subject matter experts. We advise trying to keep your dashboard as similar to the original template as possible, and not making too many large-scale changes.
Check out these introductory pages to get started.
- Getting Started with CX Dashboards
- Step 1: Creating Your Project & Adding a Dashboard
- Step 2: Mapping a Dashboard Data Source
- Step 3: Planning Your Dashboard Design
- Step 4: Building Your Dashboard
- Step 5: Additional Dashboard Customization
- Step 6: Sharing & Administering Users
Qtip: Once you’ve uploaded all your dashboard users, you can easily send many users or send everyone their login credentials.
Other Ways to Access the Dashboard
Anytime you enter your project’s Overview tab, you’ll be able to select View Dashboard to enter the pre-made dashboard.
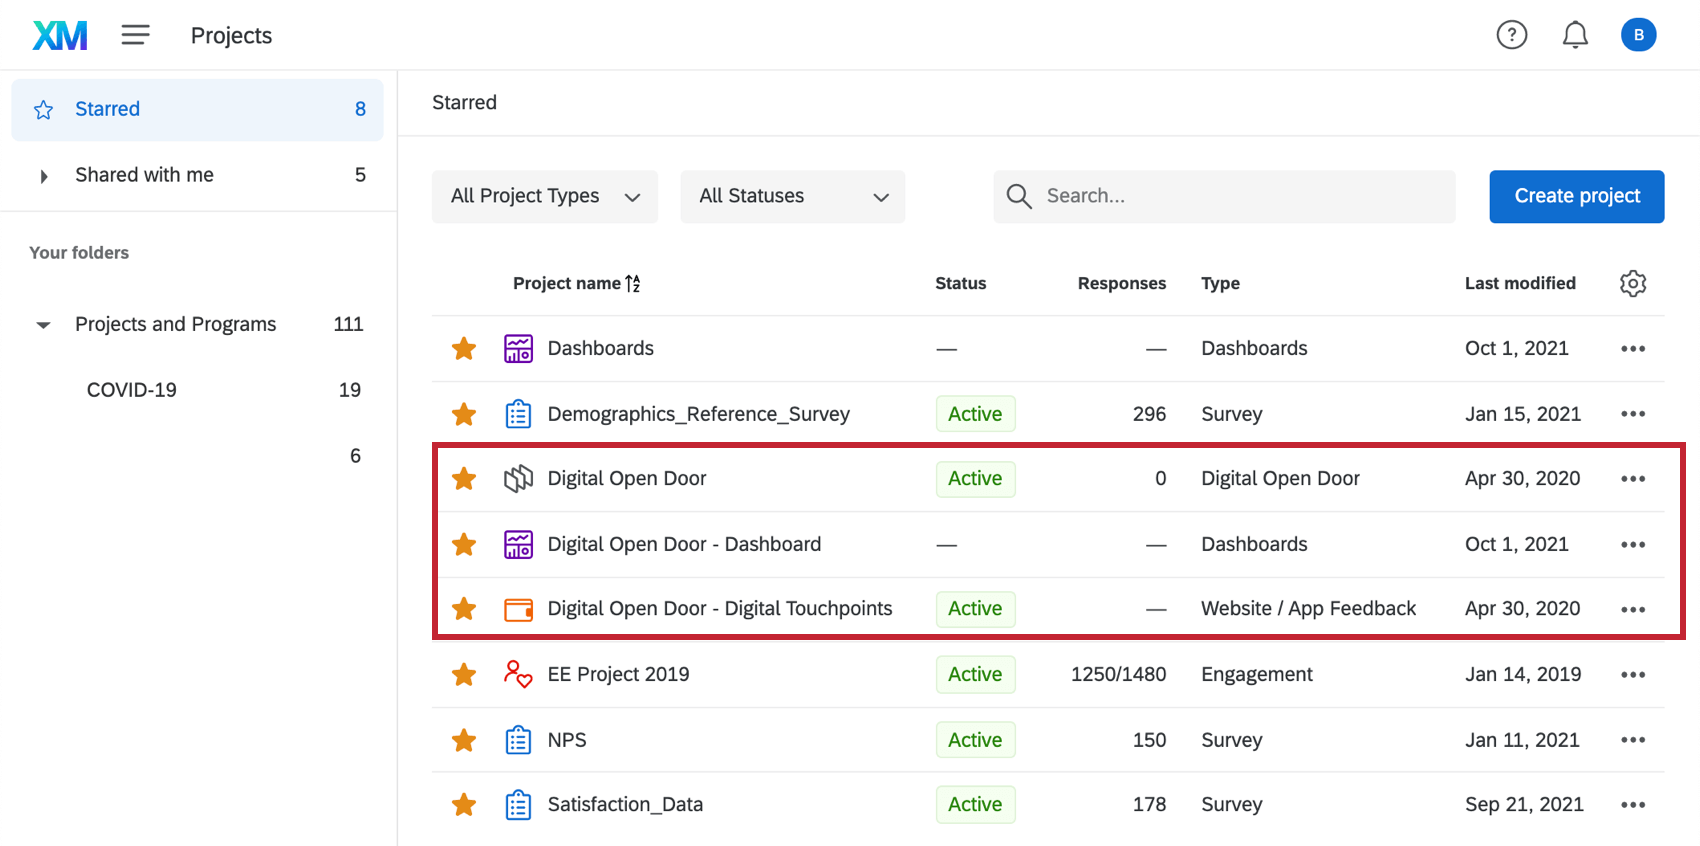
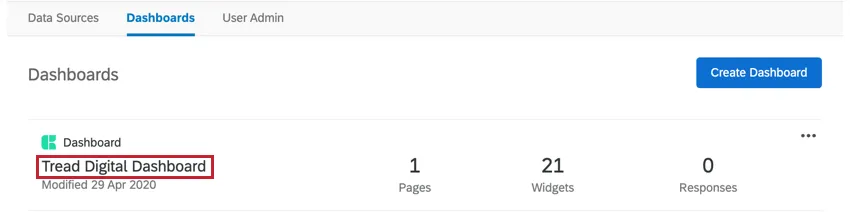
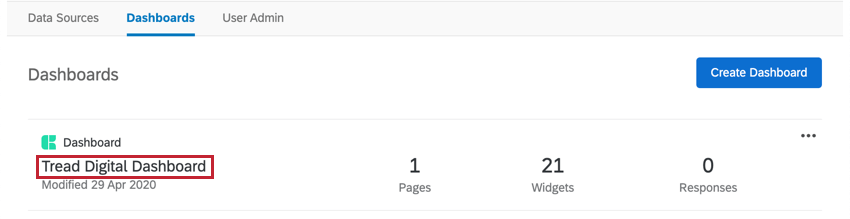
You can also access this dashboard from your Projects page. It will have the same name as your Digital Open Door, with “- Dashboard” added to the end.
Example: Below, you can see our Digital Open Door, the Website/App Feedback project, and the corresponding Dashboard.

Once you click inside the dashboard project, you’ll see the pre-made dashboard. Click this to view the data.
Warning: Do not delete the premade dashboard! If you do, it will not be retrievable, and you will have to make a new one from scratch.
Other Ways to View Data
The Data & Analysis tab of your project allows you to edit data, export a spreadsheet of all responses, filter your responses, and much more.
Qtip: To preview a particular column of data, choose columns to display on Data & Analysis. You can export this data at any time.
The Reports tab comes with two additional report-building features. These do not come with the dynamic, shareable filters and roles CX Dashboards have, but are more basic in structure, and can still be filtered and shared out to stakeholders as needed. Note that these reports will have to be built from scratch. See Results vs. Reports for a detailed breakdown of these reporting options.
Qtip: In your Website/App Feedback project, you can get data on how website visitors interacted with your digital touchpoints via page views, clicks, and impressions. See Website/App Feedback project Statistics for more information.
Weekly Response Notifications
Qtip: Weekly response notifications are unrelated to other email notifications set in Workflows.
Qtip: You may not see this functionality yet. That’s because this feature is still gradually rolling out. When the feature is enabled for your COVID-19 XM Solutions, you will see weekly notifications come in on Mondays.
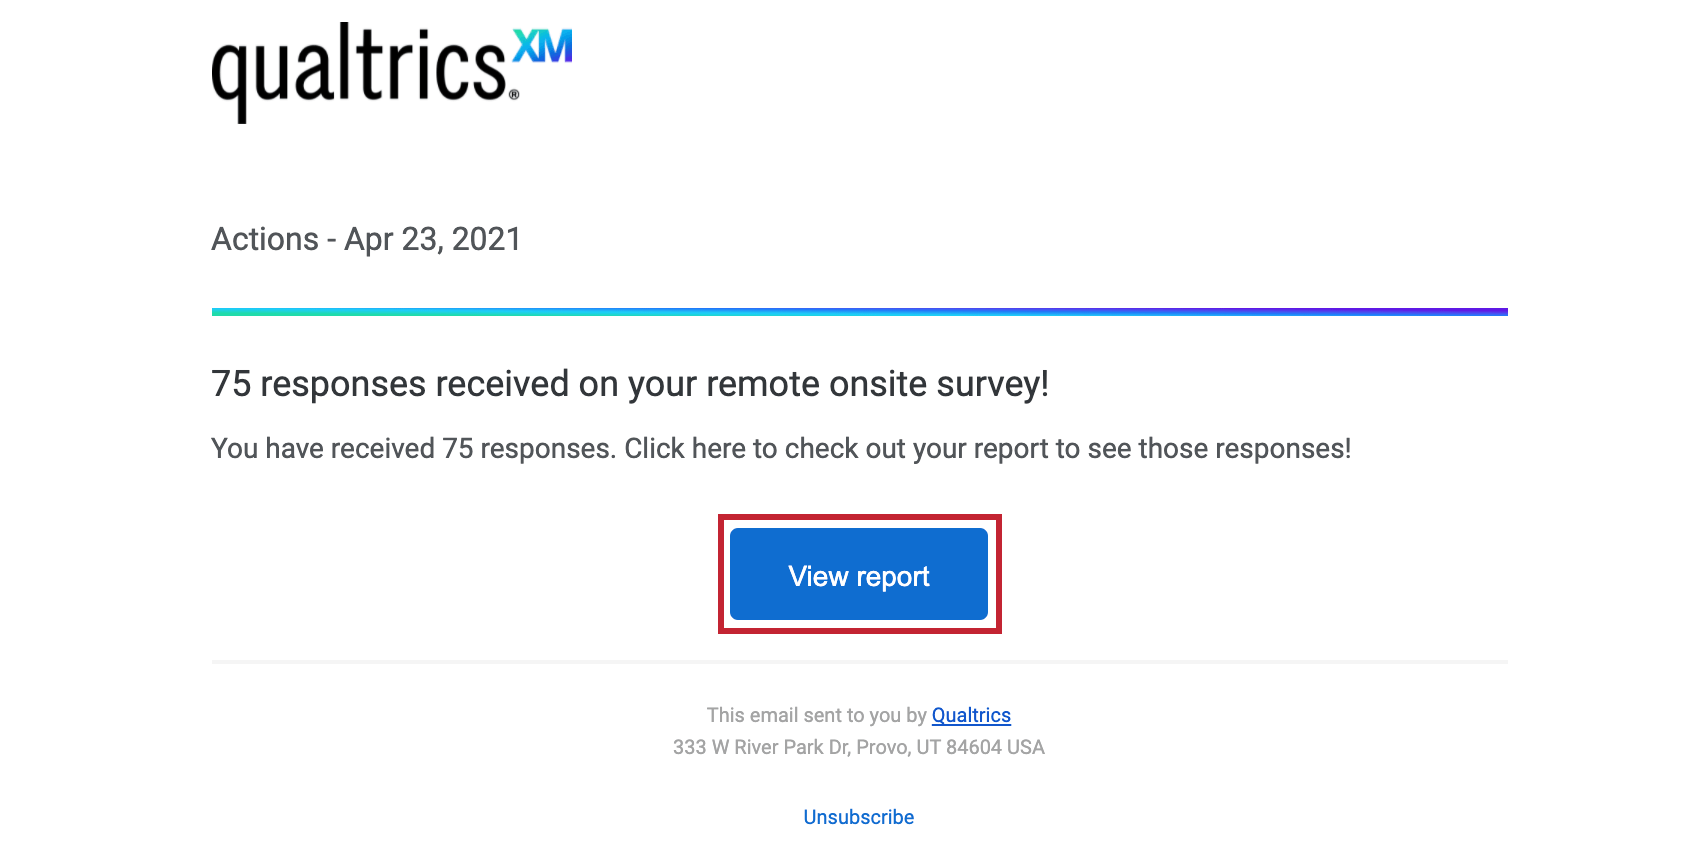
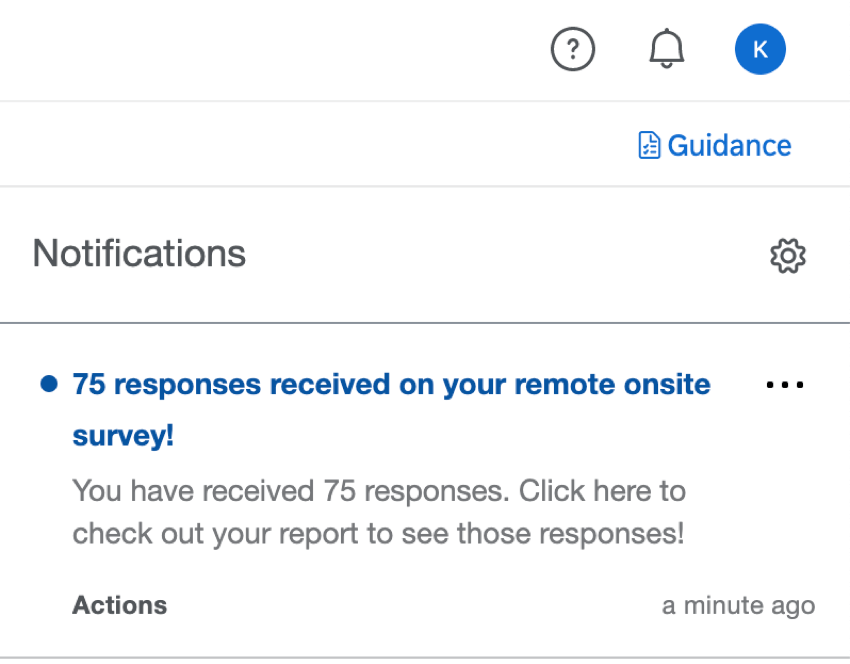
Built in are weekly reports of how many responses your survey has received in the past week, and how many responses that makes for the survey in total. These notifications come every Monday morning.
Reports are sent as emails and as notifications in your account.
Qtip: Weekly digests are only sent for COVID-19 XM Solutions that are active and have received responses over the last two weeks.
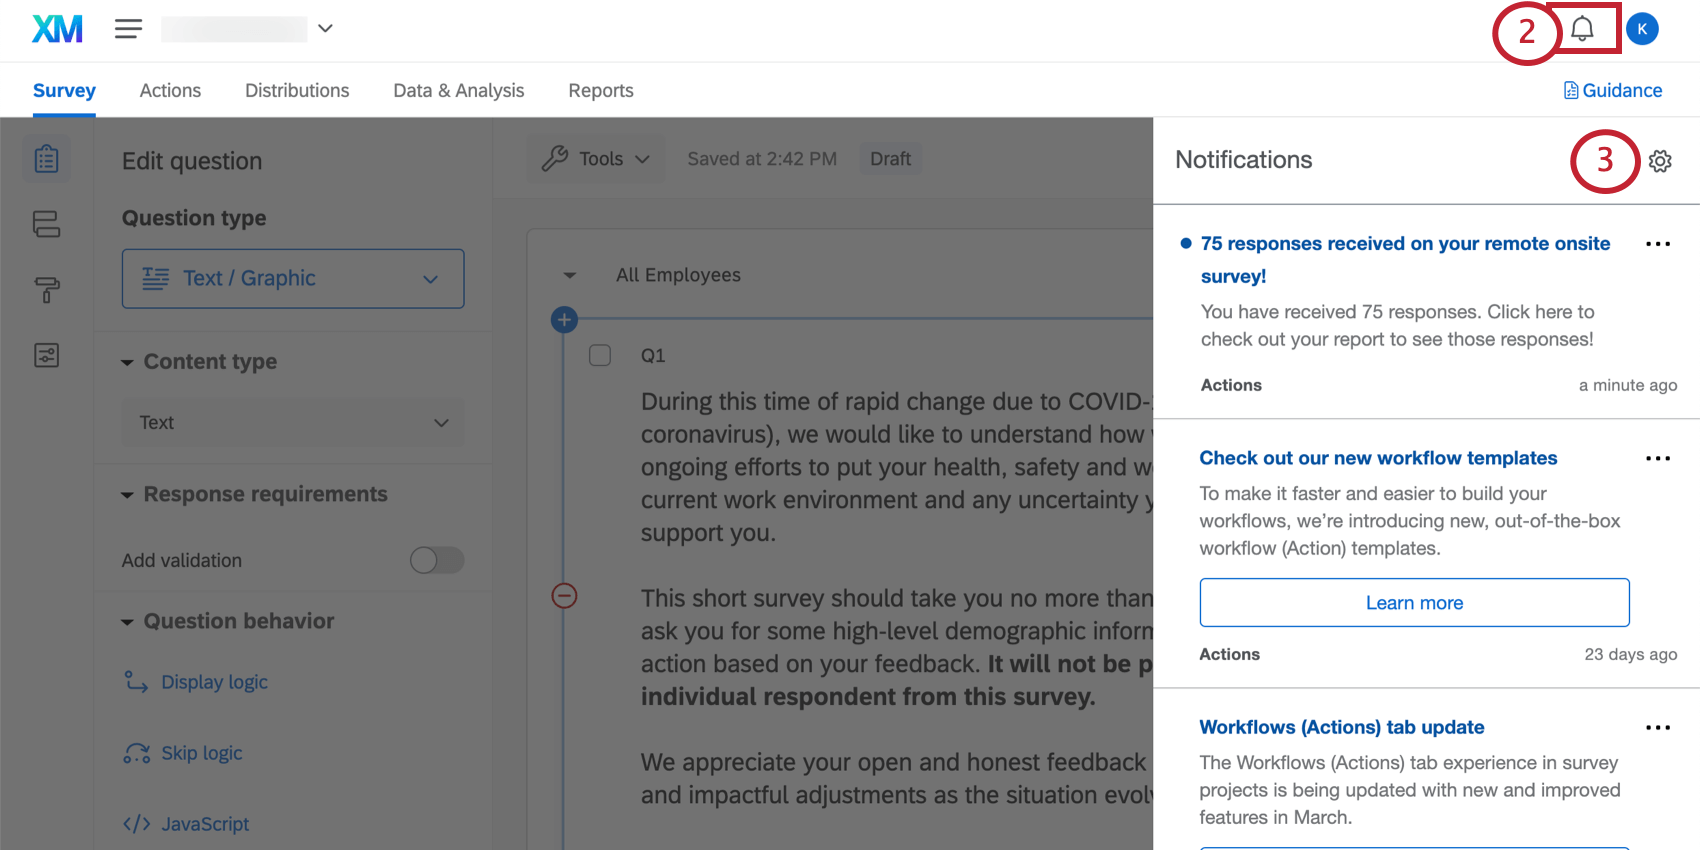
Viewing Reports

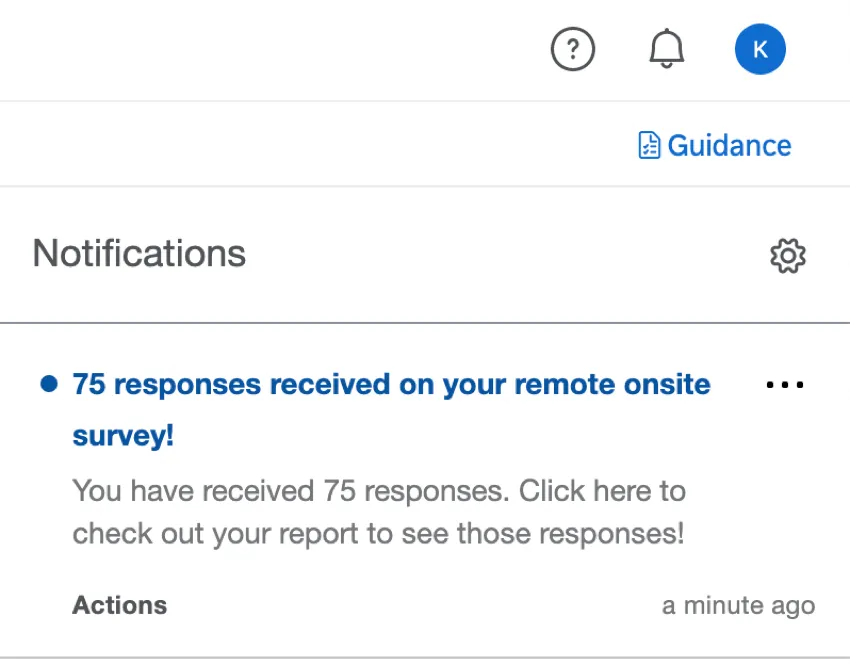
View report: Clicking View report in the email or clicking the in-product notification will take you to the Reports section of the Reports tab of your project, where you should see the pre-built report.
Qtip: If you’re clicking these buttons from your email, you may need to log into your account before you are taken to these tabs.
Unsubscribing from Notifications
If you no longer wish to receive notifications, you can click unsubscribe at the bottom of the email.
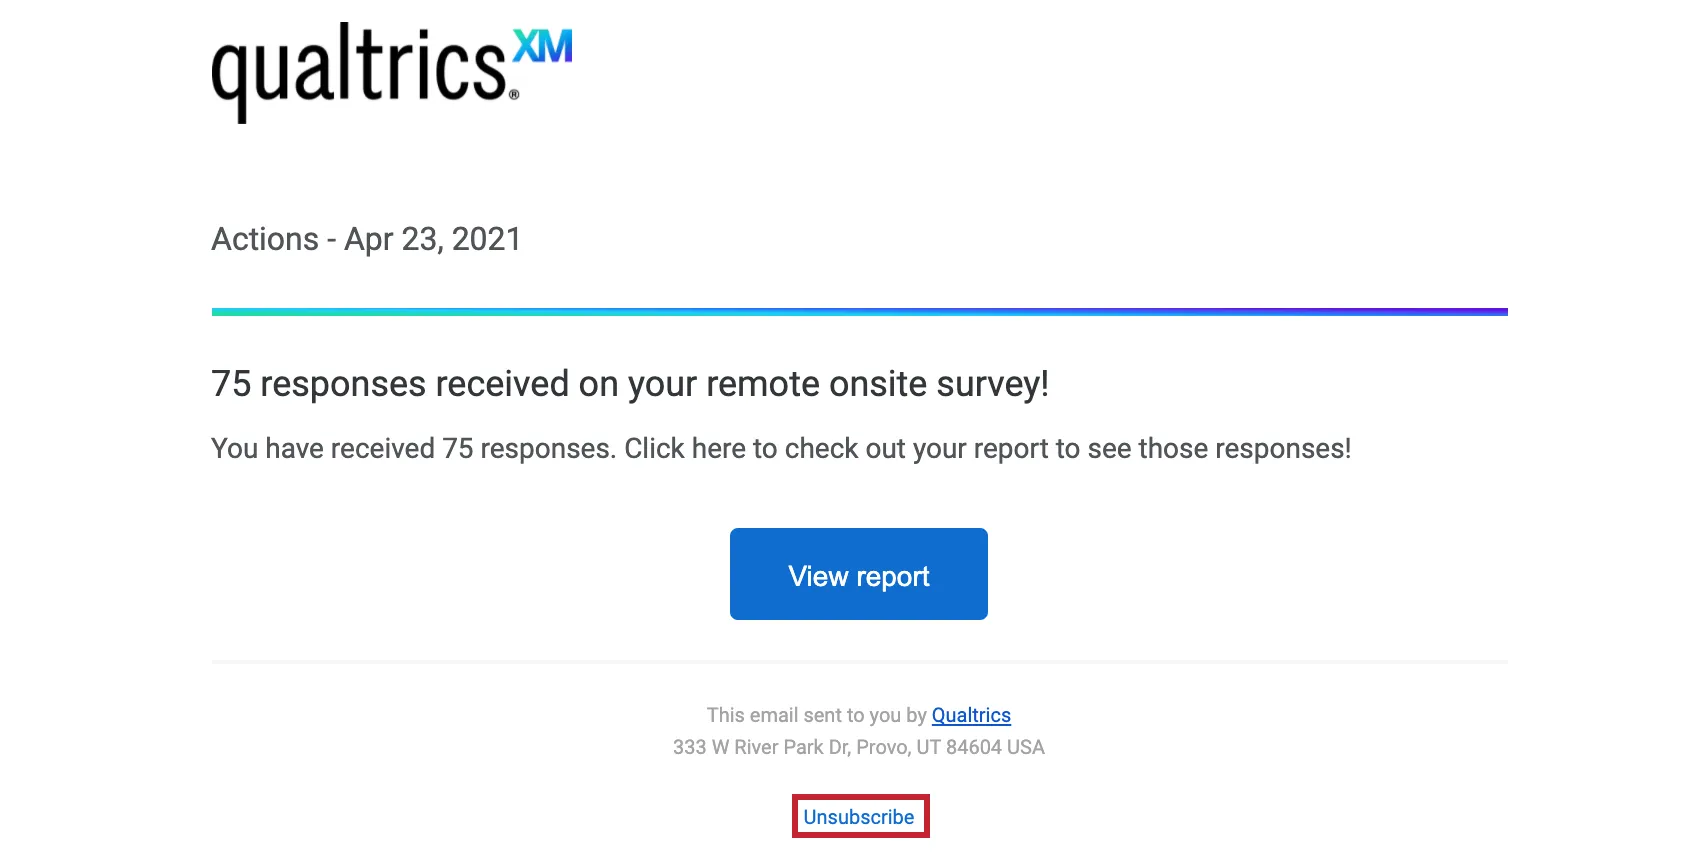
Qtip: This will unsubscribe you from all notifications. You cannot unsubscribe from a specific project.
Subscribing to Updates
Most users will be subscribed to these automatically. However, if you unsubscribed and find you want to start receiving them again, you can do the following:
Qtip: Users that have 10 or more active surveys that have received responses in the last 2 weeks will not be automatically subscribed.
Terms of Use: CX COVID-19 Solutions
Free Accounts
For customers who sign up from the “Here to Help” or “Return to Work” landing pages or via Qualtrics Surveys, the following applies:
- Customer Confidence Pulse, Digital Open Door, & Frontline Connect: The ability to launch new projects expires 90 days after the first of these projects has been launched AND has received a response or if the customer has hit their limit of 20k total free responses received (combined across the three solutions), whichever comes first.
- Digital Open Door: Unlimited page views.
Post expiration, customers will need to export their data within 6 months or upgrade to a paid CX product.
Existing Customers
For existing customers who have a CX5 license or a CX / RC license with rights to required features (e.g. CX 1/3 with a Digital add-on), the following applies:
- There currently is no time restriction around how many Customer Confidence Pulse, Digital Open Door, or Frontline Connect projects can be created.
- Upon reaching the limit of 20k total free responses received (combined across the three solutions), additional responses will be billed to the license.
Qtip: If you aren’t sure what license type you have or if you’re interested in upgrading, contact Account Services.
FAQs
How can I change the background/theme of my survey?
How can I change the background/theme of my survey?
I activated my intercept, but it‘s not showing up on my site. Why not?
I activated my intercept, but it‘s not showing up on my site. Why not?
- Logic: intercept targeting logic and action set logic are the conditions that must be met in order for an intercept to be displayed to a visitor. Checking this logic will be helpful in discovering why the Intercept is not displaying on a page.
- Logic sets that use “Contains”: A common cause of logic error is the use of the “Contains” vs. “Is.” To say a condition “Contains” means that the parameter you are basing the logic off (i.e., Current URL) will have the specified value present in addition to more information. For example, if I had logic that read as Current URL contains ‘qualtrics’, this would cause the intercept to display on any URL that has the word qualtrics present. The other option you have is using Current URL is [URL]. This condition depends on the visited URL being an exact match. Any differences or additional characters will prevent the intercept logic from passing.
- Intercept Revisions: When making edits to intercepts, changes are not made live until the intercept is published. When publishing an Intercept, a version of the intercept, or a “revision,” is saved. Reviewing the revisions that have been made is very useful for identifying any changes that may have suddenly prevented the intercept from appearing.
- Debug Window: The debug window is an invaluable tool for testing why an intercept is not displaying on a particular page.
For intercepts whose deployment code was implemented before March 2019, to enable the debug window, append a query string to any given URL called Q_DEBUG. This must be prefixed with a ? or a & like the following examples: https://www.qualtrics.com?Q_DEBUG, https://www.qualtrics.com/blog?item=value&Q_DEBUG.
For intercepts whose deployment code was implemented after March 2019, run the following JavaScript snippet in the Console of your web page:
 QSI.API.unload();
 QSI.isDebug = true;
 QSI.API.load();
QSI.API.run();Qtip: The Website Insights debugger does not function if the code has been implemented using a tag manager. Also, if the URL already has a query string with a ?, then the debugger will require a & instead. - Network Request: Most browsers possess a developer tools menu that allows a user to see a site’s source code, resources, cookies, and network calls. Website Insights possesses a distinct presence in the Network section of these tools. To check for these scripts running, open the developer tools and navigate to the Network section. Once here, reload the webpage and the menu should begin to populate with all network requests being made by the website. To identify Website Insights code, look for calls that begin with ?Q_ZID or ?Q_SID. This is the code itself running checks on the display logic. If you cannot find anything matching this format, then there is an issue with the implementation of your project code. You can refer to our support page on implementation for advice on where is best to place the code.
- Content Security Policy Issues: If you receive a console log that violates a Content Security Policy, there is most likely a restriction on your website that is blocking our intercepts from deploying. We recommend reaching out to your web-development team to resolve. To ensure your intercepts work, we generally recommend allowlisting the following items in your Content Security Policy headers:
- connect-src https://*.qualtrics.com
- frame-src https://*.qualtrics.com
- img-src https://siteintercept.qualtrics.com
- script-src https://*.qualtrics.com
- SPA URL Handling: If your site uses a single-page application (SPA) framework, make sure your code triggers history.pushState() when navigating between views. Some frameworks may re-render or update the URL without pushing a new history entry, which can prevent intercepts from firing. If you're using useEffect or similar lifecycle hooks, make sure your intercept logic runs after navigation is complete.
Is this COVID-19 XM Solution localized?
Is this COVID-19 XM Solution localized?
Although the guided setup cannot be translated at this time, you can upload translations to your survey or auto-translate using Google Translate as needed.
See the specific support page for each COVID-19 XM Solution for questions related to each solution's localization.
I noticed that in this XM Solution, there’s a question that says the respondent can sign up for email communications. Is that automatically built into the project?
I noticed that in this XM Solution, there’s a question that says the respondent can sign up for email communications. Is that automatically built into the project?
This question is meant to collect respondents’ names and email addresses in the event that your organization is able to provide communications on the changing COVID-19 situation. If you do not have the means to provide these communications to respondents, you can delete the question.
If you would like to save those who signed up for email updates in a contact list inside Qualtrics, see Adding Contact Information with the XM Directory Task. You can always export this contact list later.
If you’ve already collected data without setting up an XM Directory task, you can also go to Data & Analysis, filter by respondents who provided contact details, choose the contact columns, deselect Download all fields, and export the respondents straight from your survey.
If you would like someone in your organization to be alerted whenever someone signs up for email updates, you can set up an email task.
What will happen if I redo the setup assistant on my XM Solution?
What will happen if I redo the setup assistant on my XM Solution?
If you want to start the setup assistant over, do the following: Please note that if you want to start over from scratch, you can also create a new XM Solution instead.
Are there any premade text topics for analyzing my text responses about COVID-19?
Are there any premade text topics for analyzing my text responses about COVID-19?
Is this solution HIPAA compliant?
Is this solution HIPAA compliant?
If you have specific questions or concerns, we encourage you to seek your own legal advice about what additional steps, if any, you need to take to comply with applicable privacy laws or company policies. We have included suggested consent statements in these materials but you will need to confirm whether these statements are adequate or need to be modified to meet your specific needs.
That's great! Thank you for your feedback!
Thank you for your feedback!