
Benchmark Editor (EX)
What's on this page
About the Benchmark Editor (EX)
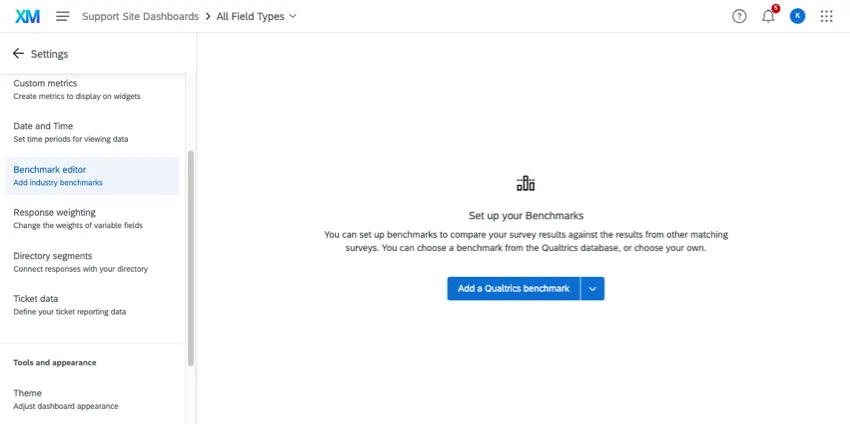
Benchmarks are a metric standard that enable you to understand how your results compare against industry peers or a global average. Within EX Dashboards they can be used to create goals based on your engagement survey scores.
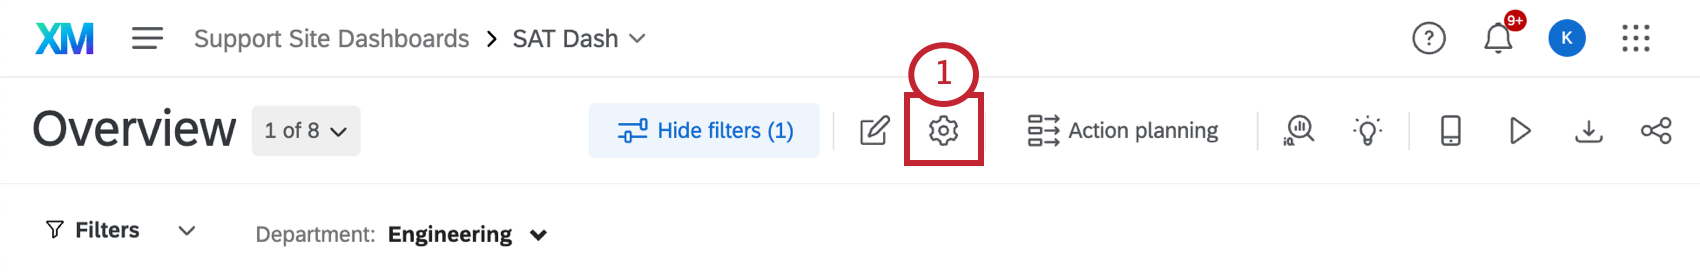
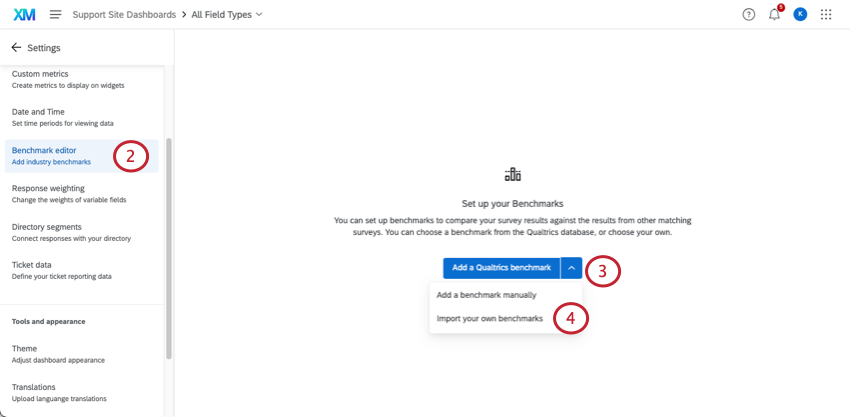
Benchmarks are added using the benchmark editor in dashboard settings. Once you add your benchmark data in the editor, you can then add these benchmarks to some of the widgets in your dashboard. Displaying your benchmarks in your widgets will allow you to display the target data you would like your organization to strive for. By easily comparing your actual data to the goal data, you can easily identify gaps in performance or opinions and use this information to make informed decisions on how your company would like to address each gap.
There are different types of benchmarks depending on how you want to present your data. See benchmark types for more information. The type of benchmark you choose determines which widgets you can use the benchmark in.
Types of Dashboards Supported
The benchmark editor is available in a few different types of dashboard. This includes:
Attention: The benchmark editor is available in a few different types of dashboard. However, this support page only covers how the benchmark editor works in Employee Experience dashboards. For CX Dashboards, see Benchmarks Basic Overview (CX).
EX Benchmark Types
When creating benchmarks, you upload benchmark data for each of your survey fields. You may use different benchmark types depending on how you want to compare data.
Qtip: You cannot enter or upload a benchmark value for a category within EX dashboards. Benchmarks for a category are automatically calculated based on the benchmarks assigned to the items (survey questions) within the category. While categories are often displayed as N/A in the benchmark editor, the calculated values will appear in widgets where you’ve added the benchmark. Note that benchmarks for categories will only appear in your widget if every item within that category has a benchmark value.
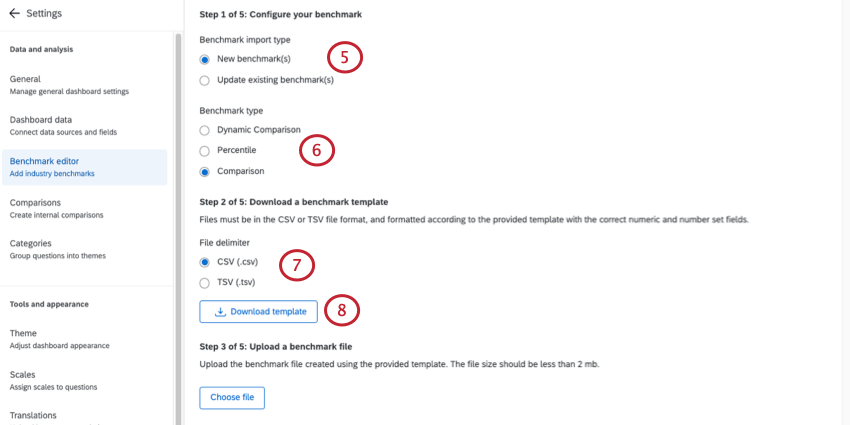
There are 3 different types of benchmarks you can import:
Dynamic Comparison: These benchmarks display the most relevant benchmark cut based on org hierarchy data. With this benchmark type, you must associate benchmark cuts with your org hierarchy units. Dynamic comparison benchmarks are most commonly used when the metric you are comparing against changes depending on the org hierarchy unit you are viewing. They enable comparisons that change context depending on the employee viewing them.

Attention: Dynamic comparison benchmarks are not available in Line & Bar Chart and Table widgets.

Qtip: Dynamic comparison benchmarks may only be the Top Box / Bottom Box metric type. The metric type determines which widgets the benchmark can be displayed in. See widget compatibility for more information.
Percentile: These benchmarks are used to bucket values into different percentiles. They contain a set of 100 values (or buckets) for a particular field. A value for a field, such as an average, is calculated from the response data and then the value is looked up in the percentile list to see what percentile bucket (one of the 100 in the list) it falls in, and then the bucket number (1-100) is displayed. For example, the 75th percentile reflects the survey score at which 75% of survey scores fall at or below.
Qtip: More data is required to calculate percentile benchmarks. Some survey questions may have an average benchmark score, but not a percentile benchmark score.
- Comparison: These benchmarks contain one number per survey field and are usually compared directly with some value calculated from an actual field, using the same metric type (e.g. Top/Bottom Box). Comparison benchmarks are the most common benchmark types, and are most useful when you are comparing everyone against the same metric.
Of the benchmarks created by Qualtrics research experts, you can choose from the following:
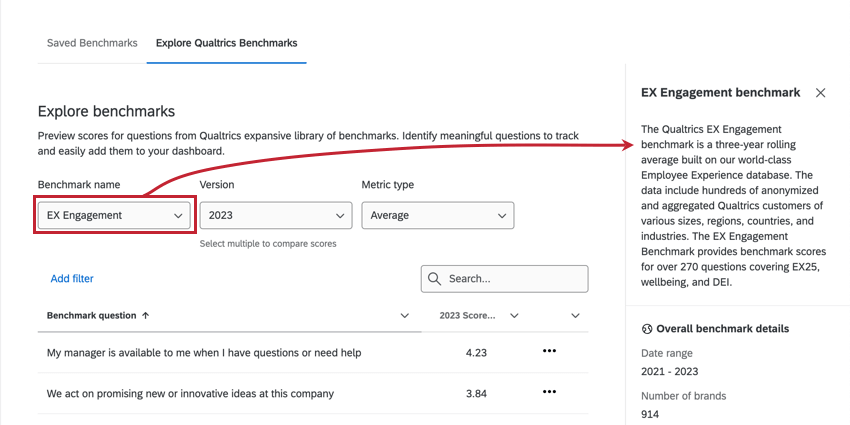
EX Engagement: Our 3-year rolling average EX Engagement benchmarks include over 300+ expert-designed items that are updated annually with real-world data from our clients to provide context on where you stand. Choose the most relevant benchmark for your industry, region, country, or company size, then select an average, percent favorable, or a percentile.
Qtip: For more information on engagement benchmarks, see this Qualtrics Learn course.
Qtip: Reach out to your account team for more information on requesting custom EX Engagement benchmarks.
Qtip: Region and country benchmarks represent all employees within the benchmark database that work within that region or country. If an employee works in the United States at the time of taking the employee engagement survey, they will be included in the United States benchmark.
- EX Healthcare: The EX Healthcare benchmarks are specially designed for employees working in the healthcare field. These benchmarks include survey response data from thousands of healthcare facilities across the U.S. and support designation programs such as Magnet® Nursing Excellence.
- Federal Employee Viewpoint Survey: The Office of Personnel Management Federal Employee Viewpoint Survey (OPM FEVS) assesses how federal employees experience the policies, practices, and procedures characteristic of their agency and its leadership. The OPM FEVS serves as a tool for employees to share their perceptions regarding critical topics including their work experiences, their agency, and leadership.
- Candidate Experience: This benchmark allows EX organizations to compare the performance of their candidate program against global norms.
EX Engagement Response Rate: High response rates can lead to better feedback; but too high, and there can be concerns of “over-encouraged” feedback, resulting in possibly insincere or dishonest feedback. Low response rates, on the other hand, can be an indication of organizational health, or of a lack of trust in the feedback process. The EX Engagement Response Rate benchmark can help you understand what a typical response rate should look like for your employee engagement surveys, and whether your response rates are average, better, or in need of improvement compared to peers. You can compare by key response rate factors, such as industry, company size, and survey length.
Qtip: The EX Engagement Response Rate benchmark can only be added as a one-time benchmark to EX Dashboards. This is not currently available in response rate widgets.
Most premade EX benchmarks are on a 5-point Likert scale.
Adding Individual Qualtrics Benchmarks
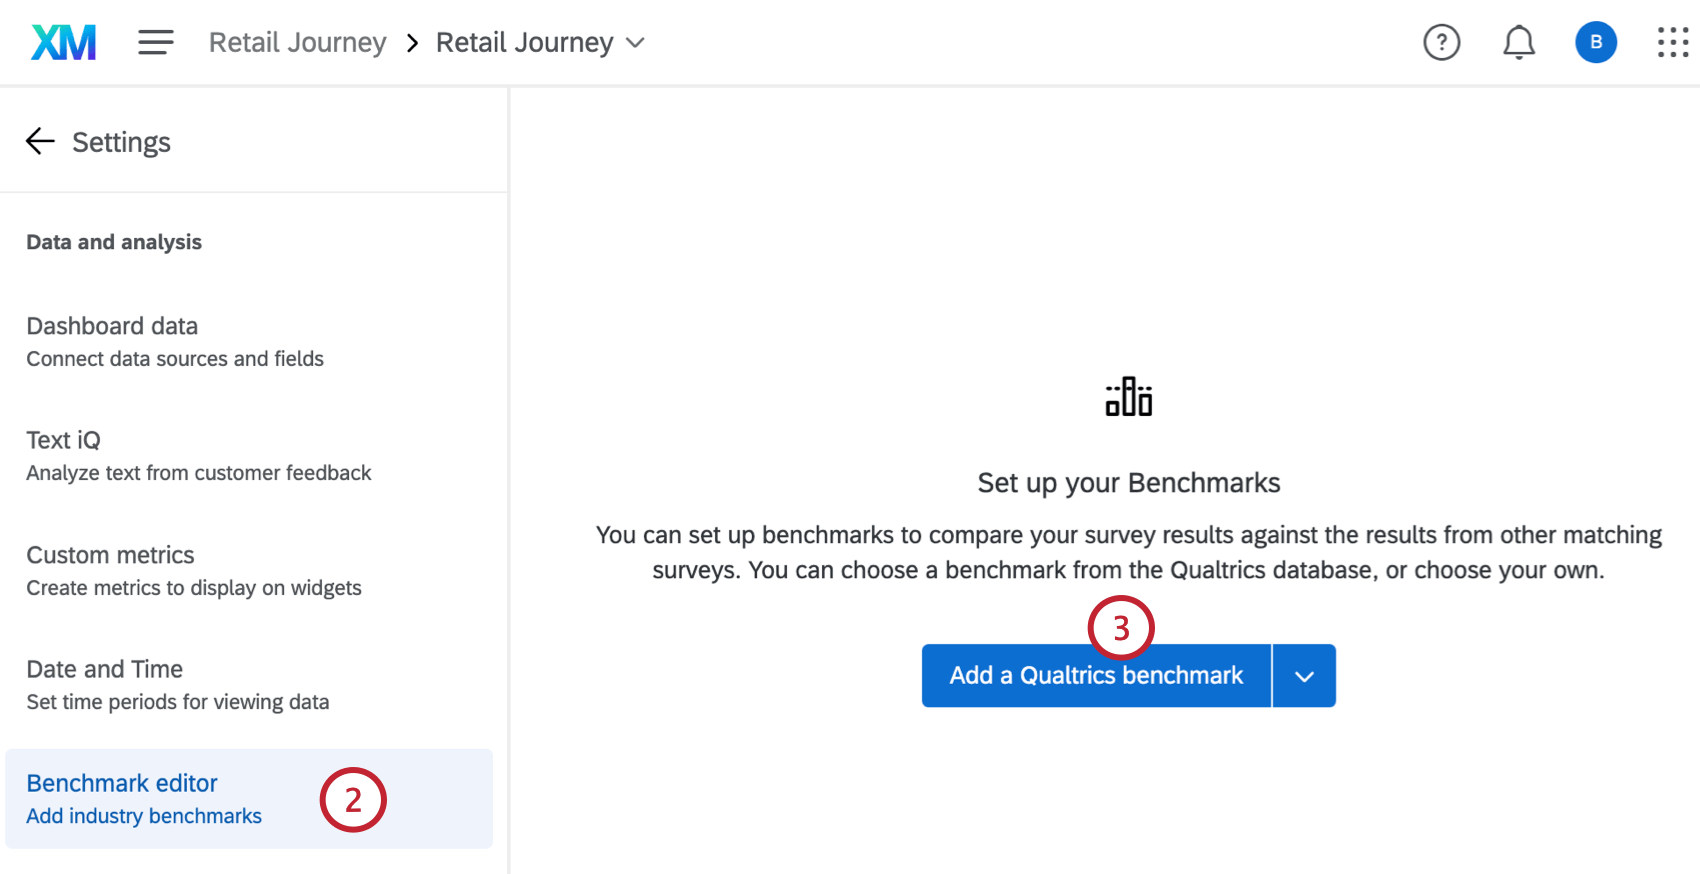
Qualtrics offers a variety of expert-designed benchmarks featuring industry data. You can preview Qualtrics benchmarks to see what’s included in them before adding them to your dashboard.
Qtip: You cannot create benchmarks for custom metrics.

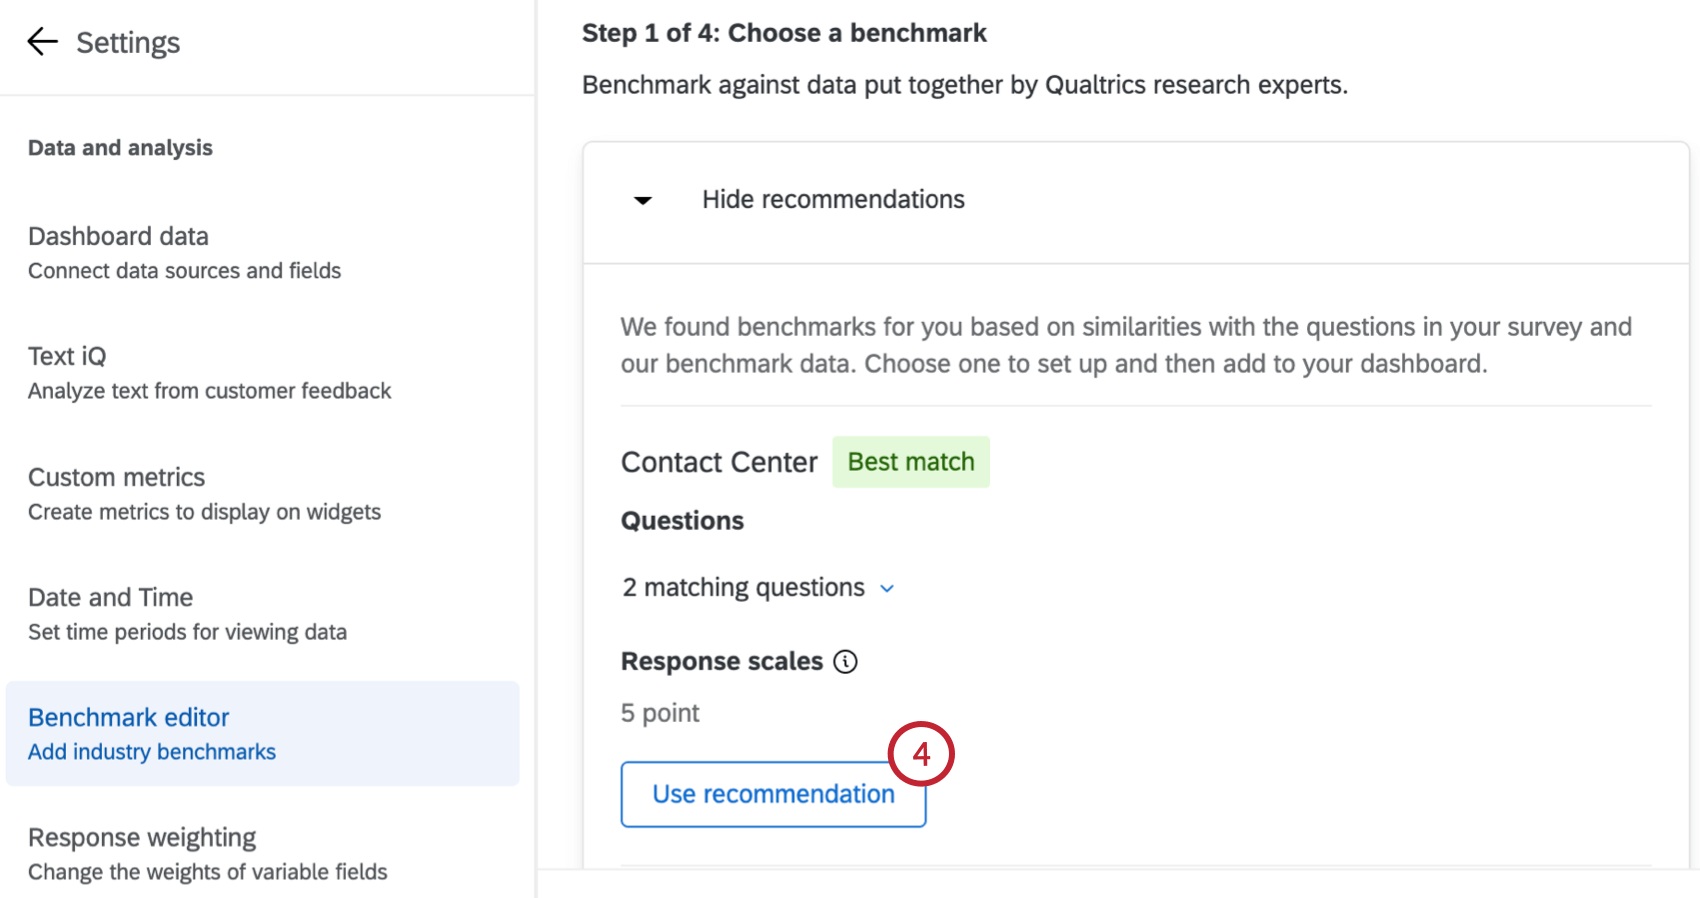
Attention: Benchmark Recommendations use a combination of machine learning and natural language processing techniques when making suggestions. Some considerations taken into account include if the suggested question text is similar to your question text, and if the number of response options in your response scale matches those in the benchmark response scale. Up to 3 of the most relevant matching benchmarks will be recommended.
Qtip: Click X matching questions to view the benchmark questions that match questions in your dashboard.
Qtip: To facilitate a secure and confidential collaboration with third-party LLM vendors, we prioritize strict privacy and security standards to safeguard our customers’ data. If you’re interested in learning more, see our dedicated security and privacy guide for AI.
While we have guardrails in place and are continually refining our products, artificial intelligence may at times generate output that is inaccurate, incomplete, or outdated. Prior to using any output from Qualtrics’ AI features, you must review the output for accuracy and ensure that it is suitable for your use case. Output from Qualtrics’ AI features is not a substitute for human review or professional guidance.
Qtip: Please note that Qualtrics EX benchmarks use a 5-point Likert scale. Survey questions should use the same scale to be compatible with benchmarks.
Qtip: Qualtrics benchmarks are typically refreshed annually.
Qtip: If you selected Percentile Rank, select a percentile between 1-99.
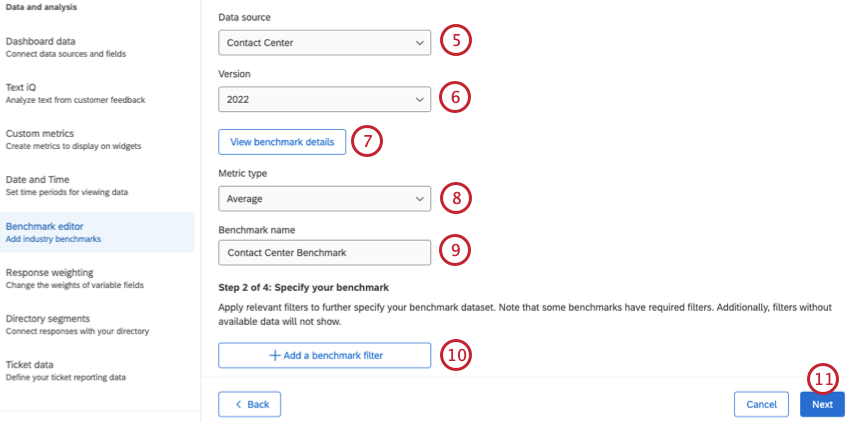
Attention: If you change the name of an existing benchmark it will change the name for all fields under the benchmark.
Attention: Some benchmarks have required filters.
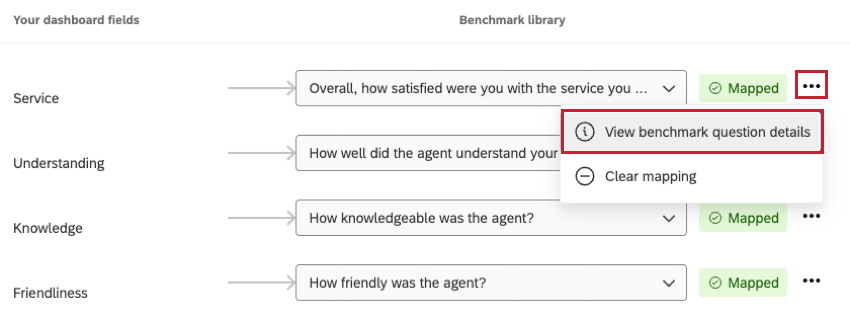
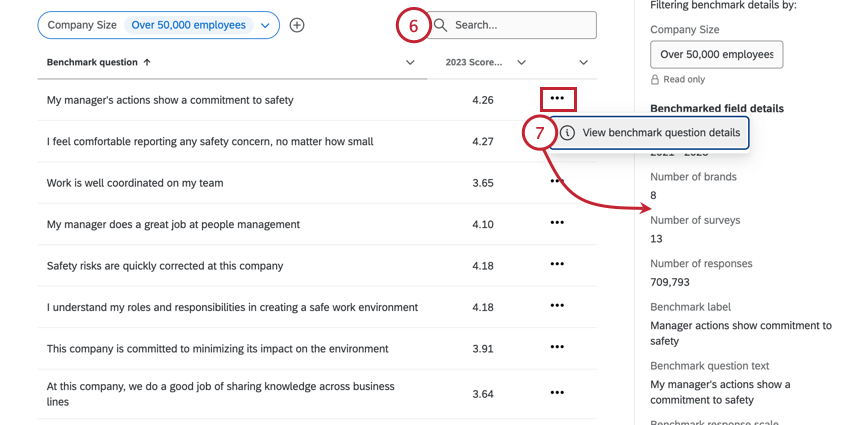
Qtip: To view additional details about each benchmark question, click the 3 horizontal dots and select View benchmark question details. This includes information about the data included in the benchmark, the response scale, and more. You can also view these details once your benchmarks have been saved.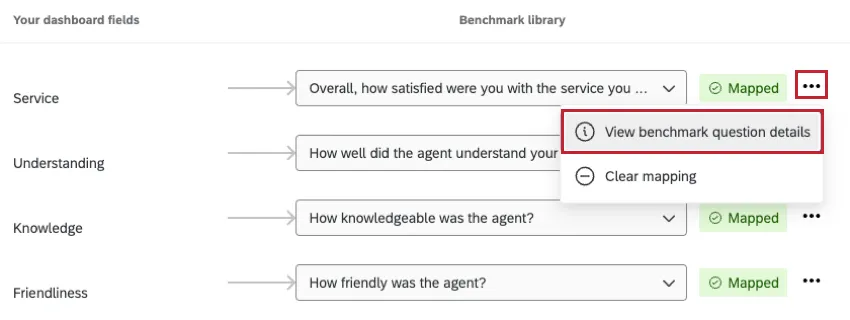
Attention: The field type must be a number set in order for it to be added to the benchmark editor.
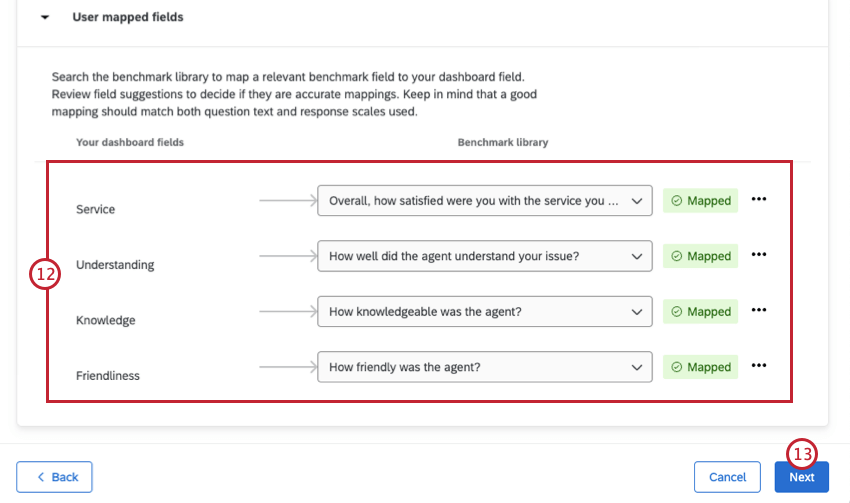
Qtip: Suggested mappings will show up if they are available. Review all suggestions to make sure they are accurate for your dashboard. If you have previously mapped benchmark items to dashboard fields within the same dashboard, this page will be pre-populated with the previous mappings.
Qtip: If you use standardized fields, like certified questions, or used a recommended benchmark, some of your fields may be mapped automatically.
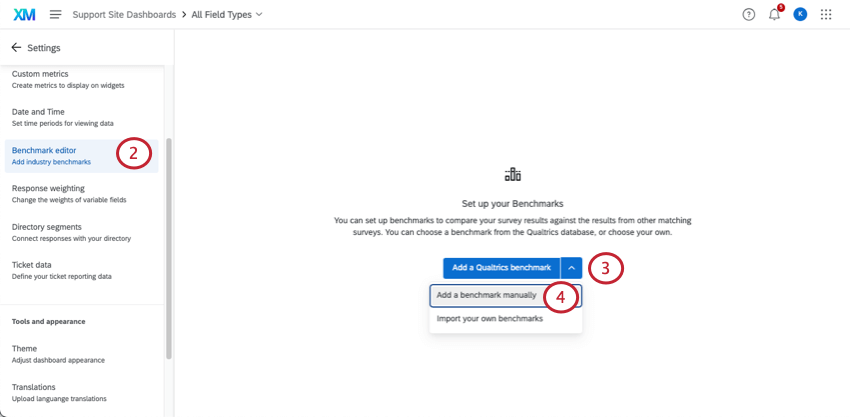
Adding a Benchmark Manually
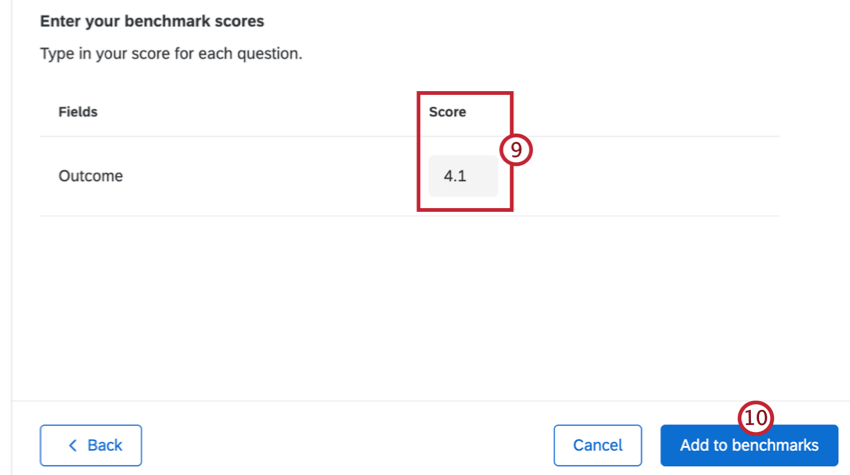
If you have benchmarks from another source, follow these steps to add them to your dashboard manually.
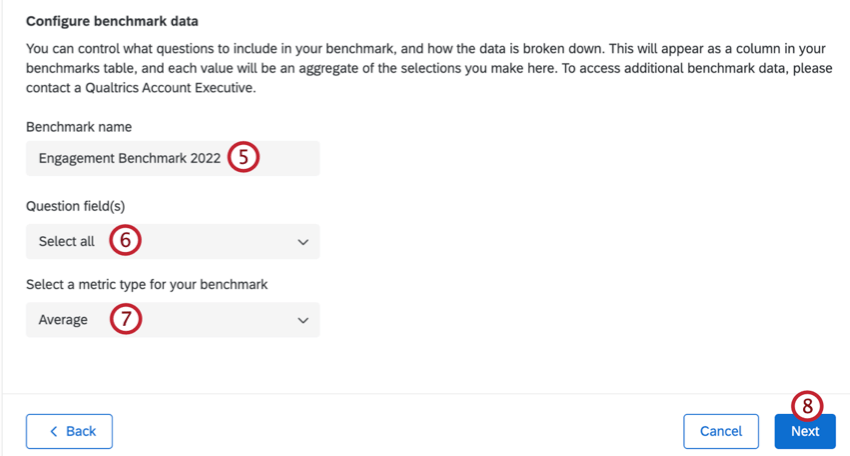
Attention: If you change the name of an existing benchmark it will change the name for all fields under the benchmark.
Qtip: Click Select all to select all benchmark fields.
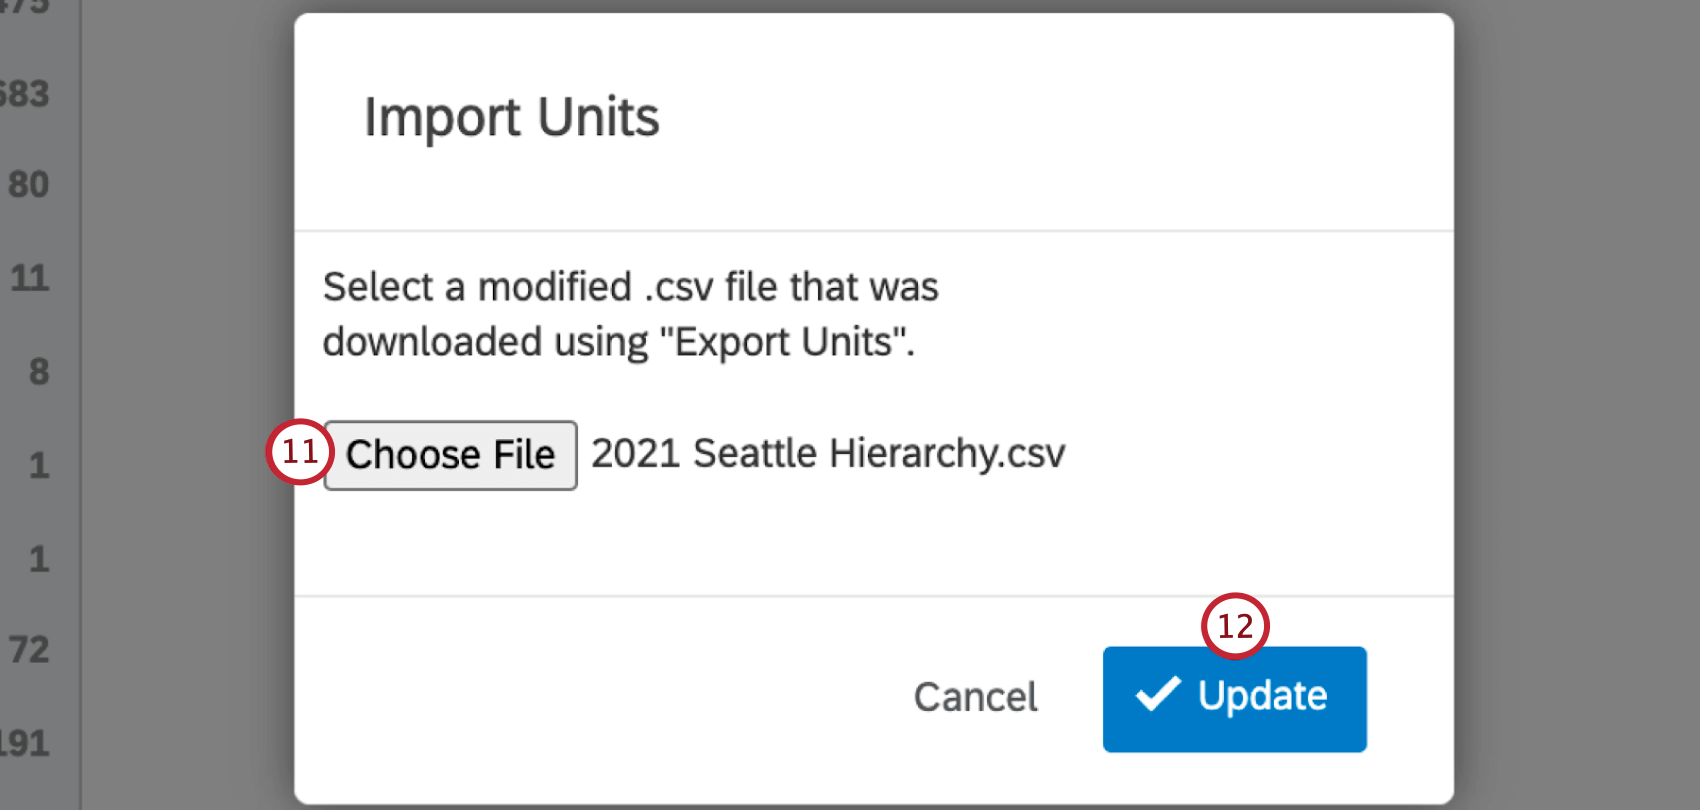
Creating and Updating Benchmarks in Bulk
If you need to upload benchmarks to your dashboard in bulk, you can upload them from a file. These steps will take you through how to get a template, prepare your file, and upload your benchmarks.
You can use this method to upload new benchmarks or update existing benchmarks.
Qtip: If you are updating an existing benchmark, select the benchmark you want to update.
Qtip: If you choose Dynamic Comparison as the benchmark type, follow the instructions at the end of this section to associate benchmark cuts with hierarchy units.
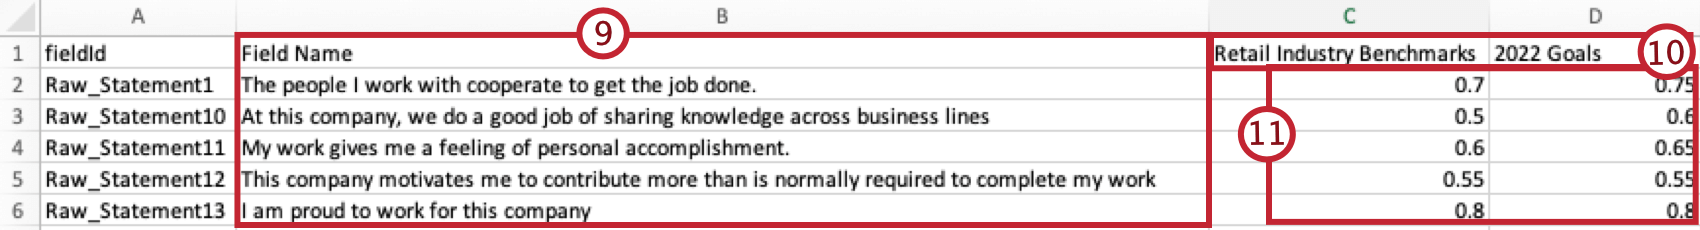
Qtip: This file doesn’t contain your existing benchmarks – only your numeric and number set fields. If you are updating benchmarks, you will have to reenter all values in your file.
Qtip: Check out your Dashboard Data page if there are fields that need their names or field types changed, or if you need to add a new field.
Attention: All fields that are included when exporting the template need to be included in the import file, even if they don’t have a benchmark value. Do not include any blank rows in your import file. Otherwise, you will see the error: “This file is missing field IDs or has invalid field IDs”.
Qtip: When adding percentile benchmarks to an EX dashboard, if you do not want to include a question, feel free to leave that column blank. However, you cannot have empty rows for a question; if adding a benchmark, you must include all 100 percentiles.
Qtip: When adding comparison benchmarks to an EX dashboard, the expected format for a comparison benchmark is 0.XX. The widget will interpret this as a percentage. For example, 0.3456 will be shown as 34.56% and 0.02 will be shown as 2%. 1.0 will be shown as 100%.
- CSV UTF-8 Encoded
- TSV
Qtip: TSV is recommended if your field names contain characters not used in the English alphabet. See TSV / CSV Upload Issues for troubleshooting help.
Qtip: If your file is too large you will be unable to upload it into the benchmark editor. You should upload smaller, separate files if needed.
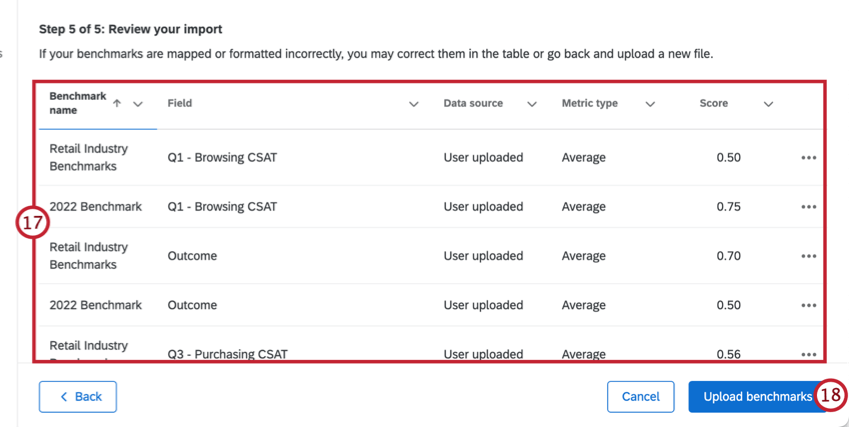
Qtip: If you need to edit a benchmark, click the 3 horizontal dots next to each row and select Edit benchmark field row.
Qtip: Click Back in the bottom-left to go back and adjust settings or upload a new file.
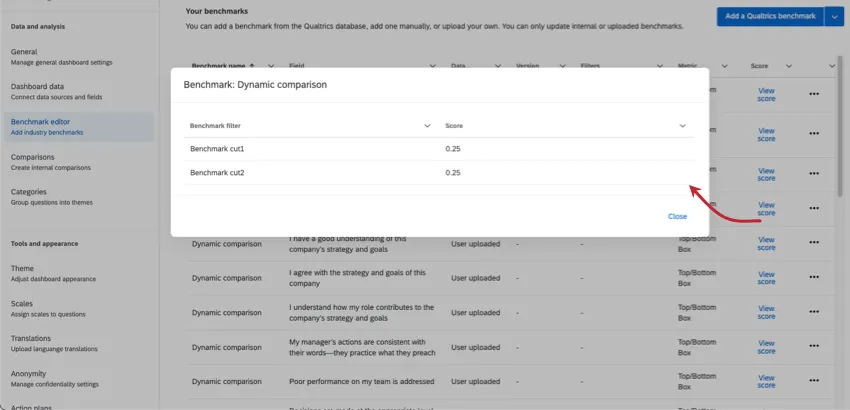
Dynamic Comparison Benchmarks
If you selected Dynamic Comparison as the benchmark type within an EX dashboard, follow these steps after setting up your benchmark to associate benchmark cuts with hierarchy units.
After your benchmark has been added, you can click View score next to any question field to see the benchmark cuts for that field.
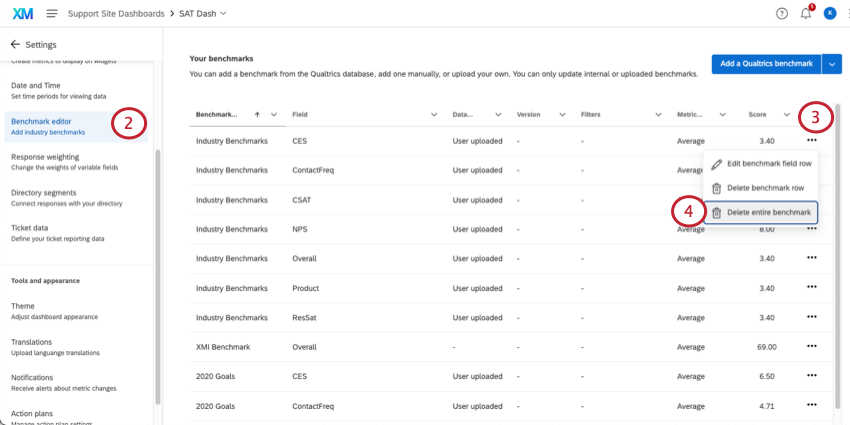
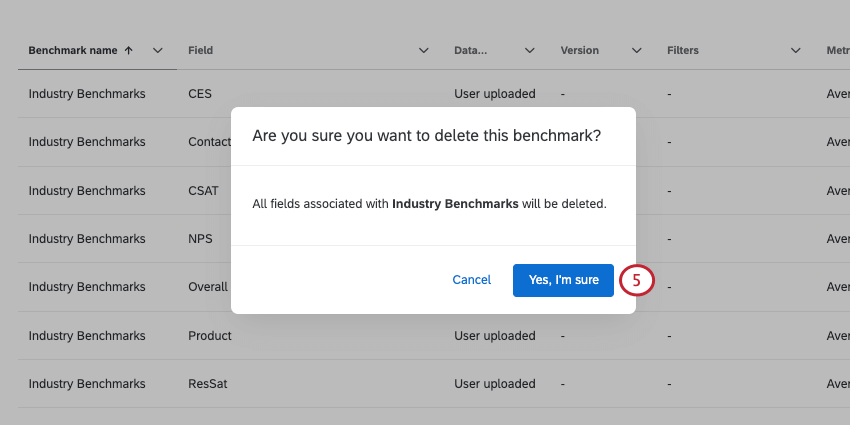
Removing Benchmarks
Follow these steps to remove a benchmark from the dashboard entirely:
Exploring Qualtrics Benchmarks
Before adding a Qualtrics benchmark to your dashboard, you can preview it to make sure it includes the right questions for your project.
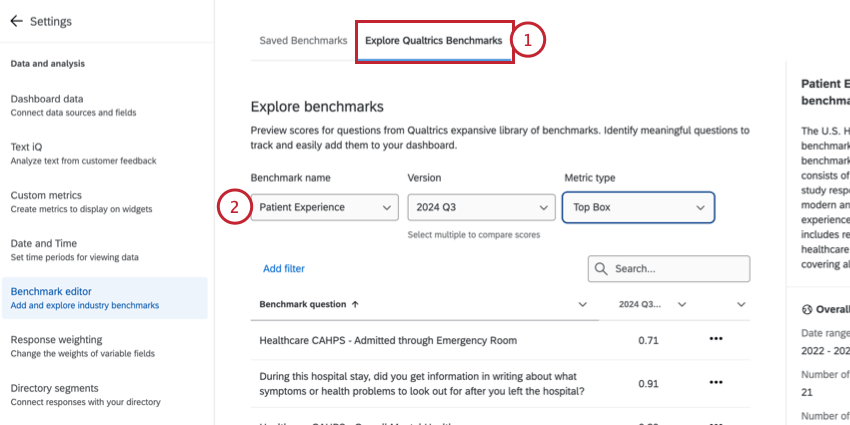
Qtip: You can read more information about the benchmark in the side panel to the right. This includes the methodology, number of responses, and date range.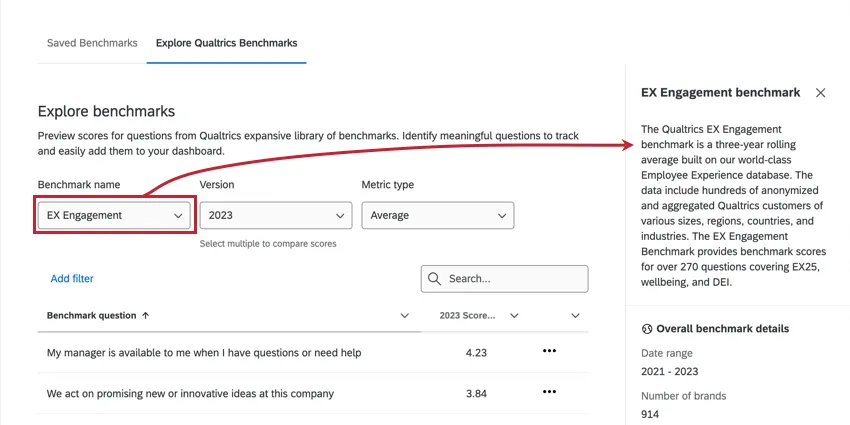
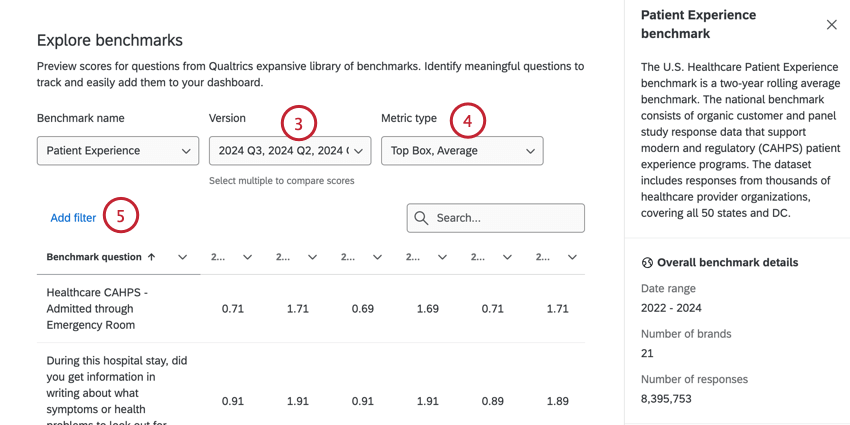
Filtering Benchmarks
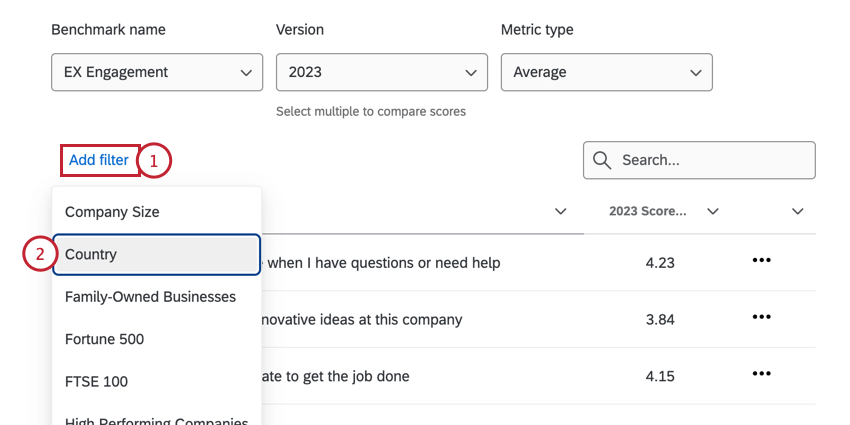
Qtip: The available filters will vary by benchmark. For example, the EX Healthcare benchmark does not contain an “industry” filter because the data is already specific to the healthcare industry.
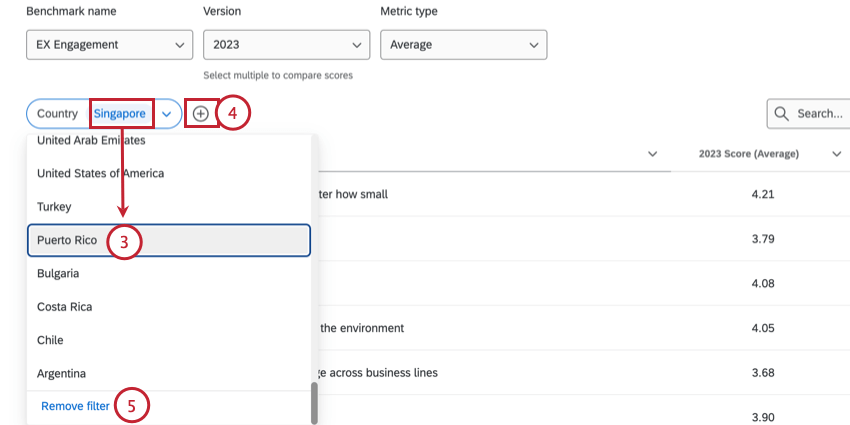
Qtip: You can only choose 1 value.
Mapping Benchmarks
Qtip: If you import a question from the Qualtrics XM Certified Library, the question will be automatically mapped to benchmarks, unless changes are made to the question.
When mapping your survey questions to Qualtrics benchmarks, it is important to make sure the question text and response scales you use closely match the benchmark fields to ensure valid comparisons. The following best practices should be used when creating and mapping questions to your Qualtrics benchmark fields.
Question Text
- Match the content of your question to the benchmark field you are mapping it to.
Ensure any organization references in your question are synonymous with references in the benchmark field.

Example: If the benchmark field uses the word “department”, ensure your question uses the same word or a similar word, like “business unit” or “function”.
- Consider the level of difficulty of your questions. Choose questions that are likely to provide objective feedback instead of questions that prompt favorable responses.
Ensure the specificity used in your question matches the benchmark field.
Example: If the benchmark field is “I receive feedback that helps me improve my performance” but your question text is “I receive ongoing feedback and coaching that helps me improve my performance”, reword your question to match the specificity of the benchmark. Using “ongoing feedback and coaching” is more specific than “feedback”, which is what the benchmark assesses.
Ensure the qualifiers used in your question match the benchmark field.
Example: If your benchmark field is “I would recommend this company as a place to work” but your question text is “I would recommend this company as a great place to work”, reword your question to remove the qualifier “great”, as the benchmark does not include this.
Ensure your question has the same tense as the benchmark field you are mapping it to. If a benchmark field assesses the respondent’s feelings in the present, make sure your question also asks about the present.
Example: If the benchmark field is “I am satisfied with career opportunities at this company” but your question text is “I am interested in growing my career with this company”, edit your question to match the tense of the benchmark.
- Don’t map the same benchmark field to multiple survey questions. If the same benchmark applies to multiple survey questions, the questions may be redundant. Consider combining or removing redundant questions from your survey.
Response Scales
- Use an approved response scale to ensure valid comparisons with benchmarks.
Make sure the response scale in your question matches the response scale of your benchmark. This includes both the scale labels and the number of scale points.
Qtip: The answer choice “Don’t know/Not applicable” can also be included in the scale because it doesn’t contribute to benchmark aggregations. To exclude these answer choices from analysis see Scales (EX Dashboards).
Make sure the wording and sentiment of the response scale in your question matches the wording and sentiment in the benchmark.
Example: The scale Strongly disagree-Disagree-Neither agree nor disagree-Agree-Strongly agree does not match the scale Strongly Disagree-Somewhat Disagree-Neither Disagree nor Agree-Somewhat Agree-Strongly Agree.
Approved Response Scales
Widget Compatibility
Qtip: See Displaying Benchmarks in Widgets for instructions on adding benchmarks to widgets.
Compatibility for EX Dashboards
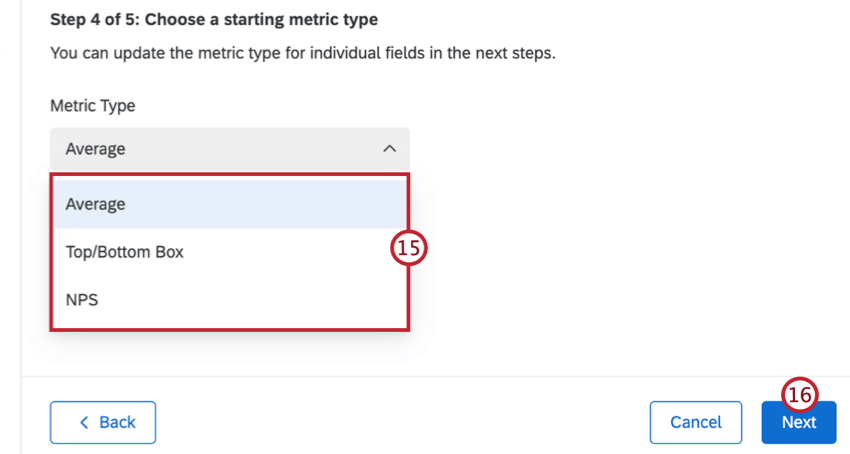
The type of benchmark you can use varies by widget. The metric selected when you set up your benchmark also varies in compatibility. The following tables will display what combinations you can use.
Dynamic Comparison Benchmarks
Comparison Benchmarks
| Average | Top Box / Bottom Box | NPS | |
|---|---|---|---|
| Heat Map Widget | Yes | Yes | No |
| Question List Widget | No | Yes | No |
| Demographic Breakout Widget | Yes | Yes | No |
| Gauge Chart Widget | Yes | Yes | Yes |
| Pie Chart Widget | Yes | Yes | Yes |
| Number Chart Widget | Yes | Yes | Yes |
| Horizontal bar, vertical bar, and line widget | Yes | Yes | Yes |
| Table widget | Yes | Yes | Yes |
| Key Drivers Widget | No | No | No |
| Scorecard Widget | Yes | Yes | No |
| Engagement Summary Widget | No | Yes | No |
| Bubble Chart Widget | No | No | No |
| Focus Areas Widget | No | Yes | No |
Percentile Benchmarks
| Average | Top Box / Bottom Box | Sum | Count | Minimum | Maximum | NPS | |
|---|---|---|---|---|---|---|---|
| Heatmap Widget | No | No | No | No | No | No | No |
| Question List Widget | Yes | No | No | No | No | No | No |
| Demographic Breakout Widget | No | No | No | No | No | No | No |
| Gauge Chart Widget | Yes | Yes | Yes | Yes | Yes | Yes | Yes |
| Pie Chart Widget | Yes | Yes | Yes | Yes | Yes | Yes | Yes |
| Number Chart Widget | Yes | Yes | Yes | Yes | Yes | Yes | Yes |
| Horizontal bar, vertical bar, and line widget | Yes | Yes | Yes | Yes | Yes | Yes | Yes |
| Table widget | Yes | Yes | Yes | Yes | Yes | Yes | Yes |
| Key Driver – Plot Widget | No | No | No | No | No | No | No |
| Scorecard Widget | No | No | No | No | No | No | No |
| Engagement Summary Widget | No | No | No | No | No | No | No |
| Bubble Chart Widget | No | No | No | No | No | No | No |
| Focus Areas Widget | No | No | No | No | No | No | No |
| Comparison Widget | Yes | No | No | No | No | No | No |
Error Messages
You’ll receive an error message if your uploaded file failed to update participants. This section includes the error messages as well as some troubleshooting tips to help you resolve each error.
FAQs
Can I revert changes I made to my benchmark source in my EX dashboard?
Can I revert changes I made to my benchmark source in my EX dashboard?
How do I get my benchmark to be the last comparison item in my widget in my EX dashboard?
How do I get my benchmark to be the last comparison item in my widget in my EX dashboard?
How are industry benchmarks defined?
How are industry benchmarks defined?
Why don't I see a benchmark for my question?
Why don't I see a benchmark for my question?
What companies are in the Qualtrics EX Engagement Benchmark Database?
What companies are in the Qualtrics EX Engagement Benchmark Database?
How often are EX Engagement Benchmarks refreshed or updated?
How often are EX Engagement Benchmarks refreshed or updated?
Are the EX Engagement Benchmarks based on panel data?
Are the EX Engagement Benchmarks based on panel data?
What is a rolling benchmark?
What is a rolling benchmark?
Is there a single year EX benchmark?
Is there a single year EX benchmark?
How are scores calculated for the EX Engagement Benchmark?
How are scores calculated for the EX Engagement Benchmark?
Is my company included in the EX Engagement Benchmark Database?
Is my company included in the EX Engagement Benchmark Database?
- Be an employee engagement survey
- Utilize questions and response scales that align with the XM Certified Library
- Be conducted within the designated timeframe for the benchmark
- Fulfill additional requirements, such as a minimum number of respondents
Does Qualtrics have demographic or role-based EX Engagement benchmarks?
Does Qualtrics have demographic or role-based EX Engagement benchmarks?
Does Qualtrics have lifecycle benchmarks for Onboarding and Exit surveys?
Does Qualtrics have lifecycle benchmarks for Onboarding and Exit surveys?
That's great! Thank you for your feedback!
Thank you for your feedback!