-

Qualtrics Platform -

Customer Journey Optimizer -

XM Discover -

Qualtrics Social Connect
Adding & Removing Advanced-Reports Visualizations
Adding Visualizations
You can add visualizations from a few different spots.
- Click Insert on the menu bar to add a visualization to the end of the page.
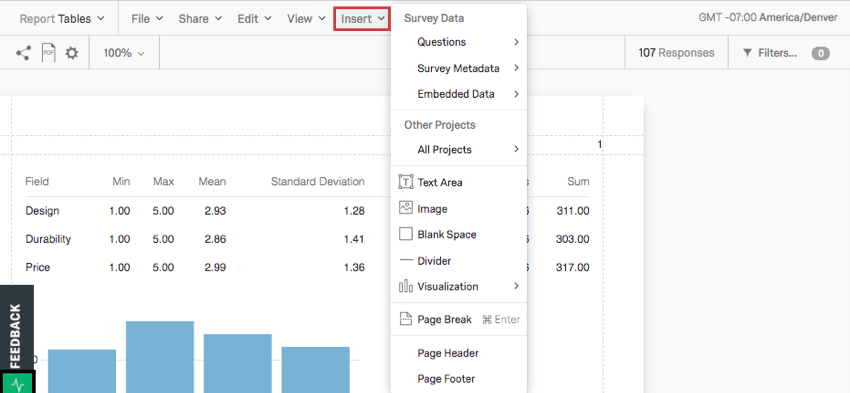
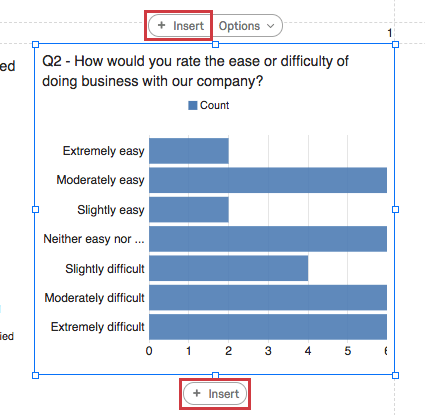
- Click a visualization and then one of its Insert buttons to add a visualization above or below the existing one.
Once you click Insert, a menu will open up, giving you several options for how you insert your visualization. What component is set first is based on the selection you make.
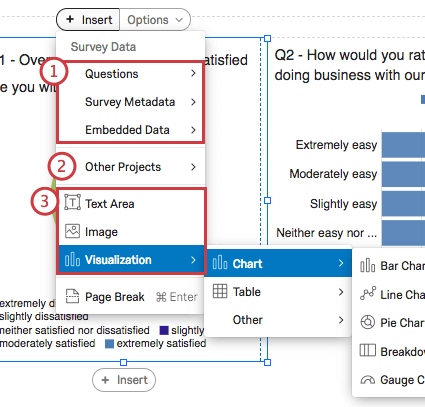
- Choose the question, Embedded Data, or survey metadata providing the visualization’s data first. If you choose this option, then you will need to set the visualization type manually. The options of visualizations will only be those compatible with your choice.
- Click Other Projects to choose the project the data is coming from first. This option is best if you’re pulling data from another survey.
- Choose the visualization or type of object to insert first. If you choose this option, then you will need to set the visualization’s data source manually. Text Areas and Images don’t require data sources.
Qtip: Adding a visualization to a report does not guarantee that data you’ve collected is compatible with it. For example, Heat Map visualizations are only compatible with Heat Map questions. If your survey only contained Multiple Choice questions, you will not be able to put a data source into a Heat Map visualization.
Removing Visualizations
Warning: You cannot get a visualization back after you remove it!
You can remove one visualization at a time, or remove multiple visualizations at once.
You have three options for removing a single visualization:
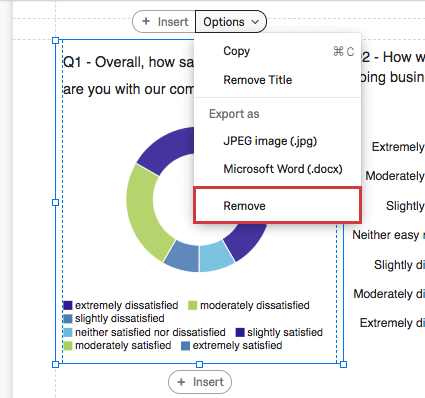
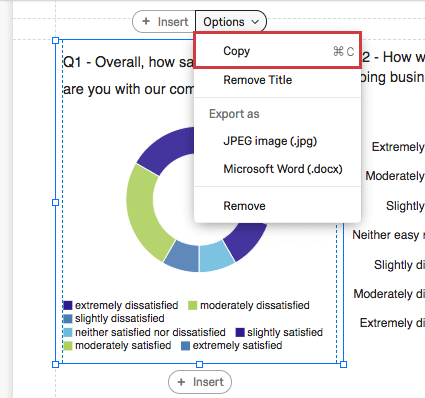
- Click on the visualization, then click Options and choose Remove.
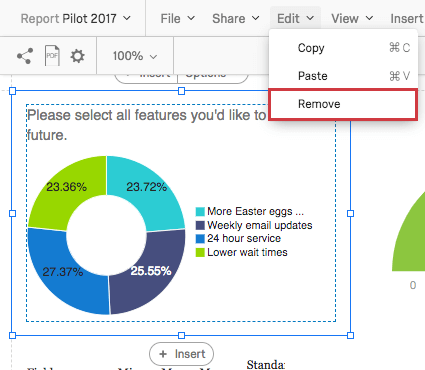
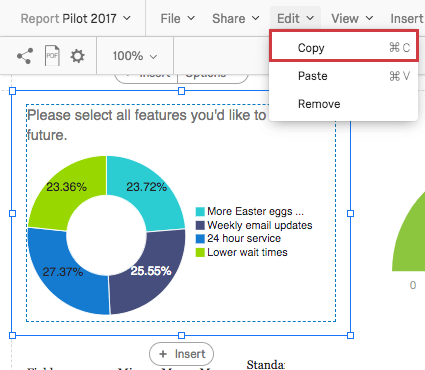
- Click on the visualization, then click Edit and choose Remove.
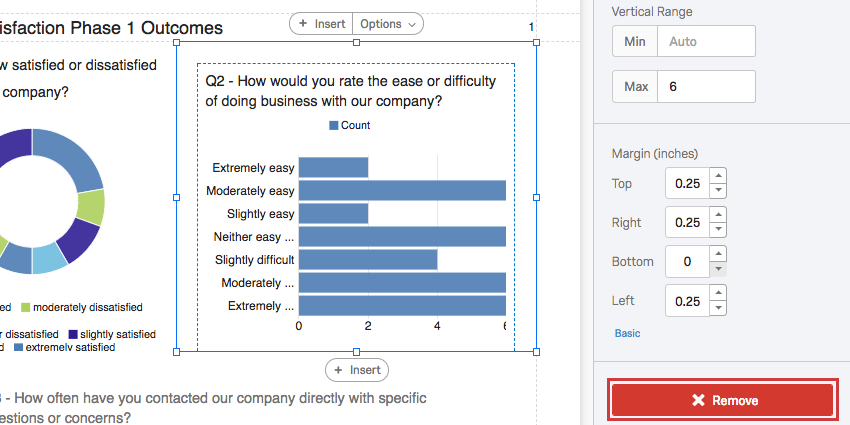
- Click on the visualization, navigate to the bottom of the visualization editing pane, and then select Remove.
You can also remove multiple visualizations at once by following these steps:
- Click on a visualization to select it.
- Hold the Shift key on your keyboard.
- Click the additional visualizations you’d like to remove. Selected visualizations will be outlined.
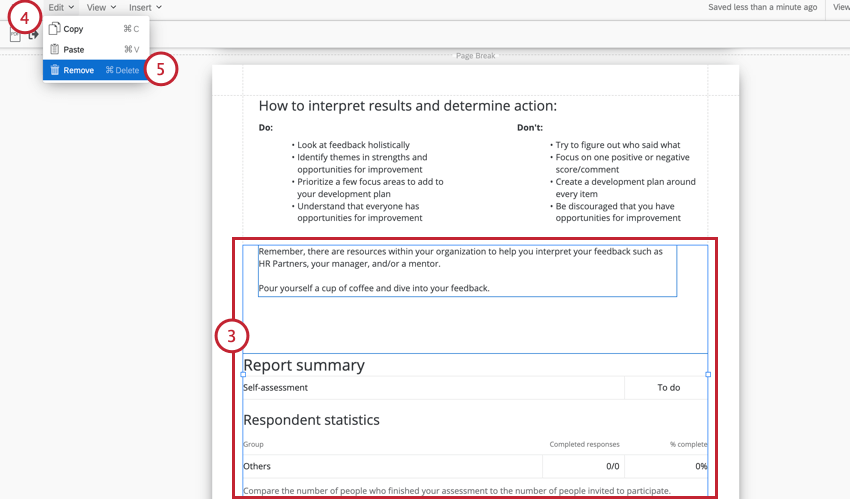
- Click Edit in the report toolbar.
- Choose Remove.
Qtip: Instead of using the Edit menu, you can also press CTRL+SHIFT+DELETE on your keyboard to remove selected visualizations.
Copying and Pasting Visualizations
You have two options for copying visualizations.
- Click on the visualization, then click Options and choose Copy.
- Click on the visualization, then click Edit and choose Copy.
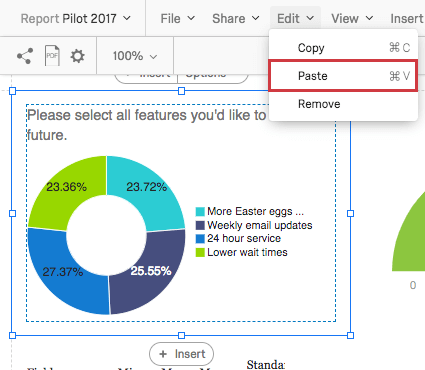
To paste one visualization over another, click the visualization, click Edit, then select Paste.
Qtip: You have to click on an existing visualization before you can copy and paste.