
Step 2: Building Your 360 Survey
What's on this page
About Building Your Survey
The next step in preparing your 360 project is to build your survey. This section will walk you through how to format your project and build the survey in the platform.
Choosing Question Types
Once you have your questions and categories determined, you’ll want to think about the question types you will use. The right question type can make all the difference for participants taking the survey and for reporting on your results.
Qualtrics offers many question types, but the best practice is to use Matrix Table, Multiple Choice, and Text Entry questions. For additional information, visit the Question Types support page.
Below is a guide to the compatibility of the available questions in the 360 platform with report visualizations and scoring categories. We recommend using questions which are compatible with graphs, tables, and scoring categories in order to maximize the reporting capabilities of the feedback gathered.
| Pulls in results well with…. | Scoring Categories are Compatible | ||
|---|---|---|---|
| Question Type | Graphs | Tables | |
| Multiple Choice | Yes | Yes | Yes |
| Matrix Table | Yes | Yes | Yes |
| Text Entry | No | Yes | No |
| Slider | Yes | Yes | Yes |
| Pick, Group, & Rank | No | Yes | No |
| Constant Sum | No | Yes | No |
| Rank Order | Yes | Yes | No |
| Side by Side | Yes | Yes | Yes |
Building Your Survey Questions
Once you have your question set prepared, it is time to add them to your 360 survey. For additional information, visit the Creating & Editing Questions support page. If you have built a survey in another Qualtrics product before, you will find that adding questions follows very similar steps.
Qtip: We recommend limiting text entry questions to 5,000 characters to ensure data displays properly in the report.
Advanced 360 Options & Best Practices
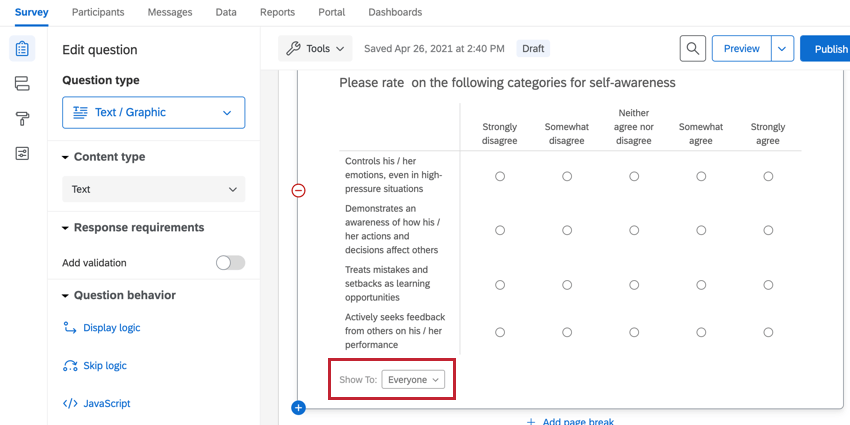
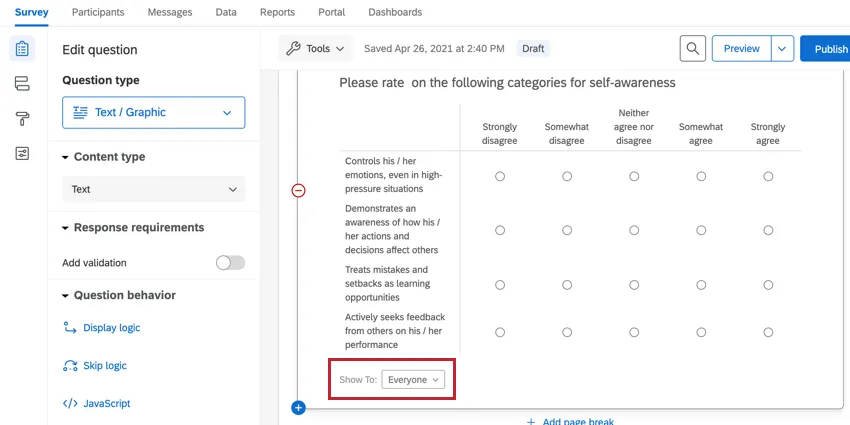
“Show To” Functionality (Quick Add Display Logic)
Sometimes in 360 projects there will be a need to direct certain participants to separate questions. This can be achieved with the survey flow, display logic, and/or skip logic. See the linked support pages for additional information on these features.
However, in 360 we can also use the Show To (Quick Add Display Logic) feature along with Subject Smart Text to achieve this.
Quick Add Display Logic is extremely useful when showing completely different content based on relationship. For more information on how to use this feature, visit the Quick Add Display Logic section.
When Not to Use “Show To” Functionality
The use of Quick Add Display Logic is typically limited to introduction instruction messages (added with the text / graphic question type) and Text Entry questions which may only be shown to evaluators.
We recommend showing all quantitative questions to all evaluators (including self-evaluations), in order for the data to be directly comparable in reports and raw data. Gap Chart in the subject report are dependent on the subject and their evaluators answering the very same quantitative questions.
Instead of creating two separate questions to customize the look of the question for its different audiences (which will compromise your reporting capabilities), consider using Subject Smart Text instead (which you can read more about below).
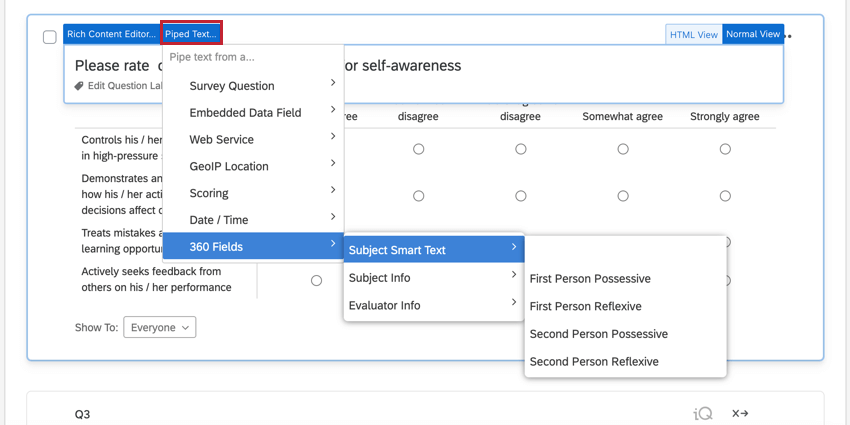
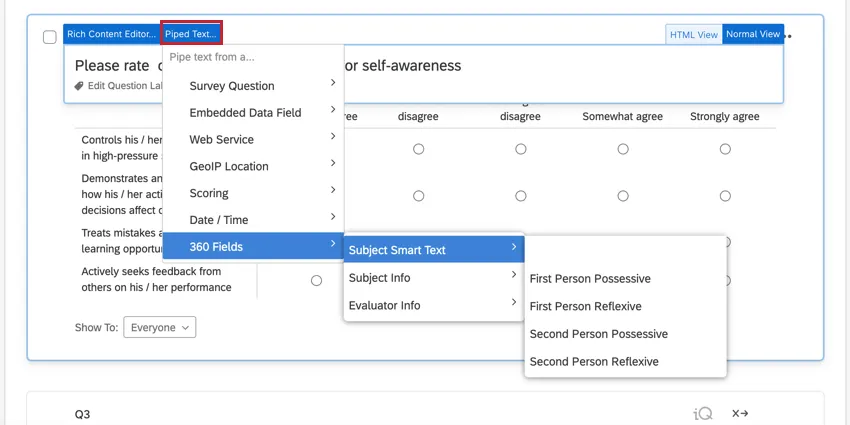
Subject Smart Text
As noted above, we recommend keeping questions together within a 360 form so they are directly comparable in the data and in reports. Subject Smart Text allows the question to appear relevant depending on whether the subject or the evaluator is looking at it. You will find Subject Smart Text in the Piped Text menu under 360 Fields. You can learn more about how to use this feature in the Piped Text section.
Customizing the Look & Feel
Within Qualtrics, the Look & Feel refers to the colors, fonts, and other stylistic options available for survey taking. See the Look & Feel support page for more details.
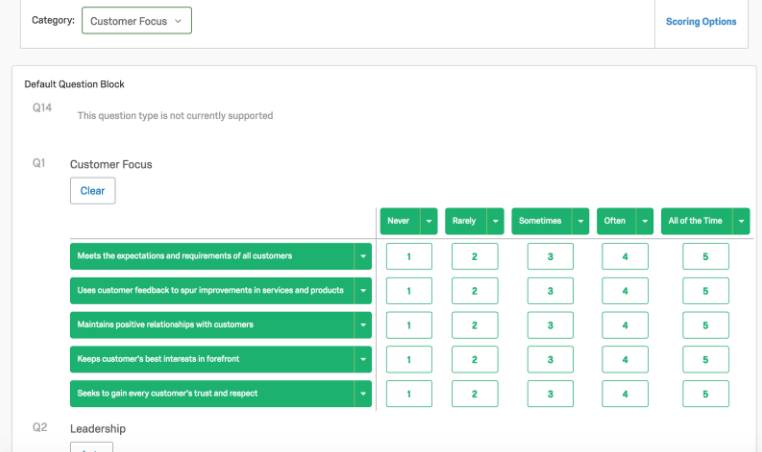
Scoring
Scoring is used to specify the values with which quantitative questions will contribute to specific scoring categories. This will allow you to show an aggregated value across defined scoring categories and subcategories, which are then used in the subject report. You can set up scoring by going to the survey options and selecting Scoring.

Scoring is used in both employee-focused surveys and research-focused surveys. See the Scoring support page for a full breakdown of the available options.
Qtip: The Scoring support page linked above is also for standard Qualtrics surveys, not just 360 surveys. While some content may look slightly different when creating your 360 survey, feature functionality remains the same.
Note that scoring is useful for showing aggregated values, however, the questions have inherent coded values independent of the scoring values that are also used in 360 reports for looking at averages of individual items. It is recommended that these are consistent with the scoring to avoid confusion. See the section regarding recode values for details on changing the values.
Translating Your Project
360 projects often encompass multiple regions and countries, therefore, it is important to prepare the project for different languages. The 360 platform allows the participant to nominate, take surveys, receive emails, and view reports in their native language. You can find a list of the sections available for translation below, as well as details on how to translate each item:
-
- If you decide to use custom relationships outside of the default ones provided in 360, these will also need to be translated. You can find instructions in the Manage Relationships section. Translations can be added in manually or automatically translated.
- To define in what language a participant receives their email invite and what the default language in their participant portal will be, a language code will need to be assigned to them as metadata field upon import. The header should be named Language and the codes that can be assigned are detailed in the Available Language Codes section.
Qtip: Pay close attention to different variations of similar codes (e.g., English UK, US, and Spanish variations) as these need to be used consistently throughout the project.
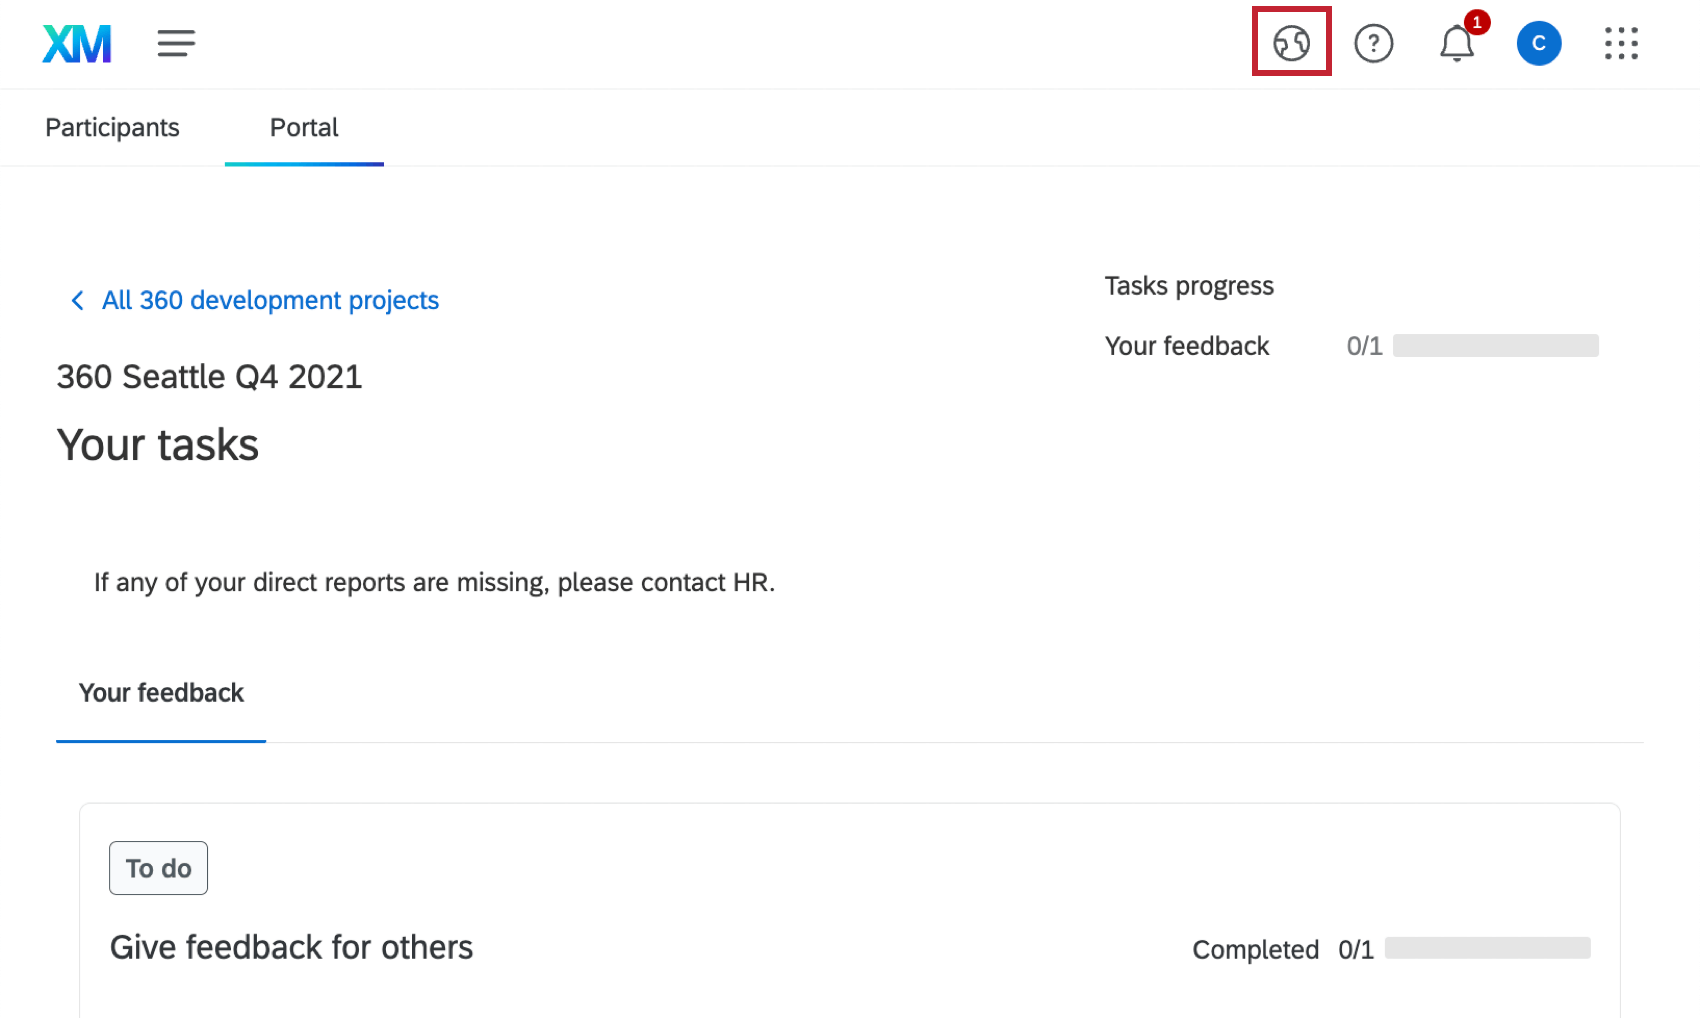
Qtip: Missing certain languages from the languages menu, or missing the globe icon altogether? See this support page to make sure the language is enabled for the portal.
FAQs
How can I stay up to date on new Qualtrics features?
How can I stay up to date on new Qualtrics features?
To access these release notes, you need an XM Community account. These accounts are free for any users with a Qualtrics account. This support page contains information for how to register an XM Community account.
Once you're logged into the XM Community, head over to the Weekly Product Updates Introduction Post. This post contains all the information you need to get started with subscribing to product updates!
That's great! Thank you for your feedback!
Thank you for your feedback!