-

Qualtrics Platform -

Customer Journey Optimizer -

XM Discover -

Qualtrics Social Connect
Building Dashboards with Social Data
About Building Dashboards with Social Data
Once your social data has loaded in your dashboard, you can customize the dashboard however you want. We have many dashboard support pages across this website that you can use. However, to make things easier, we’ll show you some common widget setups used specifically with social data.
Before you can customize your social dashboard, you need to create your dashboard and map your social data. See also the list of social data available and recommended field types.
General Dashboard Resources
In the next few support pages, we’ll cover some useful dashboard setups that can help you make the most of your social data. However, you’re also free to use the data however you want. Below, we have some general dashboard resources that can be helpful:
- Creating CX Dashboard Pages
- Building Widgets
- Filtering CX Dashboards
- Text iQ in Dashboards
- Stats iQ in Dashboards
- Managing Dashboards within a Project
- Sharing and Administering CX Dashboards
- Setting Up Dashboard Viewer
As we go through the following use cases, we’ll also link out to widgets and functionality, such as bar widgets, response tickers, Text iQ in dashboards, and more.
Displaying Top-Ranked Social Posts
In this section, we’ll show you how to display the top 5+ social media posts with the most engagement.
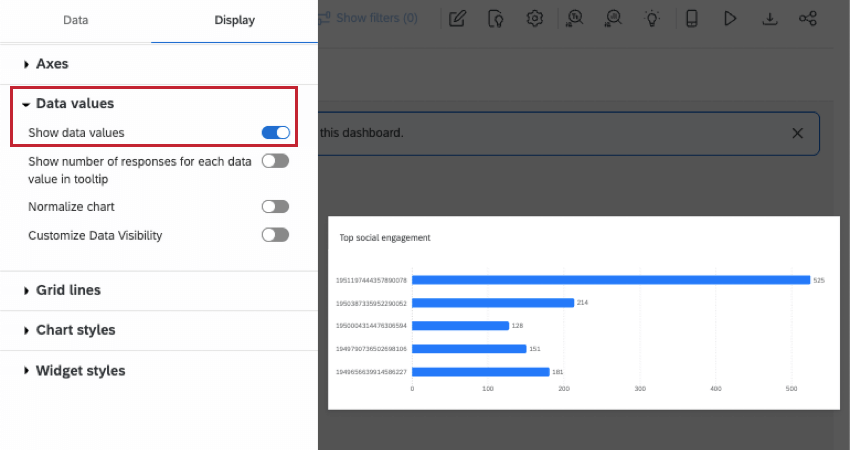
- Create a horizontal bar, vertical bar, or table widget.
- For the Metric, we recommend a sum of comments or likes.
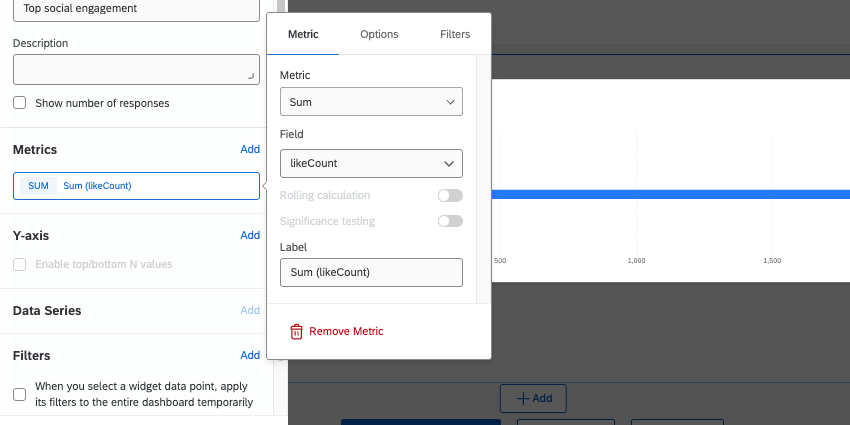
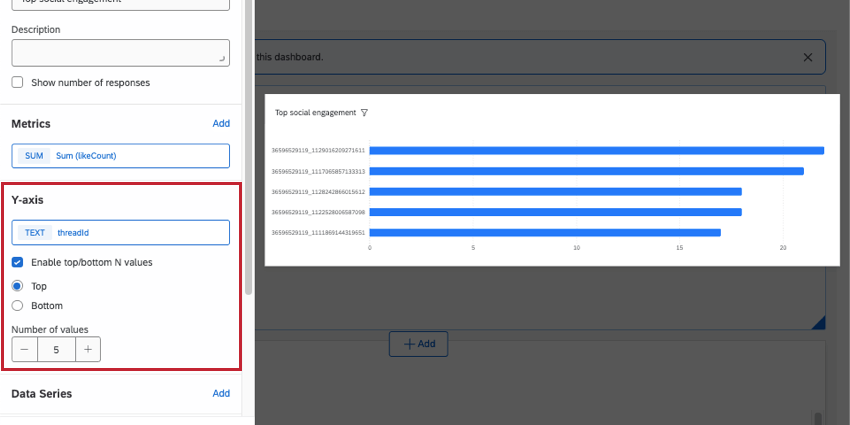
- Set your Y-Axis to threadId.
 Qtip: Make sure threadId is set to the Text Set field type.
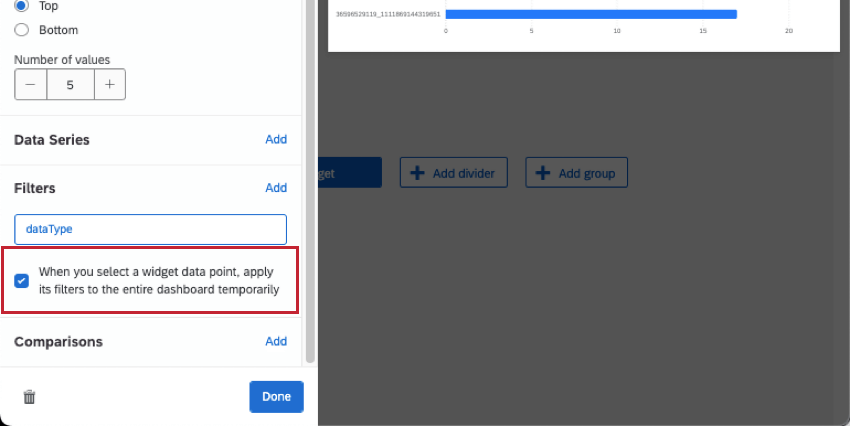
 - Select Enable top/bottom N values.
- Select Top.
- Set the number of top posts you want to see. Here, we chose 5.
- Add a Filter.
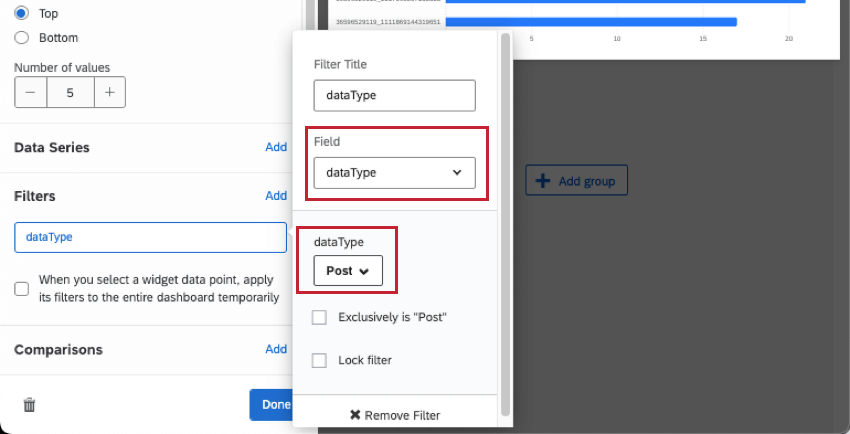
- Select the field for dataType.
- Set the value to Post. This makes sure you’re focusing on individual posts, instead of comparing posts to comments and replies.
- Go to Display.
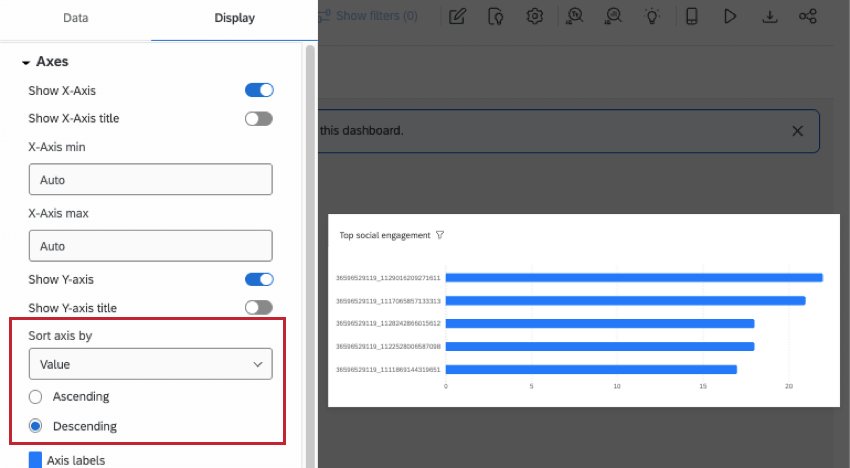
- Open Axes.
- Under Sort axis by, set this to Value and Descending.
Qtip: On a table, you can click headers to change how the widget is sorted.
- Under Data values, you can also display exact counts so bar charts are easier to skim.
Show the specific social media post when an ID is selected
By letting the top ranked posts widget act like a filter, you can let dashboard visitors click on post IDs to learn more. (And click again to remove the filter.) You can use this functionality to display the text of the post itself as well as other information about the post.
- Edit your top-ranked posts widget.
- Select When you select a widget data point, apply its filters to the entire dashboard temporarily.
- Add a response ticker widget.
- Set the Content to the Content field.
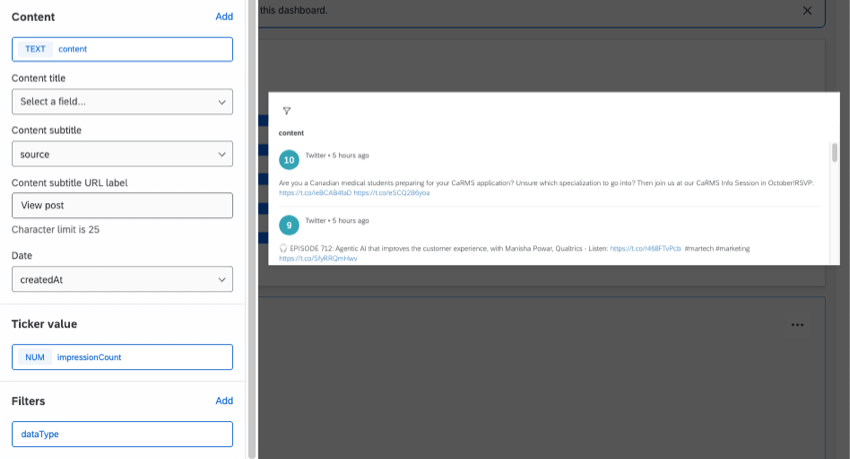
- For the other fields, you can add whatever details you want. For example, any of the “count” fields could be the ticker value, and the subtitle could be the social media source.
- Add a Filter.
- Select the field for dataType.
- Set the value to Post.
Analyzing Social Media Posts with Text iQ
Comments tend to have a varying range of content, which makes use of Text iQ and its enrichments a great choice for analysis. Using Text iQ, you can uncover trends in your brand’s social media activity.
The field you’ll analyze in Text iQ is content, since this is where the text of the post or review is stored. For step-by-step guides to text analysis and related dashboard widgets, see the following:
Analyzing All Posts and Comments in a Thread
You can view a post and all of its related comments using the field called threadId. The threadId is the same for all posts and comments that come from the same thread.
Creating a dashboard filter
- Create a dashboard filter.
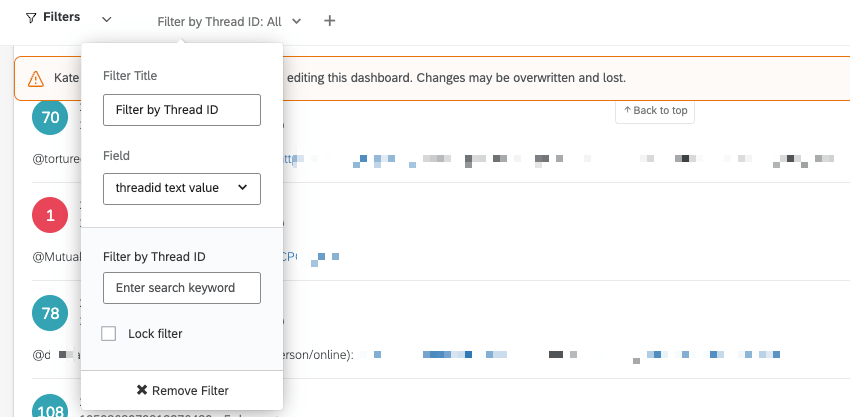
- Set the field to threadId.
- You can rename this field to something simpler to understand, like “Thread ID Filter.”
- Once this is set up, your dashboard visitors can now use the filter.
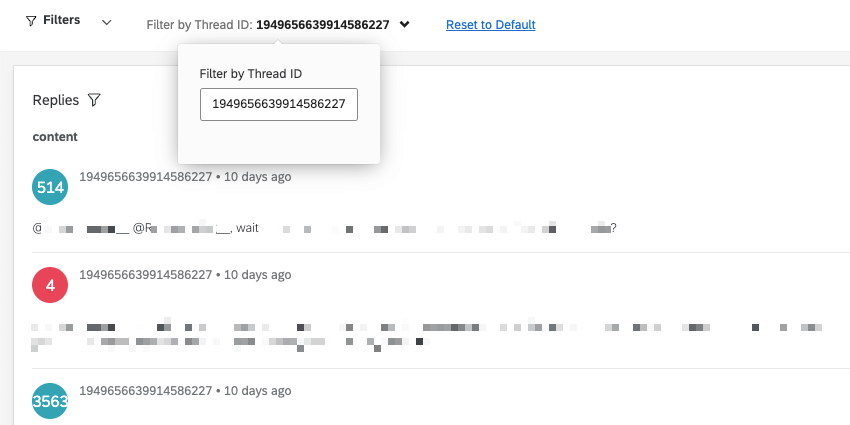
Displaying posts, comments, and thread IDs
These steps show an easy way to display posts, connected comments, and their threadIDs, so you can use these in your filters. However, you can also add any other widgets you want on your page for comment analysis. We recommend a Word Cloud, a Text iQ Bubble Widget, and / or a Text iQ Table Widget.
- Create a response ticker widget.
- Give it a name that shows this widget is for browsing posts.
- Set the Content to the Content field.
- Make sure the title or subtitle is set to threadId, so you can easily copy this information.
- For the other fields, you can add whatever details you want. For example, any of the “count” fields could be the ticker value, and the subtitle could be the social media source.