
Displaying Live Results
What's on this page
Attention: Public Results Dashboards links can only be enabled for State & Local Governments and Academic research products.
About Displaying Live Results
Sometimes your survey will call for displaying the overall results to your respondents at the end. After respondents have provided unbiased responses, we want them to know what the other respondents said, and we want this report to be updated with the most recent data. With Qualtrics you can display these live results, and even customize the report to ensure it only displays the content you want it to.
Qtip: This solution is only available for survey projects and for XM Solutions that have the reports covered here.
Customizing the Live Results
Before you add live results to your survey, you’ll want to customize your reports so they appear exactly as you want them to. This section will cover the most common customization options needed for live results.
Qtip: Reports can be customized in many ways that aren’t covered on this page. To learn how to customize an Advanced-Report, see the Advanced-Reports Basic Overview. To learn how to customize a Results-Report, see the Results-Reports Basic Overview. See Results vs. Reports for the differences between the two.
Excluding Questions from the Report
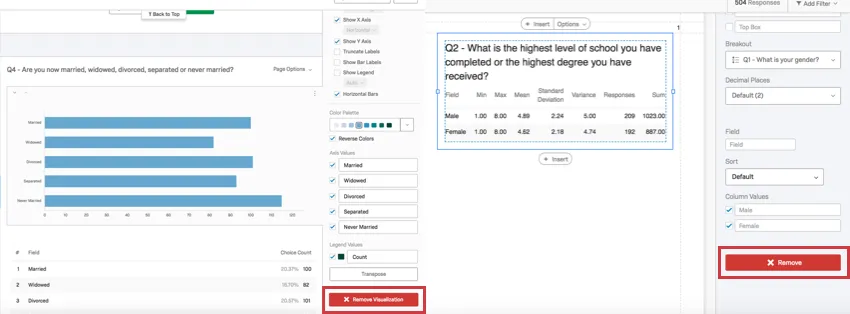
You can exclude the results of an entire question by deleting a visualization. Deleting a visualization does not delete the data – it just removes it from your chosen report. Simply click the visualization and scroll down the visualization editing pane on the right to click Remove.
In Results-Reports, you can also hide pages. Hiding entire pages of visualizations gives you the option of removing a lot of content at once and then easily adding it all back later.
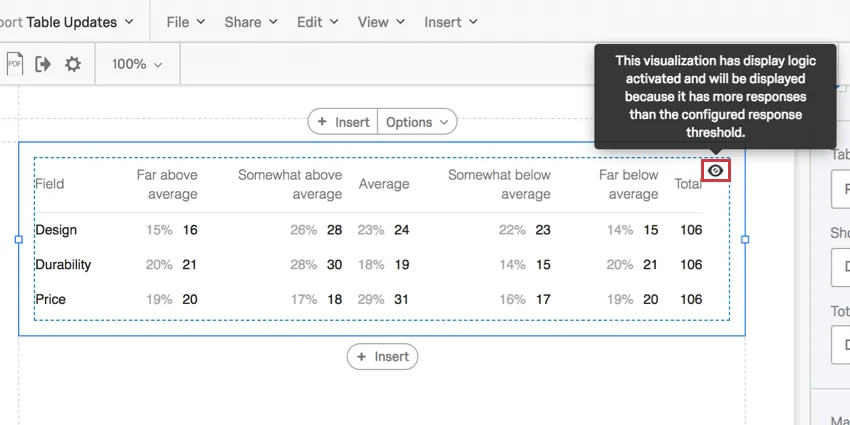
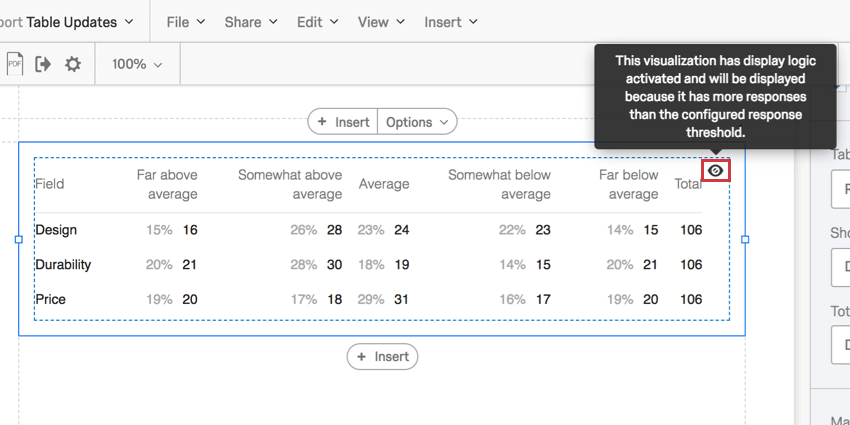
Visualization Display Logic
In Advanced-Reports, you can set thresholds on your visualizations that determine how many responses have to be collected before the visualization displays data. This protects your respondents’ anonymity early in the survey, when very few responses have been collected. Learn more about how to use this feature on the Visualizations Display Logic support page.
This feature is not available in Results-Reports.
Previewing Reports with Test Data
It’s hard to customize how a report looks when there’s no data in it. Test data can help you decide how your reports should look before you launch your study. The best way to generate test data is to use one of the following features:
- Generate Test Responses: Responses generated using this tool do not count towards your auditable responses. Once you’re done customizing reports, you can easily delete your test data so it doesn’t skew your survey’s ongoing live results.
- Preview Survey: Use the preview link to manually enter responses. Responses created through this link do not count towards your auditable responses. Once you’re done customizing reports, you can easily delete your preview data so it doesn’t skew your survey’s ongoing live results.
Attention: Don’t forget to delete your test / preview data before you launch your survey!
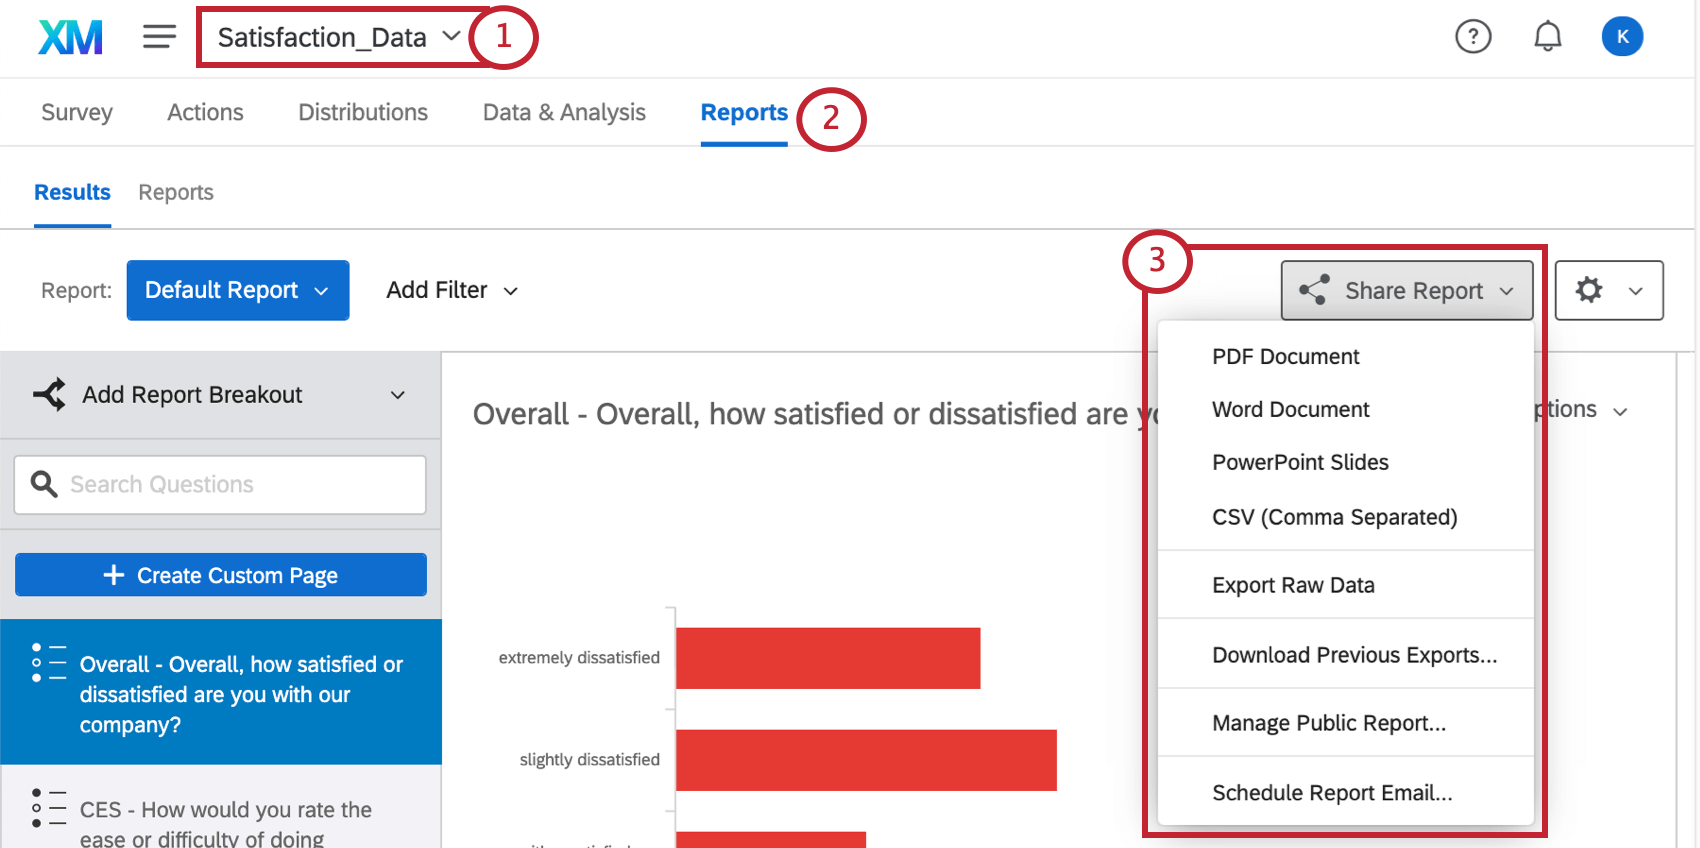
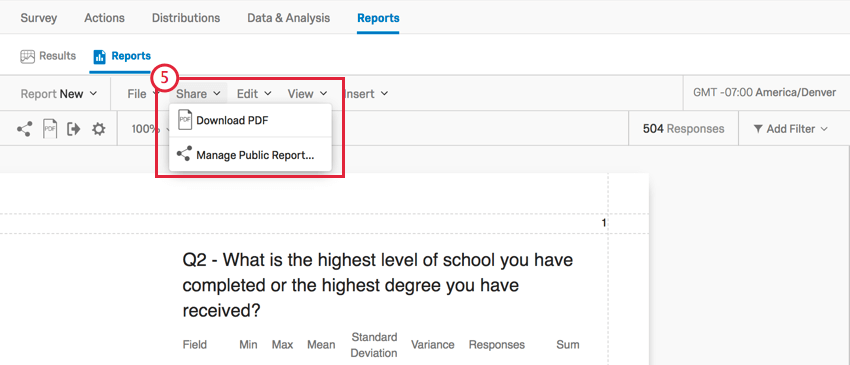
Adding Live Results to a Survey
As soon as your respondent submits their response, they will be redirected to the report you have created. This report will contain all the survey data, including most recently collected responses. Respondents can bookmark and refresh this page as needed.
Qtip: This option will override any custom end of survey messages you have set.
Qtip: This feature is not available for free accounts.
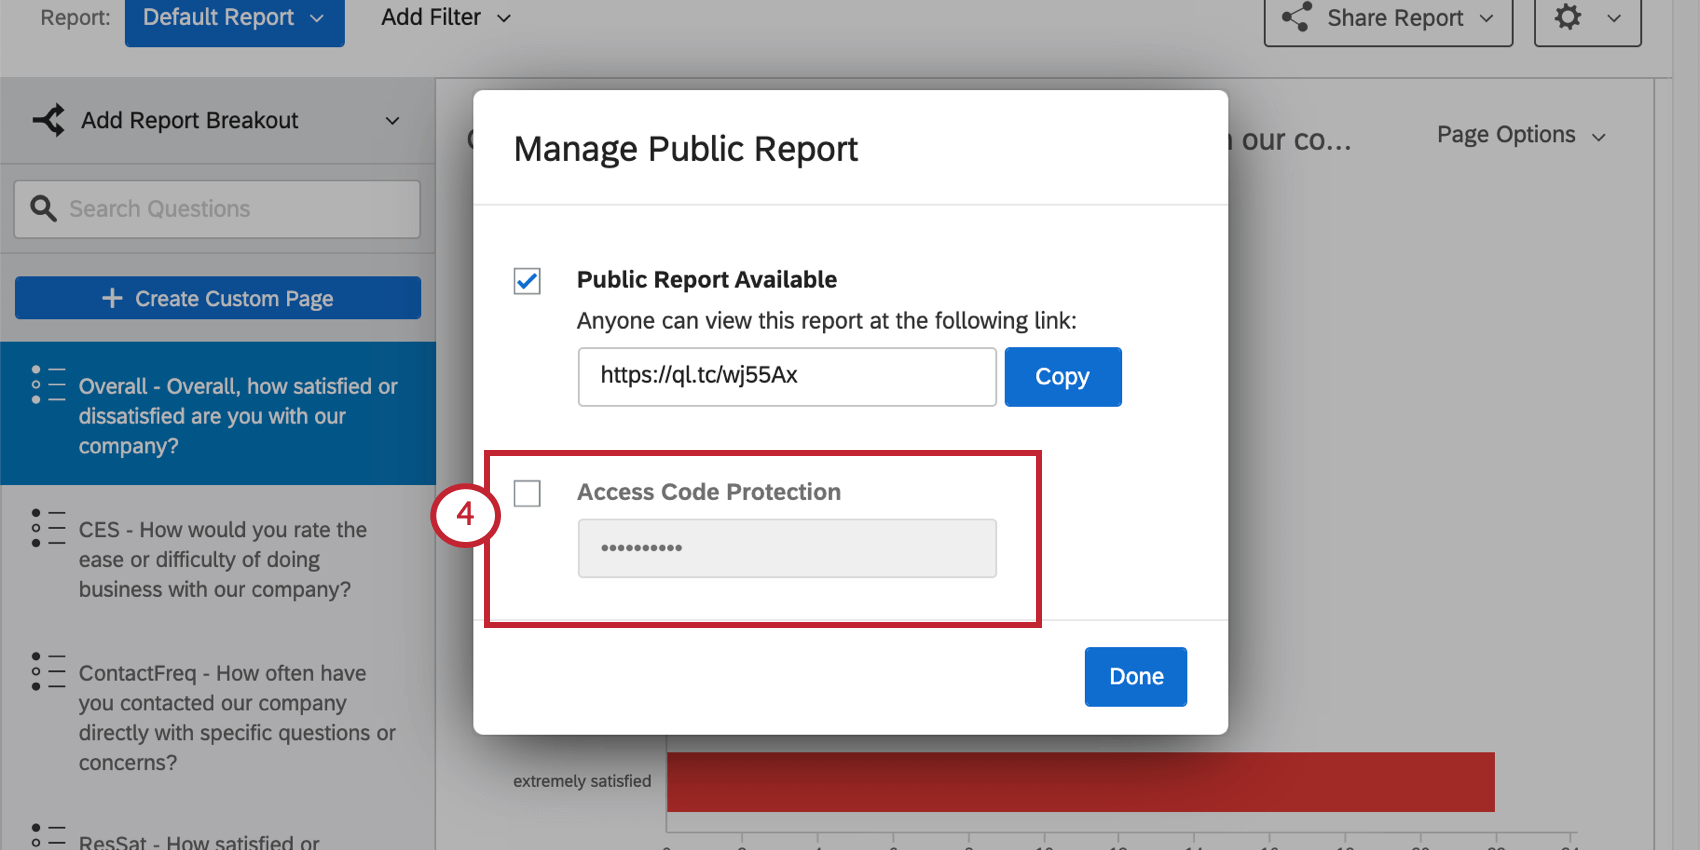
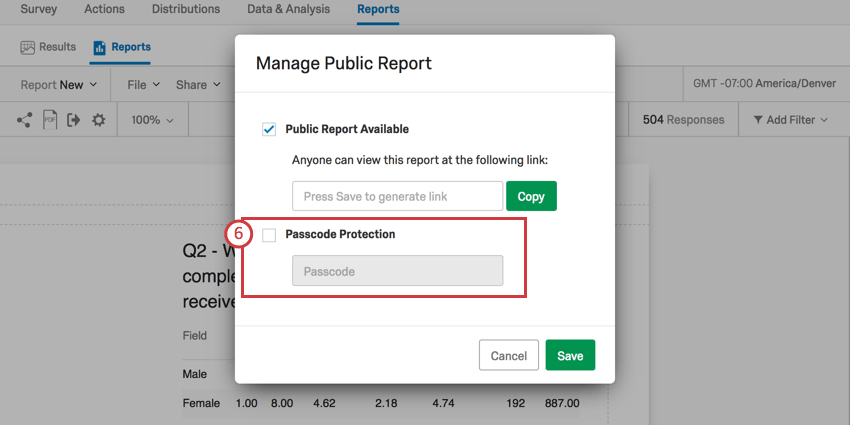
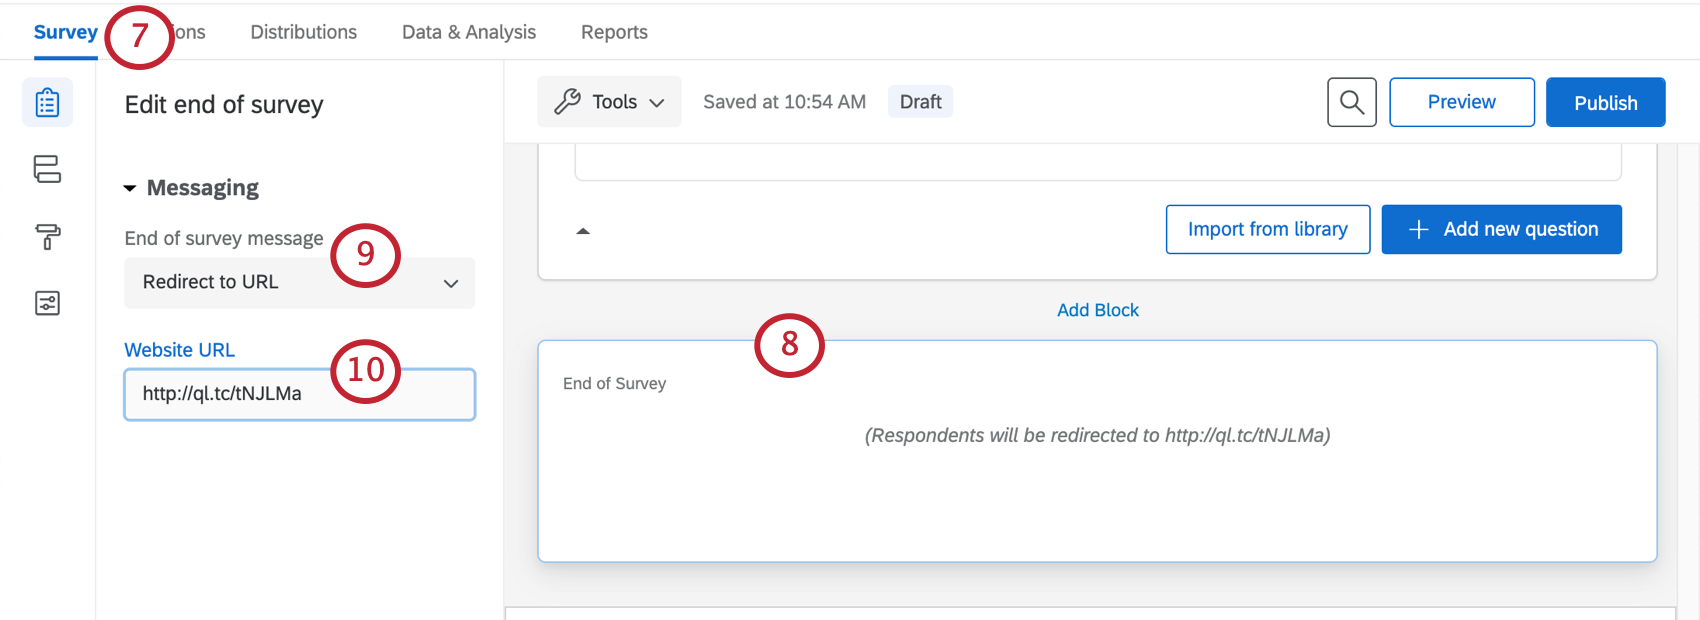
Qtip: Want to keep Access Code / Passcode protection? Try adding a link and the passcode in an end of survey message instead.

That's great! Thank you for your feedback!
Thank you for your feedback!