
Results-Reports Pages
What's on this page
Qtip: There is a new version of Results available. To opt in to the new Results Dashboards, navigate to the Results tab and click Try it now.

About Results-Reports Pages
You can analyze your data and create insightful graphs and tables on your results-reports’ pages. You can use these pages to visualize and explore, or you can export and share them.
Custom vs. Question
Question pages are default pages that the Results section generates for you. The visualizations on a question page can only show data for the corresponding question. You can’t change the data source of a visualization on a question page.
Custom pages, on the other hand, are blank pages where you can build visualizations for whatever questions you want.
Both types of pages are customizable and able to hold as many visualizations as you want to add. Additionally, custom pages have a few more page options, such as renaming and being deleted.
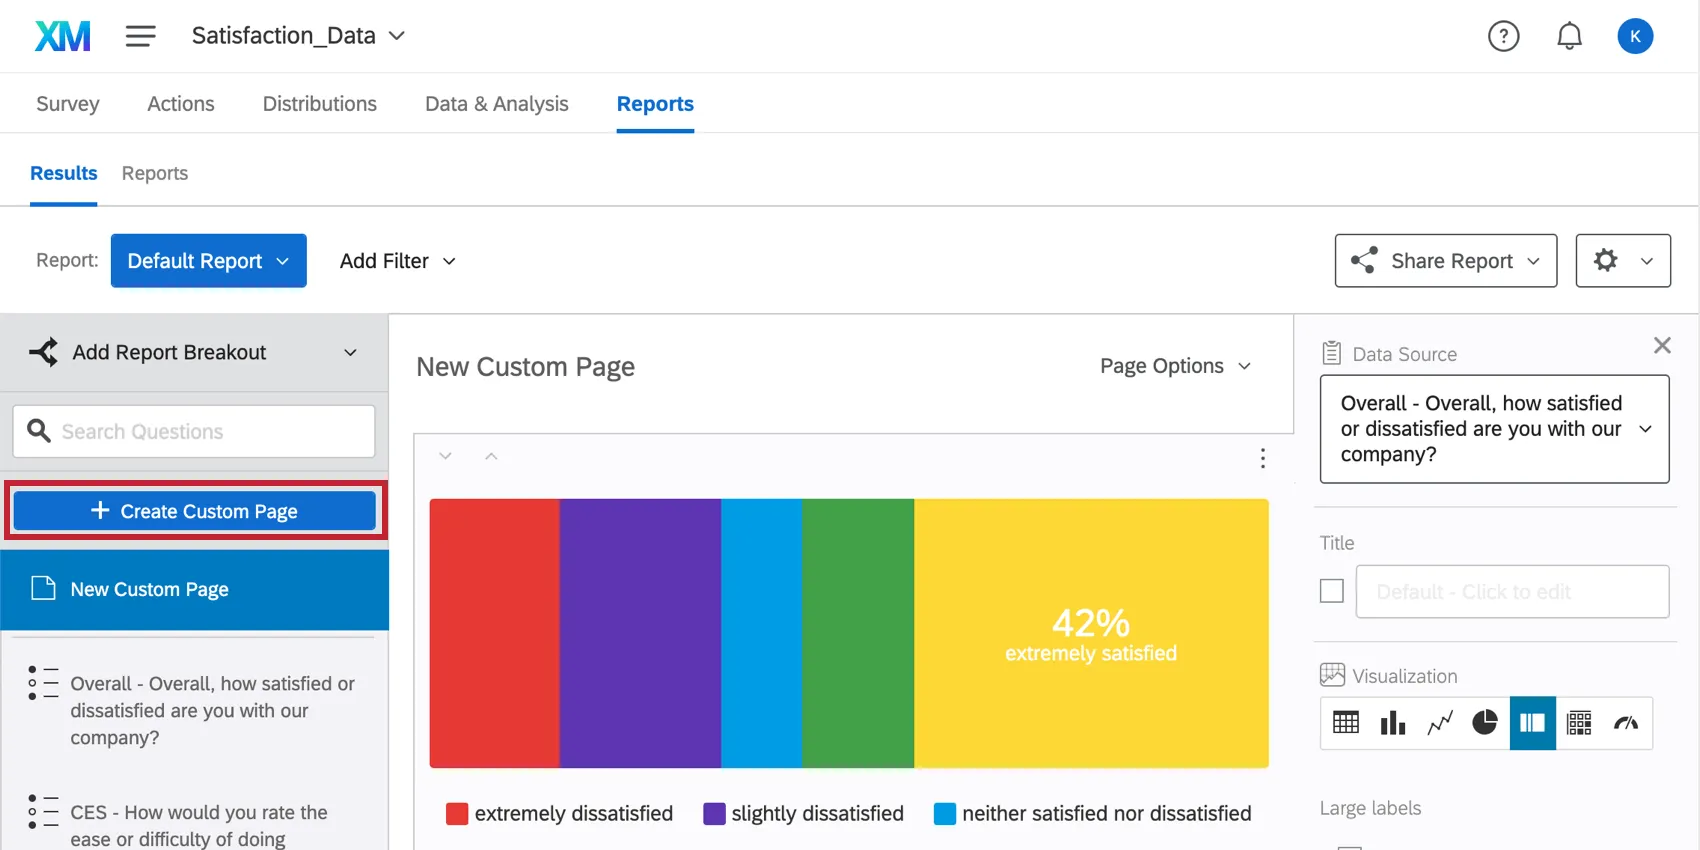
Creating Custom Pages
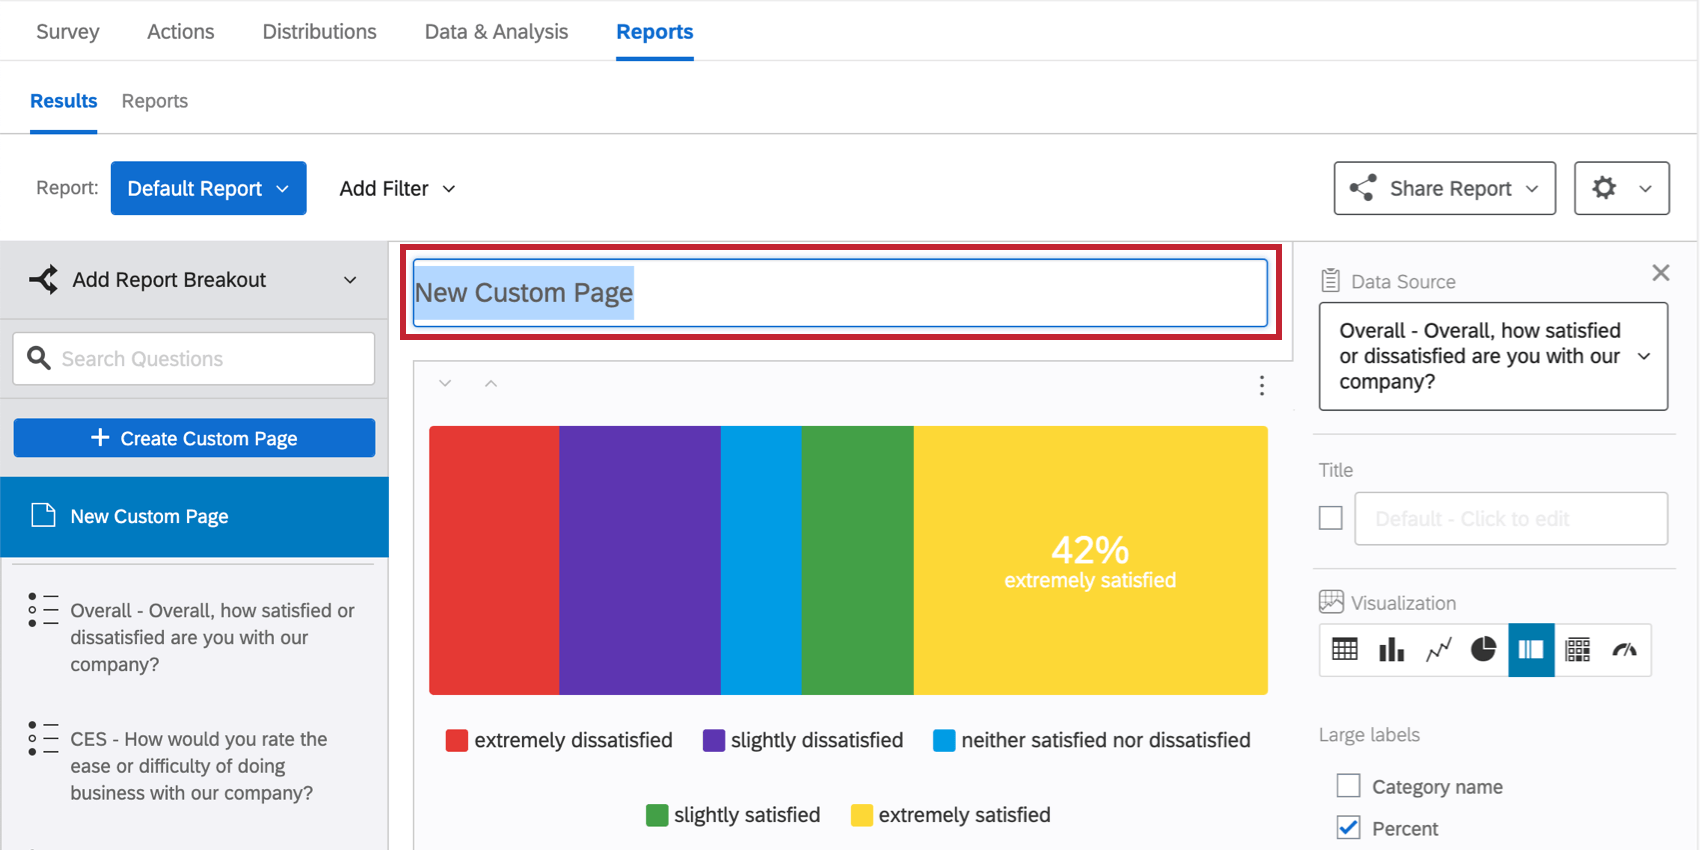
You can create a new custom page by clicking Create Custom Page in green. You may add up to 16 custom pages in your report.
To change the name of your custom page, click on the name of the page inside the report editor.

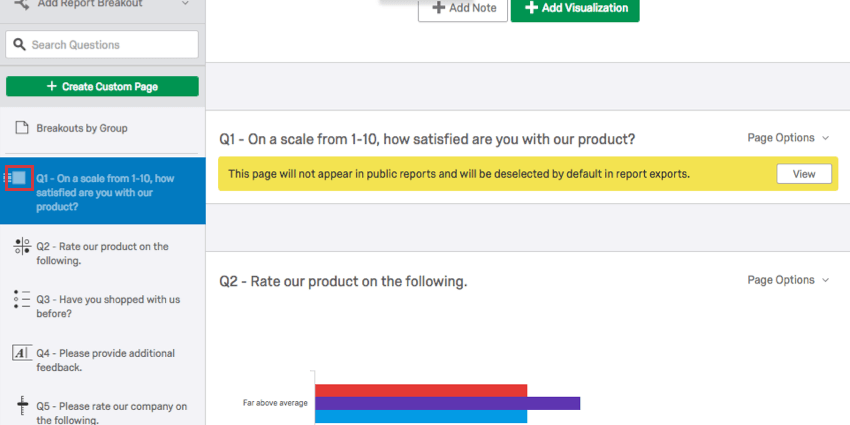
Page Options
When you click Page Options, the following menu will appear:
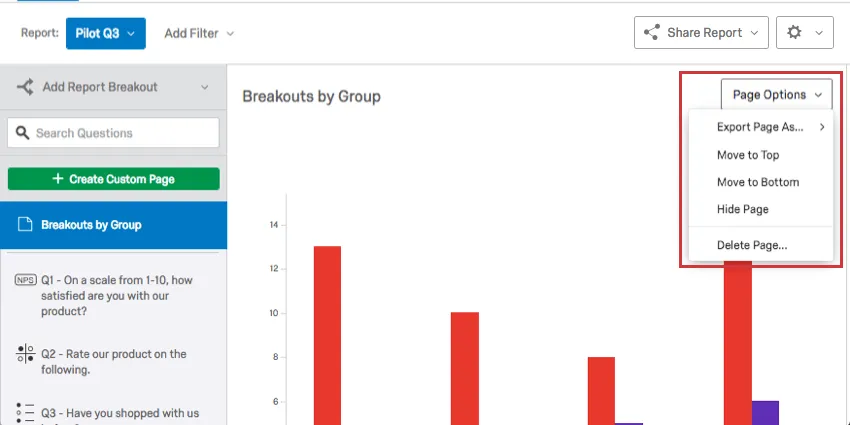
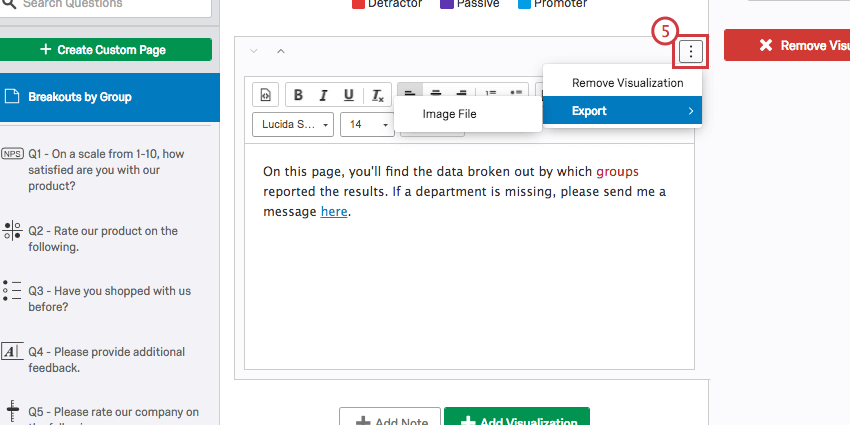
- Export Page As: Save your page as a PDF, Word, Powerpoint, or CSV document.
- Move to Top: This will make your page the first in your list of pages.
- Move to Bottom: This will make your page last in your list of pages. Qtip: Remember that custom pages can be moved amongst each other, but not mixed with question pages, and vice versa.

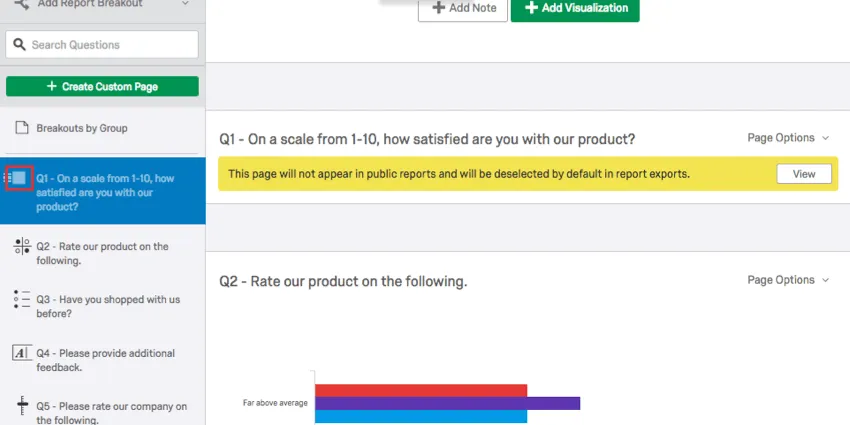
- Hide Page: Exclude your page from your published and exported reports.
- Delete Page: Delete your page. This is only an option for custom pages.
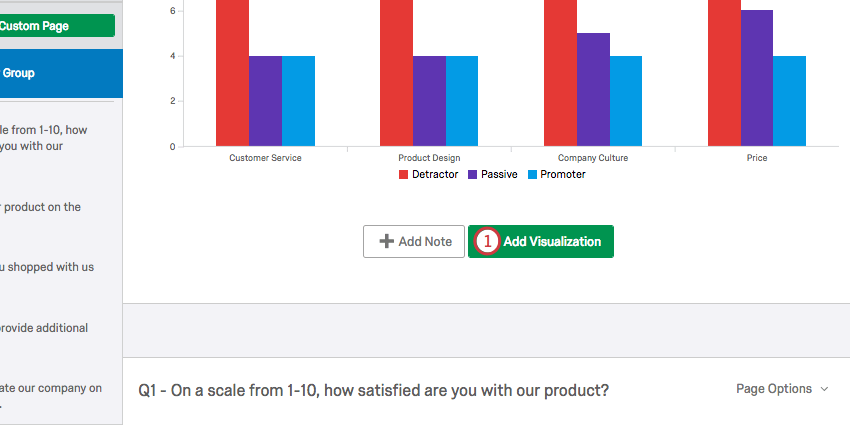
Adding Visualizations
Attention: Results-Reports have a limit of 28 visualizations per page.
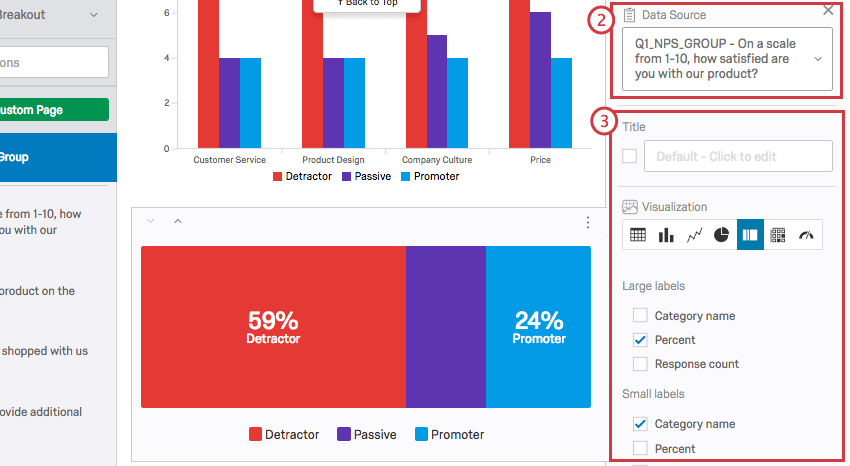
Qtip: Any changes you make are saved automatically.
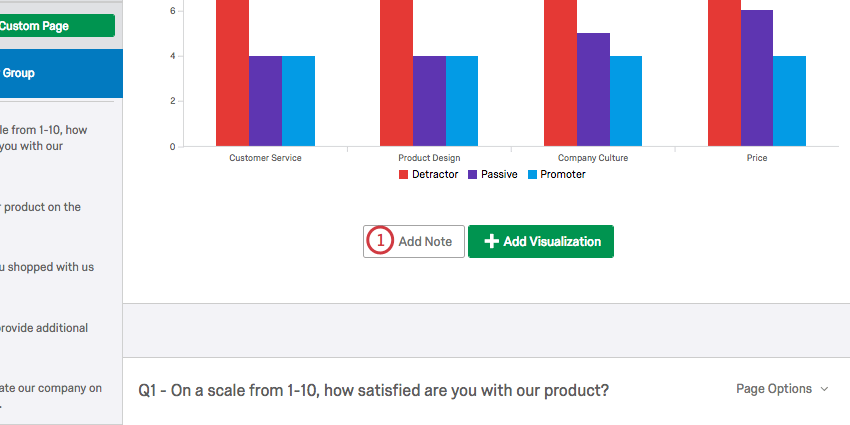
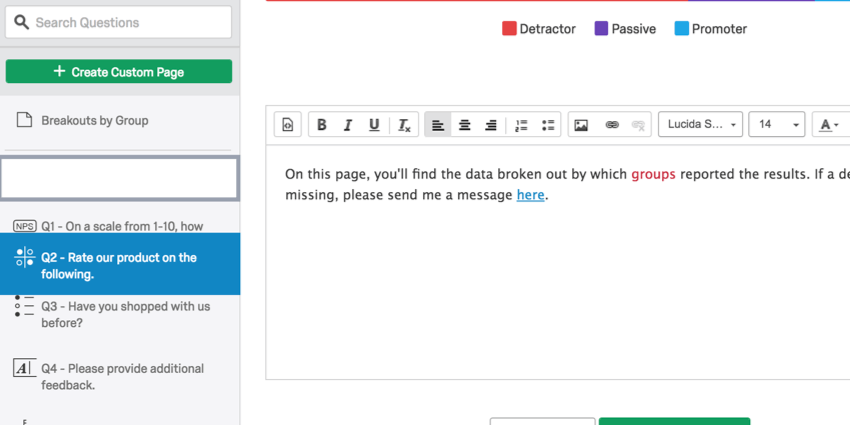
Adding Images and Text
In addition to data visualizations, you can add general information paragraphs, linked text, and images to your reports.
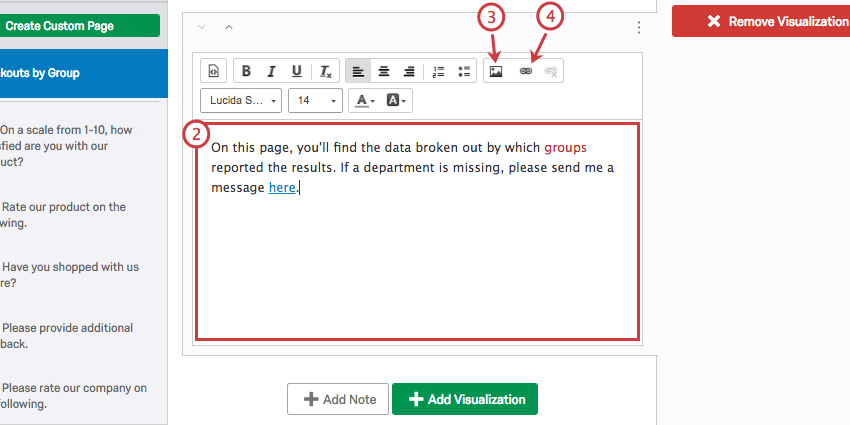
For more assistance on editing text and inserting images, please visit the linked Rich Content Editor page.
Moving and Managing Pages
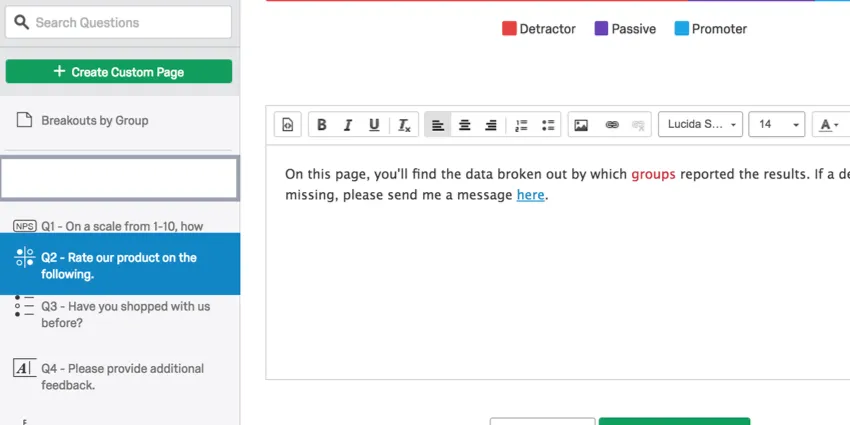
Rearrange the order of our pages by clicking the page on the left navigation pane. Then drag the page to the desired spot. A gray outline will represent where the page will be placed when you release the button.
Qtip: Custom pages can only be switched around with other custom pages. Question pages can only be switched around with other question pages. The two cannot be mixed together.
To hide a page, hover over the page and deselect the checkbox.
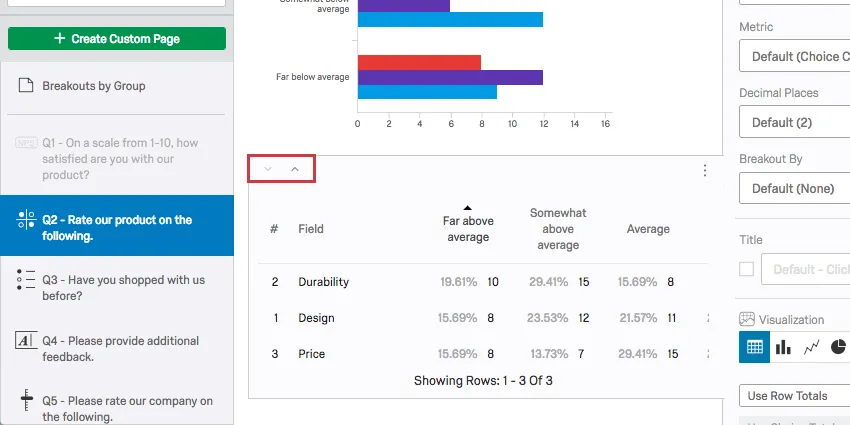
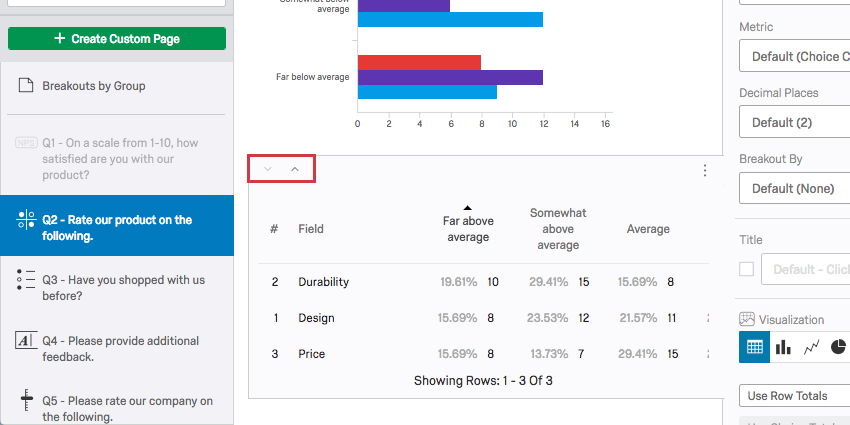
To move visualizations around the page, click on or hover over the visualization. Then click the up and down arrows in the upper-left corner.
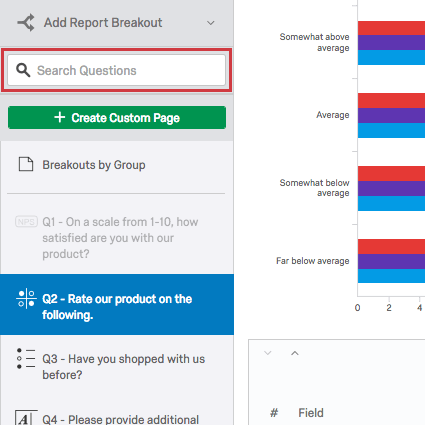
Qtip: Having trouble navigating to a page? Use the search bar to find it!

FAQs
Why am I receiving the error message "Data source misconfigured for this visualization"?
Why am I receiving the error message "Data source misconfigured for this visualization"?
- The question was originally a different question type. Click on the visualization. If this doesn't resolve the issue, re-select the data source (e.g., the question linked to the visualization).
- A breakout was applied that the visualization did not accept. Change the visualization to a different type, and then change it back to the original visualization type.
- An incomplete results filter can cause this. Removing or finishing the filter can solve the issue. See Filtering Results for more details.
My visualizations from different questions are all on different pages in my Results-Report. Can I put them on the same page?
My visualizations from different questions are all on different pages in my Results-Report. Can I put them on the same page?
Note that in Advanced-Reports, you customize every page.
Can I hide pages in my Results-Report without deleting them so I can use them later?
Can I hide pages in my Results-Report without deleting them so I can use them later?
That's great! Thank you for your feedback!
Thank you for your feedback!