
Field Types & Widget Compatibility
What's on this page
About Field Types and Widget Compatibility
When you’re choosing data for your dashboard, each field (question or metadata) needs to be assigned to one of several field types. These field types define the data format of the field (eg., numeric or text) and consequently determine which widgets will be available for that field.
Whenever you create a new dashboard, the most recently updated fields have field types already set. While Qualtrics will try to choose the best field type based on the question’s format or data collected, you may need to change some of your fields so you can use different widgets.
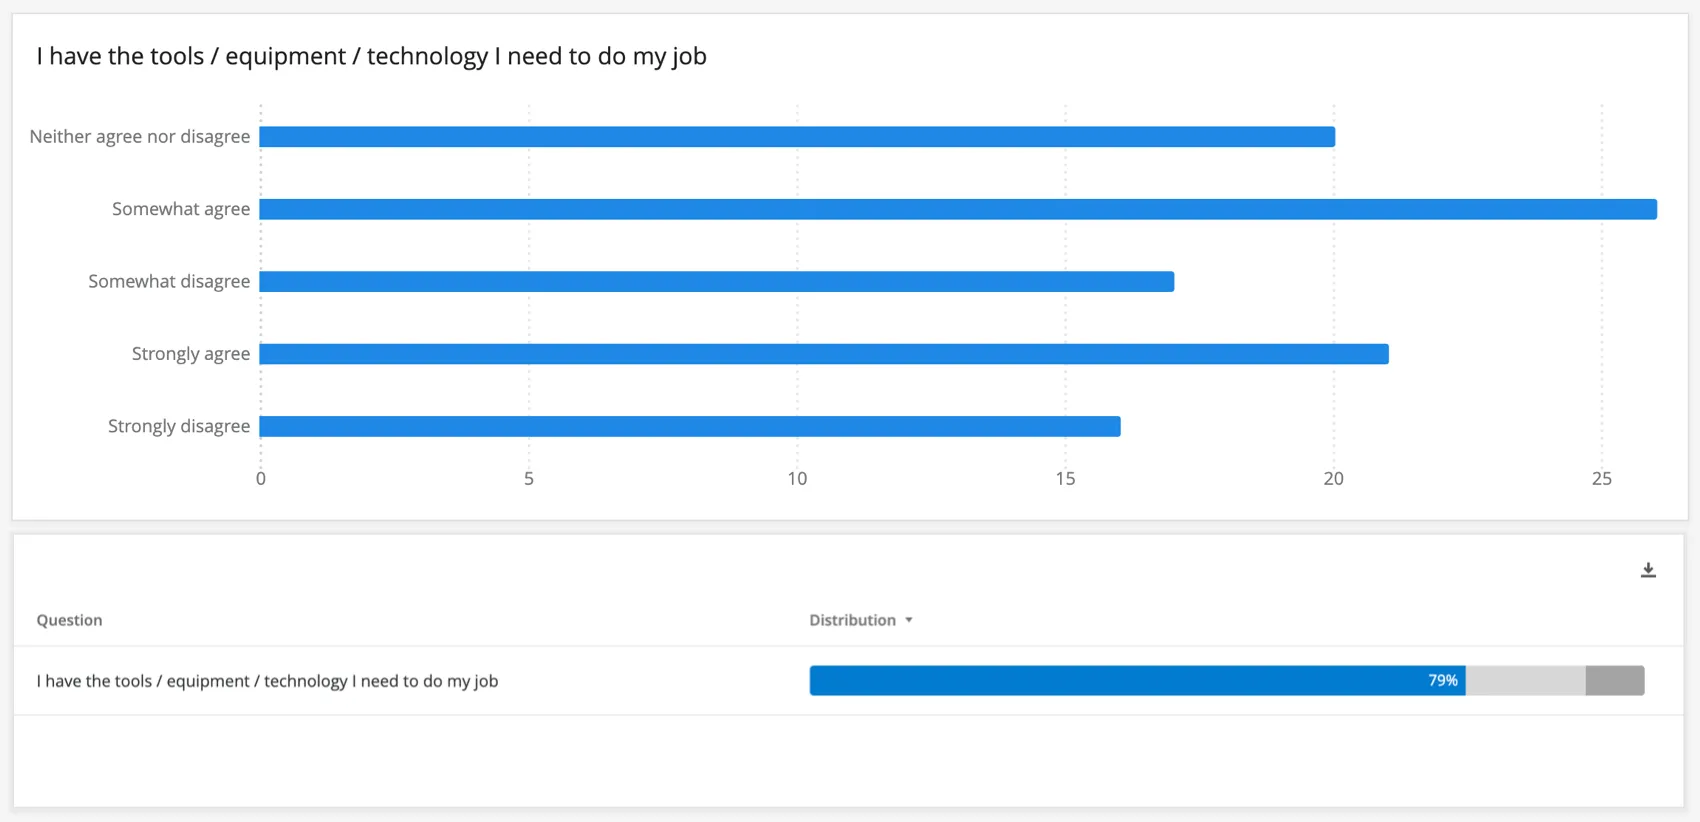
Example: Questions can often be phrased as scales. “How much do you agree with this statement: I am given the tools I need to succeed in my role” may be followed by a series of seven answers, from “Strongly Agree” to “Strongly Disagree.” There are times when you want this data to be in text-set, such as when you’re presenting a bar chart with the number of employees who chose each answer. Text set allows us to see the answer labels, “Agree,” “Somewhat Agree,” etc., which are more readable than if it were just numbers. However, there are also times when this data would work better in a number set format, such as when you’re showing the distribution of responses or a mean score.
Qtip: Be aware that changing field types can break widgets using those fields! If the same question needs to be in different data formats, we recommend mapping that same field a second time rather than editing the existing field type. Remember that no 2 fields can have the exact same name, so add the field type in parentheses at the end of the field’s name to differentiate them. For example, “I am given the tools I need to succeed in my role (Number Set)” vs. “I am given the tools I need to succeed in my role (Text Set).”
Field Types
NUMBER FIELD TYPES
Use a number field type when the data is exclusively numeric.
- Numeric Value: A number field that has a very large or infinite set of values (e.g., any number between 0 and infinity).
- Number Set: A number field that has a finite set of values (e.g., the set of numbers from 0 to 5). Typically used with scales, such as the Likert 1-5-point scale.
Date: Customized calendar date fields.

Qtip: You can collect date data in any format you want – you just have to tell your dashboard how to read it. For more information, see Date Field Format.
TEXT FIELD TYPES
Text types are used to map text entry responses or for labels in non-text entry questions.
- Text Value: A 1-2 word text field that has a very large or infinite set of values. Used for open-ended form questions such as asking for names or email addresses.
- Text Set: A 1-2 word text field that has a finite set of values. For example, instead of using a scale from 1-5 in a number set field type, mapping the labels “Dissatisfied” to “Satisfied” to Text Set widgets.
- Multi-Answer Text Set: Multiple select questions that ask respondents to check all items that are applicable to them.
- Open Text: Longer blocks or strings of text, such as a request for open-ended feedback.
Warning: When filtering (CX|EX) with number set or text set fields, the filter will display a maximum of 5,000 values.
Qtip: The assigned field type will effect how data is filtered in your dashboard:
- For “text set” fields, responses are not filtered out when nothing is selected for the filter.
- For “number set” or “number value” fields, the filter’s value ranges are automatically applied to widgets, so responses with no answer will be filtered out even when nothing is selected for the filter.
For example, let’s say you have an NPS question in your dataset. If your data is mapped as a “number value” field, then adding a filter for this field will hide responses that do not have a value between 0 and 10. If you have the data mapped as a “text set” and then filter by it, all responses will be shown and will not be filtered out until you select filter values.
Assigning Field Types
Now that you know the difference between all the field types, it’s time to assign them to your dashboard fields.
Qtip: Changing the field type can break widgets using that specific field on any dashboard, so edit with caution. For example, if you set an NPS Question to a Number Set in Dashboard Data and map it to a gauge chart widget in your dashboard, and then go back to the Dashboard Data page and change the definition to be a Text Set, your gauge chart widget in your dashboard will break.
First, open the dataset. In CX Dashboards, this can be done on the Data page or inside your dashboard’s settings. In an EX dashboard, this can be done inside your dashboard’s settings.
Data Mapper
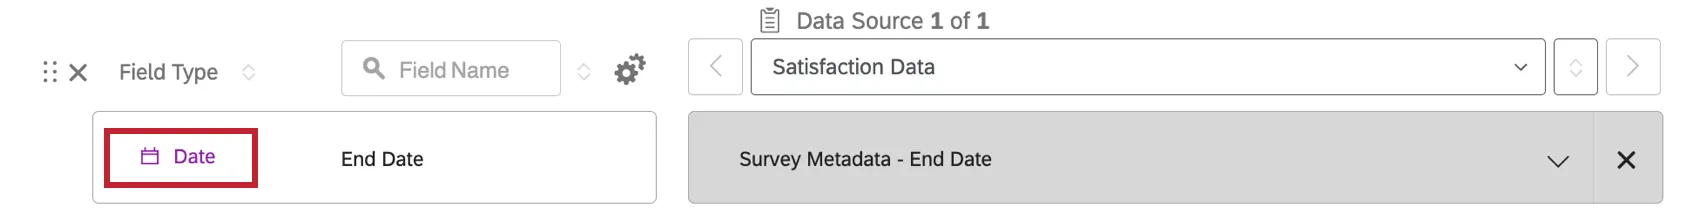
If you’re using a data mapper in CX or any EX dashboard, adjust the Field Type dropdown.
Data Model
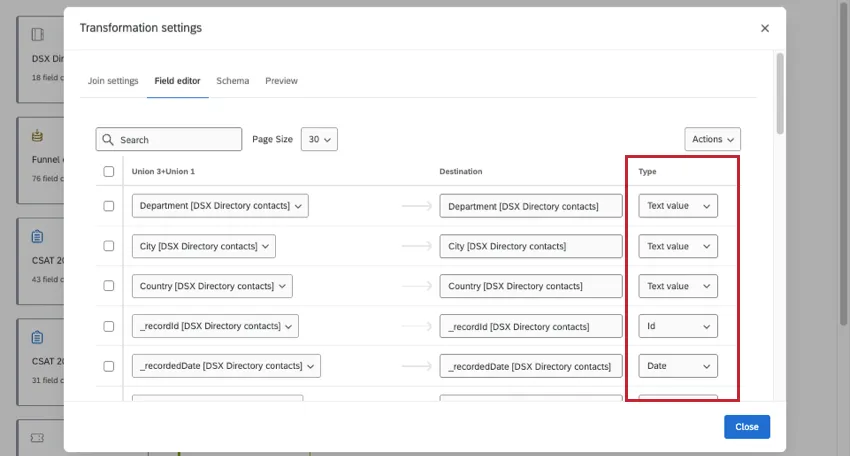
If you’re using a data model in CX, select your source, union, or join. Then go to the Field editor and adjust the Type.
In the data modeler, you can assign fields when you select a source, union, or join (but not in an output dataset). The latest join or union is generally what’s reflected in the final output dataset. If you change a field’s type at the source, keep the following in mind:
- If you change a field type at the source, then only create joins in your dataset, the source field type is reflected in the output dataset.
- If you change the field type at the source, then create a union, the final field type is determined by the union.
Attention: When mapping the same field across multiple nodes of a data model, be careful to use a consistent field type. For example, if your CSAT is a Number Set at the source, it should be a Number Set in any unions and joins that follow. If you change the type in a node, you must change it across all of the others. If the type differs for each version of the field, there could be unintended effects, such as certain values not carrying over.
Field Types for Widgets Shared in CX and EX
In the table below, you’ll see a list of widgets that appear in both EX and CX dashboards. If a widget you’re looking for isn’t listed here, check one of the tables later on the page.
Qtip: The items indicated by asterisks ( * ) are metrics that can be used in the following widgets: simple chart, gauge chart, number chart, pie chart, simple table, multiple source table, pivot table, line chart, bar chart, table, map, and map view.
| Numeric Value | Number Set | Date | Text Value | Text Set | Multi-Answer Text Set | Open Text | |
|---|---|---|---|---|---|---|---|
| Filters on Metrics* | Yes | Yes | Yes | Yes | Yes | Yes | Yes |
| Average* | Yes | Yes | No | No | No | No | No |
| Minimum/Maximum* | Yes | Yes | No | No | No | No | No |
| Sum* | Yes | Yes | No | No | No | No | No |
| Net Promoter Score* | Yes | Yes | No | No | No | No | No |
| Correlation* | Yes | Yes | No | No | No | No | No |
| Top/Bottom Box* | Yes | Yes | No | No | No | No | No |
| Donut / Pie (Dimension) | No | Yes | Yes | No | Yes | Yes | No |
| Focus Areas (Outcome Metric) | No | Yes | No | No | No | No | No |
| Focus Areas (Key Drivers) | No | Yes | No | No | No | No | No |
| Key Drivers (Outcome Metric) | Yes | Yes | No | No | No | No | No |
| Key Driver (Potential Drivers) | Yes | Yes | No | No | No | No | No |
| Line, horizontal bar, vertical bar (X-Axis) | No | Yes | Yes | No | Yes | Yes | No |
| Line, horizontal bar, vertical bar (Data Series) | No | Yes | Yes | No | Yes | Yes | No |
| Record Table (Columns) | Yes | Yes | Yes | Yes | Yes | Yes | Yes |
| Response Ticker (Content) | No | No | No | No | No | No | Yes |
| Response Ticker (Primary/Secondary Label) | No | No | No | Yes | Yes | Yes | No |
| Response Ticker (Ticker Value) | Yes | Yes | No | No | No | No | No |
| Response Ticker (Date) | No | No | Yes | No | No | No | No |
| Table (Rows) | No | Yes | Yes | No | Yes | Yes | No |
| Table (Columns) | No | Yes | Yes | No | Yes | Yes | No |
| Word Cloud (Text Source) | No | No | No | No | No | No | Yes |
Field Types for Widgets Only in CX
In the table below, you’ll see a list of widgets that appear only in CX dashboards. If a widget you’re looking for isn’t listed here, check one of the other tables on the page.
| Numeric Value | Number Set | Date | Text Value | Text Set | Multi-Answer Text Set | Open Text | |
|---|---|---|---|---|---|---|---|
| Star Rating (Source) | No | Yes | No | No | No | No | No |
| Breakdown Bar (Dimension) | No | Yes | Yes | No | Yes | Yes | No |
| Breakdown Trends (Field) | No | Yes | No | No | Yes | Yes | No |
| Scatter Plot (X/Y Axis) | Yes | Yes | No | No | No | No | No |
| Breakdown Trends (Source) | Yes | Yes | No | No | No | No | No |
| Breakdown Table (Rows) | No | Yes | No | No | Yes | Yes | No |
| Multiple Source Table (Source) | Yes | Yes | No | No | No | No | No |
| Map (Location field) | No | No | No | No | Yes | Yes | No |
| Coaching priorities widget (Agent ID) | No | No | No | Yes | Yes | No | No |
| Coaching priorities widget (Agent Name) | No | No | No | No | Yes | No | No |
| Coaching priorities widget (Time period) | No | No | Yes | No | No | No | No |
| Coaching priorities widget (Data field, customer rating, agent self-rating & key metrics) | Yes | Yes | No | No | No | No | No |
Field Types for Widgets Only in EX
In the table below, you’ll see a list of widgets that appear only in EX dashboards (such as Engagement, 360, Lifecycle, Pulse, or Ad Hoc Employee Research). If a widget you’re looking for isn’t listed here, check one of the other tables on the page.
| Numeric Value | Number Set | Date | Text Value | Text Set | Multi-Answer Text Set | Open Text | |
|---|---|---|---|---|---|---|---|
| Bubble Chart (Source 1 & Source 2) | No | Yes | No | No | Yes | No | No |
| Demographic Breakout Table (Items) | No | Yes | No | No | No | No | No |
| Demographic Breakout Table (Breakouts) | No | Yes | No | Yes | Yes | Yes | No |
| Heat Map (Items) | No | Yes | No | No | No | No | No |
| Heat Map (Breakouts) | No | No | No | No | Yes | Yes | No |
| Question List (Items) | No | Yes | No | No | No | No | No |
| Comparison Widget (Items) | No | Yes | No | No | No | No | No |
| Comparison Widget (Breakouts) | No | Yes | No | Yes | Yes | Yes | No |
| Response Rates (Fields) | No | No | No | No | Yes | Yes | No |
| Engagement Summary (Items) | No | Yes | No | No | No | No | No |
Widgets with No Fields
The following widgets are not compatible with any field types because they do not require fields.
- Scorecard widget (which uses categories instead of fields)
- Image widget
- Rich text editor widget
- Action planning editor widget
- Action item summary widget
- Participation summary widget
Types of Dashboards that Use Field Types
Field types are used in every type of Qualtrics dashboard to help format data for widgets. This includes the following types of dashboards:
- CX Dashboards
- Employee Engagement
- Lifecycle
- 360
- Pulse
- Ad Hoc Employee Research
- Employee Journey Analytics
- Brand Experience
Qtip: Results Dashboards also use field types, but the steps to edit these mappings look different than they do in a data mapper or data model. See Mapping Results Dashboards Fields.
FAQs
Are there survey features that aren't compatible with my CX Dashboard?
Are there survey features that aren't compatible with my CX Dashboard?
That's great! Thank you for your feedback!
Thank you for your feedback!