
Dashboards Basic Overview (360)
What's on this page
Qtip: This page describes functionality available to 360 projects. For more details on EX projects, see Types of Employee Experience Projects.
About 360 Dashboards
360 dashboards are used for reporting on your subject data in aggregate. Admins can use dashboards to understand participation rates, areas of improvement, areas of excellence, and more across the organization. Each dashboard can contain multiple pages which, in turn, are made up of widgets that visualize your data. Dashboards can be shared with other dashboard users within your organization and set to only show them the information to which they should have access.
Qtip: This page is targeted towards Brand Administrators, EX Administrators, and Employee Insights Admins. If you do not have editing access to a dashboard, see the Dashboard Viewer support page.
Qtip: For individual subject reports, see 360 Reports Basic Overview.
Granting Dashboard Access
Grant users dashboard access by using roles. Roles are the only way to give dashboard access for 360 dashboards; you cannot give access by editing an individual 360 participant. See the linked page for more information.
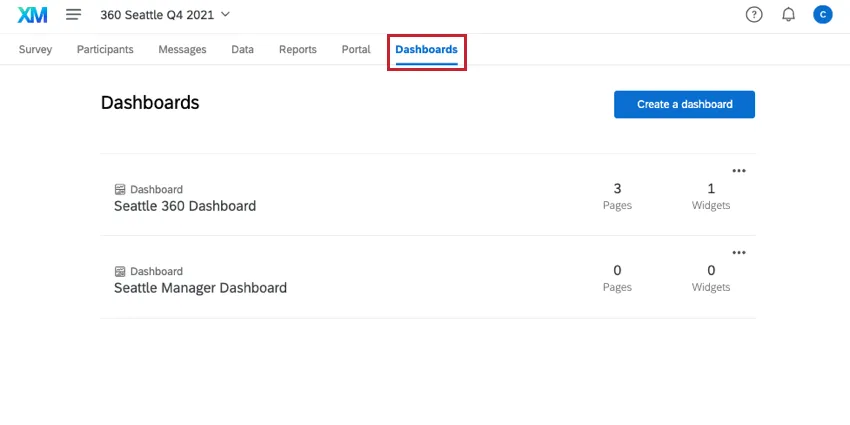
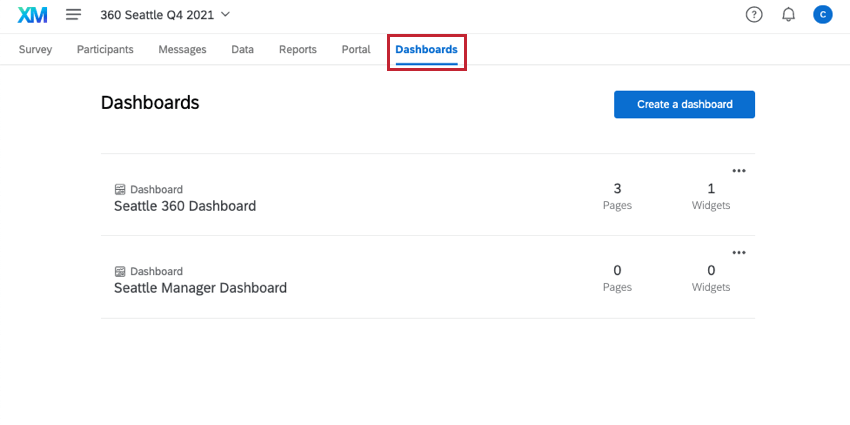
Adding & Removing Dashboards
You can add, remove, and copy dashboards in your 360 project in the Dashboards tab. See Adding & Removing a Dashboard for more information.
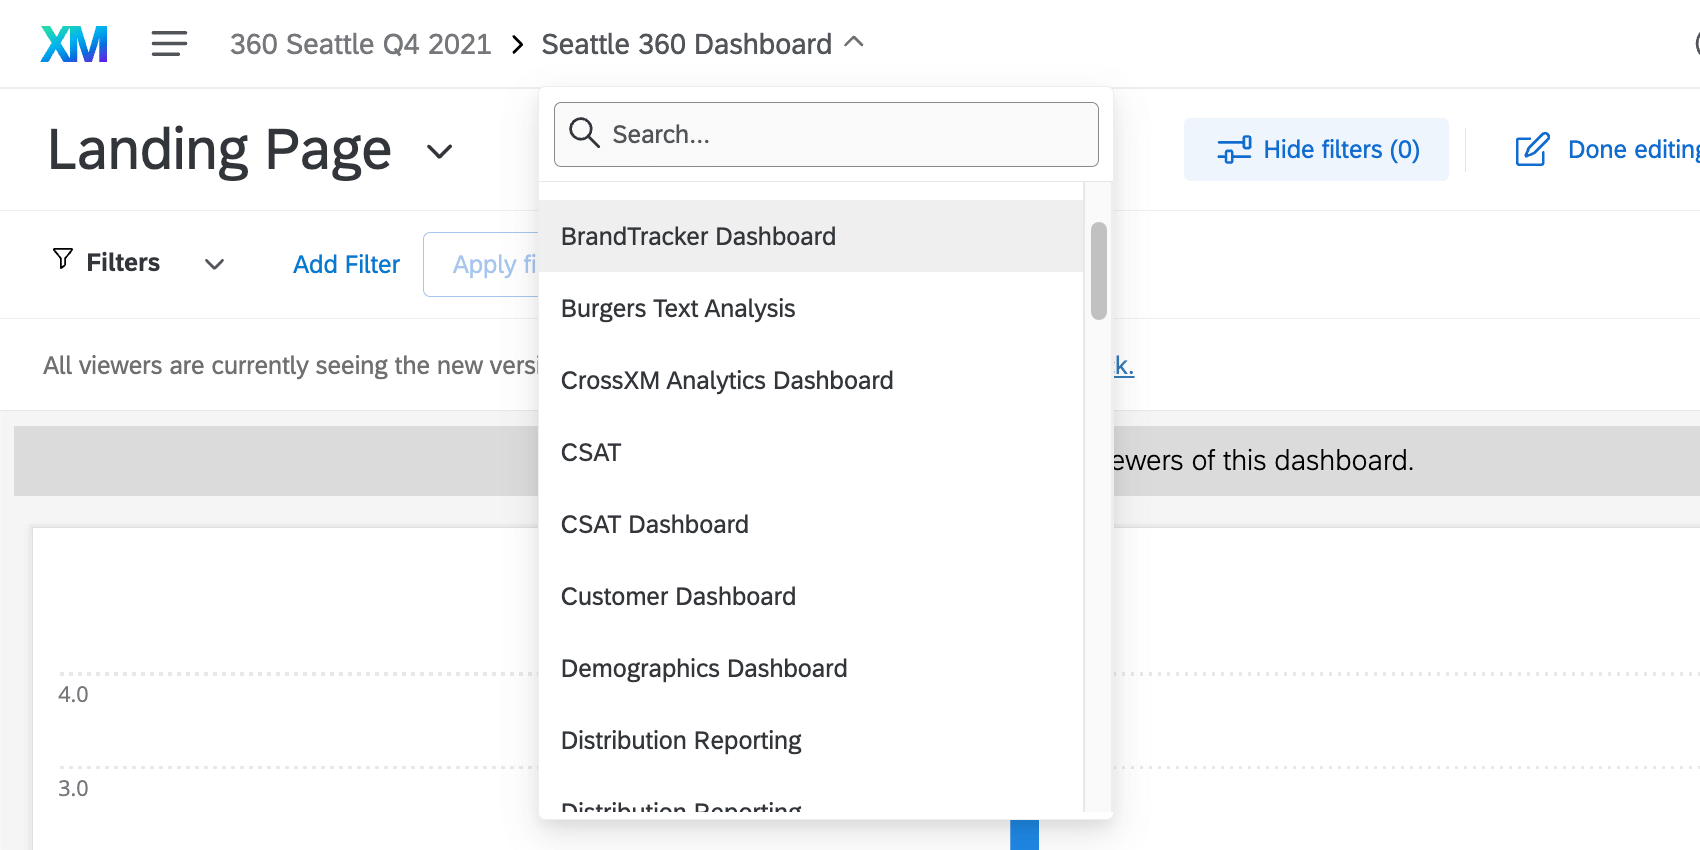
Navigating Between Dashboards
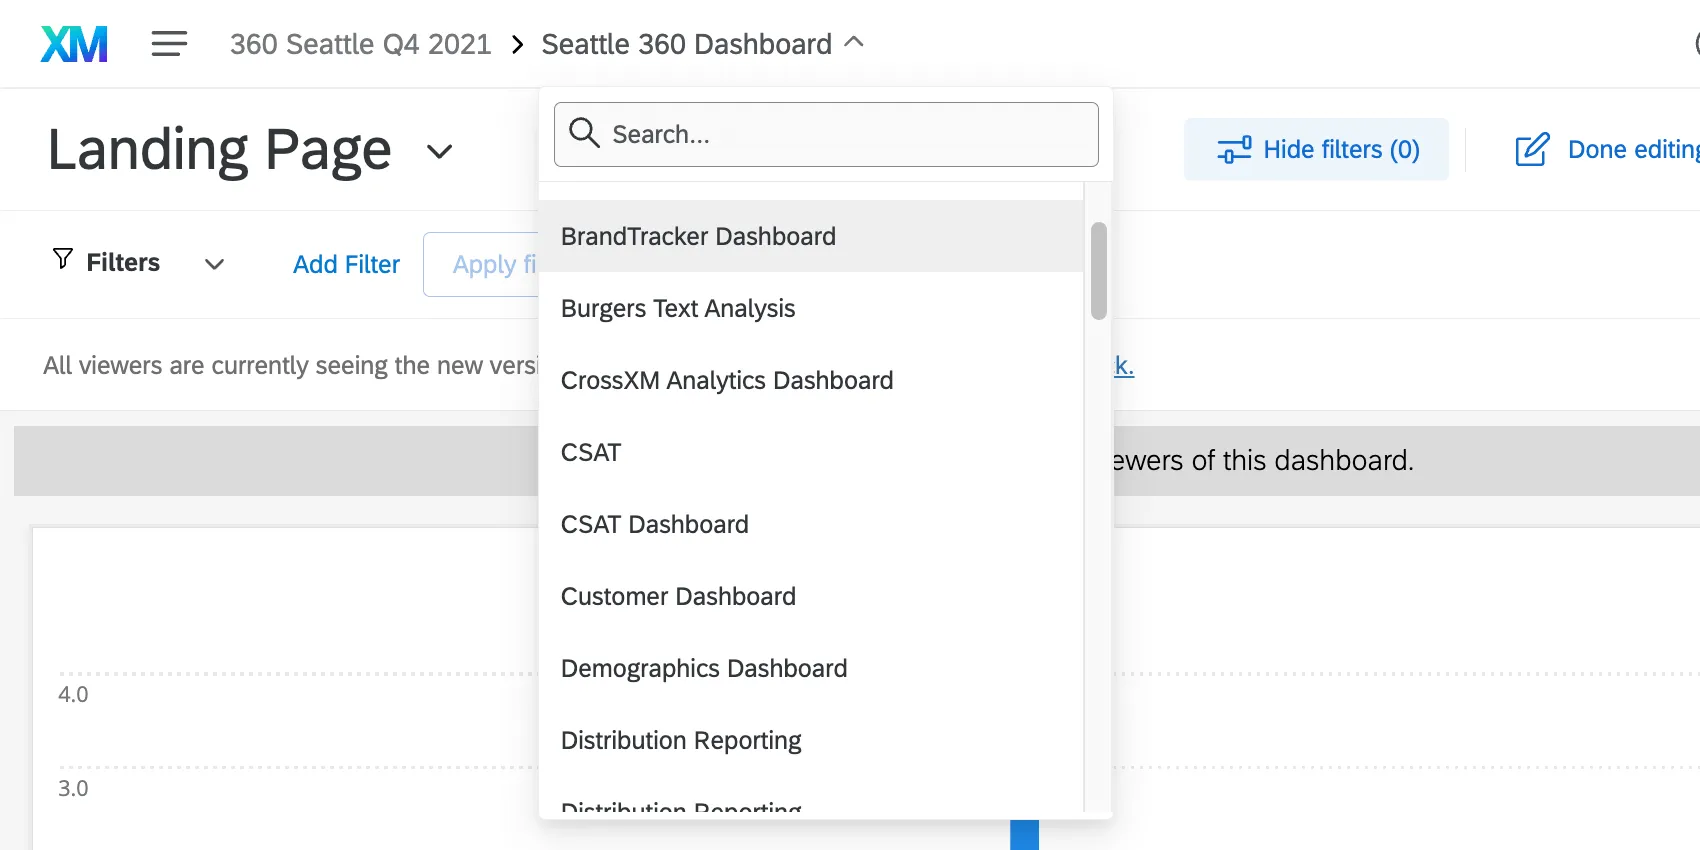
You can easily navigate to any other dashboard available in your account without exiting your current dashboard. To do so, click the dashboard’s name in the upper left-hand corner and select any other dashboard name. This will allow you to edit and view other dashboards quickly and efficiently.
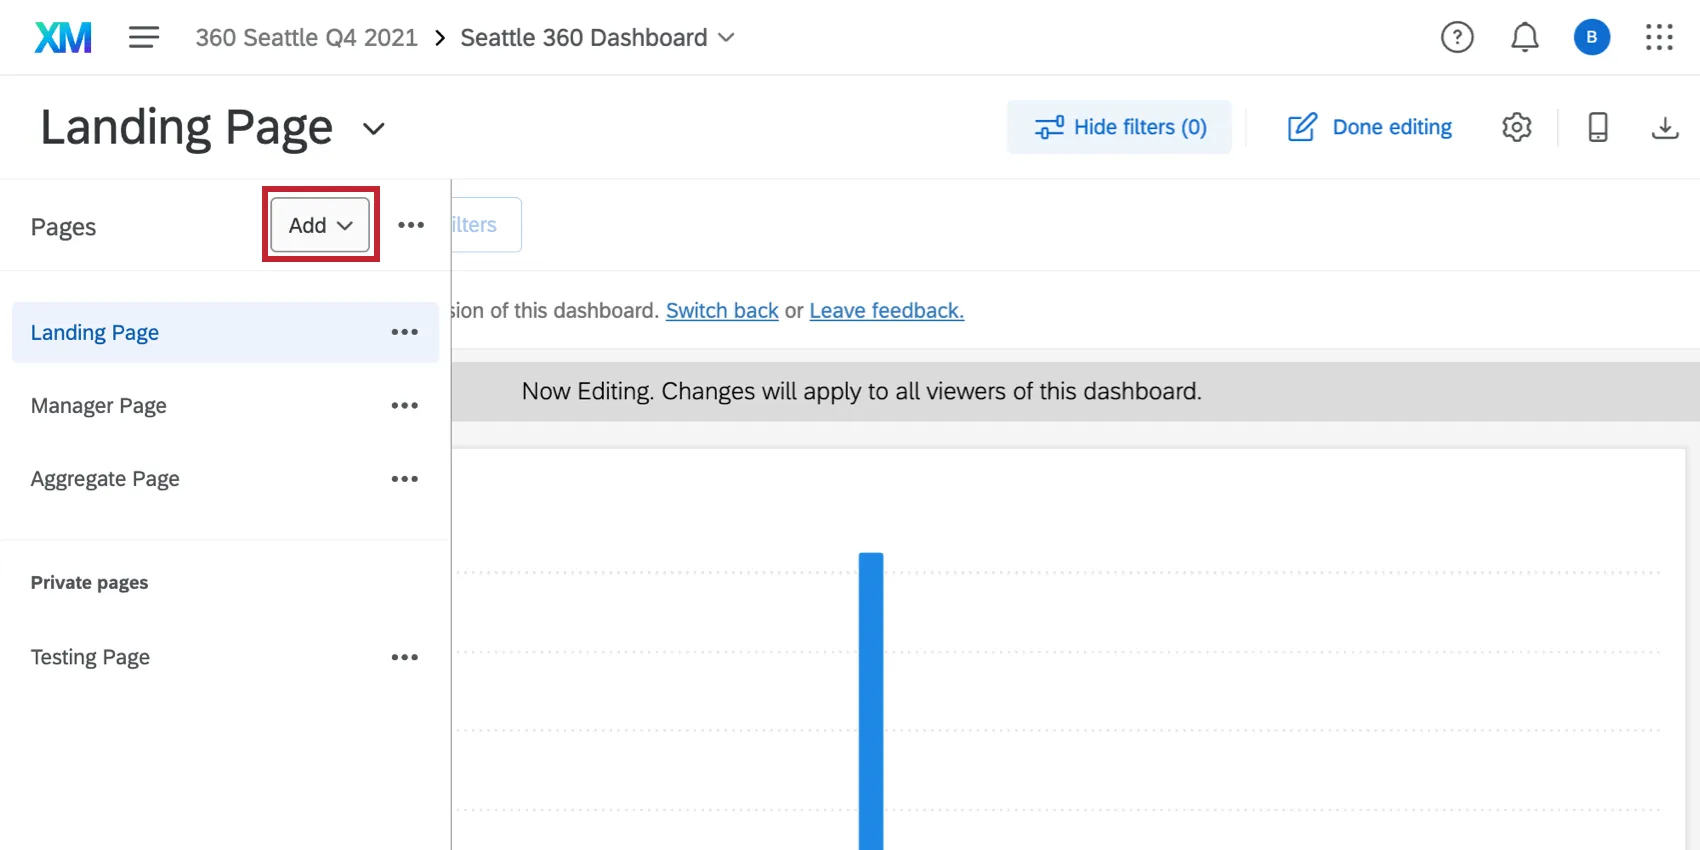
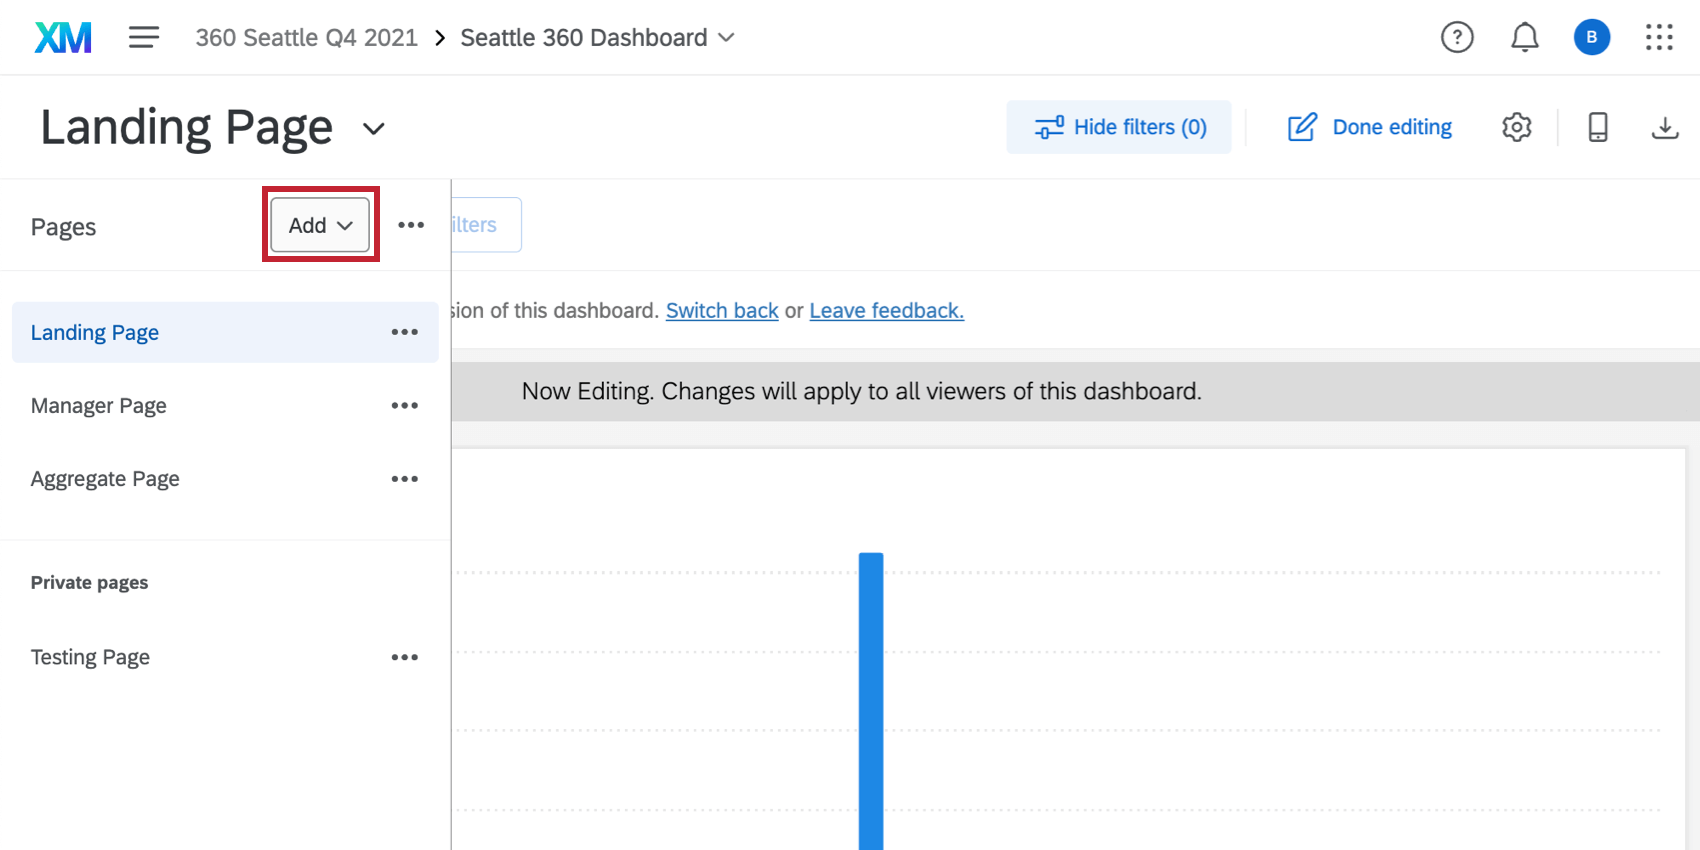
Creating & Managing Pages
Adding pages to your dashboards allows you to effectively organize your data and widgets in whatever way you would like. To create a new page, click Add from the menu on the left. See Creating & Managing Pages for more information.
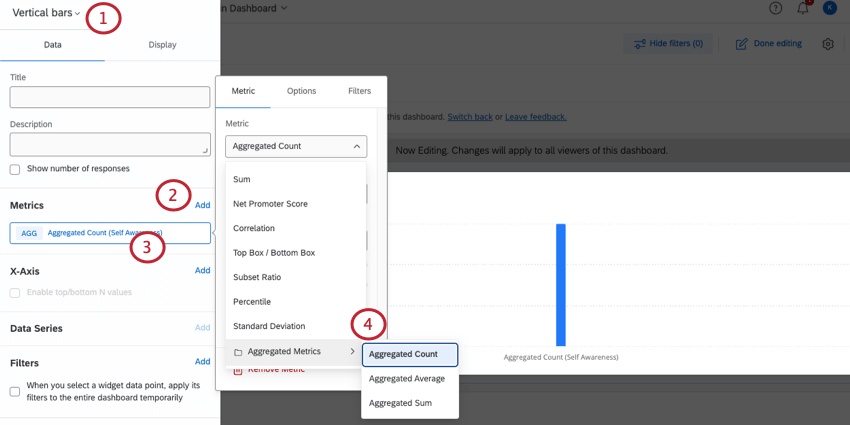
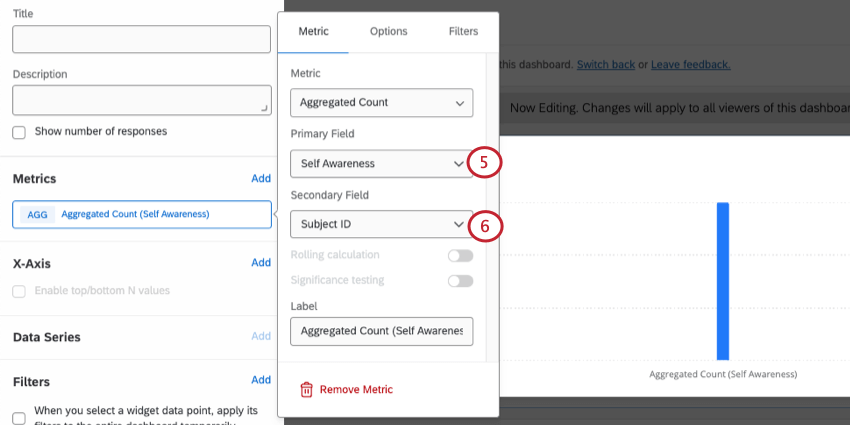
Aggregated Metrics
Qtip: Aggregated metrics are only available in 360 dashboards.
Attention: You cannot use aggregated and non-aggregated metrics in the same widget.
Aggregated Metrics ensure that data is calculated accurately for multi-rater feedback.
In a 360 project, each subject’s number of evaluations may vary. Aggregated metrics normalize scores on the subject level to report on department performance. This prevents department scores from skewing towards a single individual.
Example: Let’s say we have two subjects whose scores we aggregate on a department level. Subject A receives scores 1, 1, and 5 for their evaluations. Subject B receives a score of 5. To calculate the average aggregated score, first take the average for each subject. Subject A averages to (1 + 1 + 5) / 3 = 2.33. Subject B averages to 5. Then, take the average of the averages, giving an aggregated department score of (2.33 + 5) / 2 = 3.67.
Compare this against the department score if we did not take a weighted average: (1 + 1 + 5 + 5) / 4 = 3. The department’s overall score is lower since it skews towards the individual with more evaluations.
To add an aggregated metric:
Exporting Dashboards
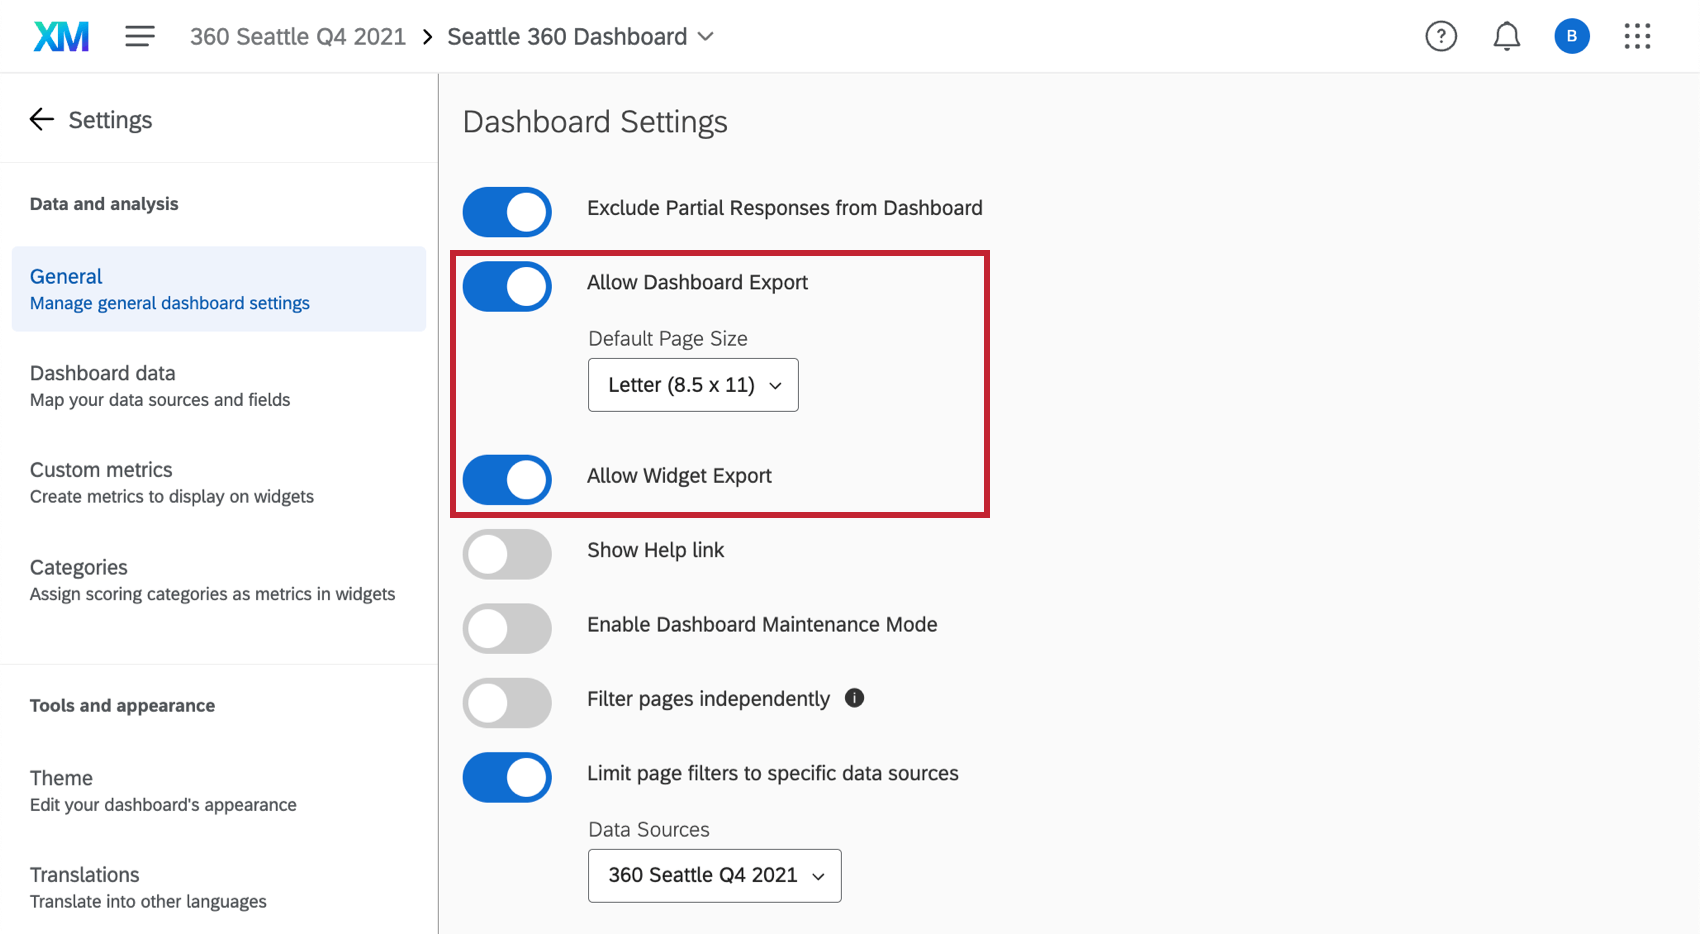
To export dashboards, the dashboard administrator must enable Allow Dashboard Export in General Dashboard Settings, which allows dashboard viewers to export dashboard pages. They can also enable Allow Widget Export to enable individual widget exports.

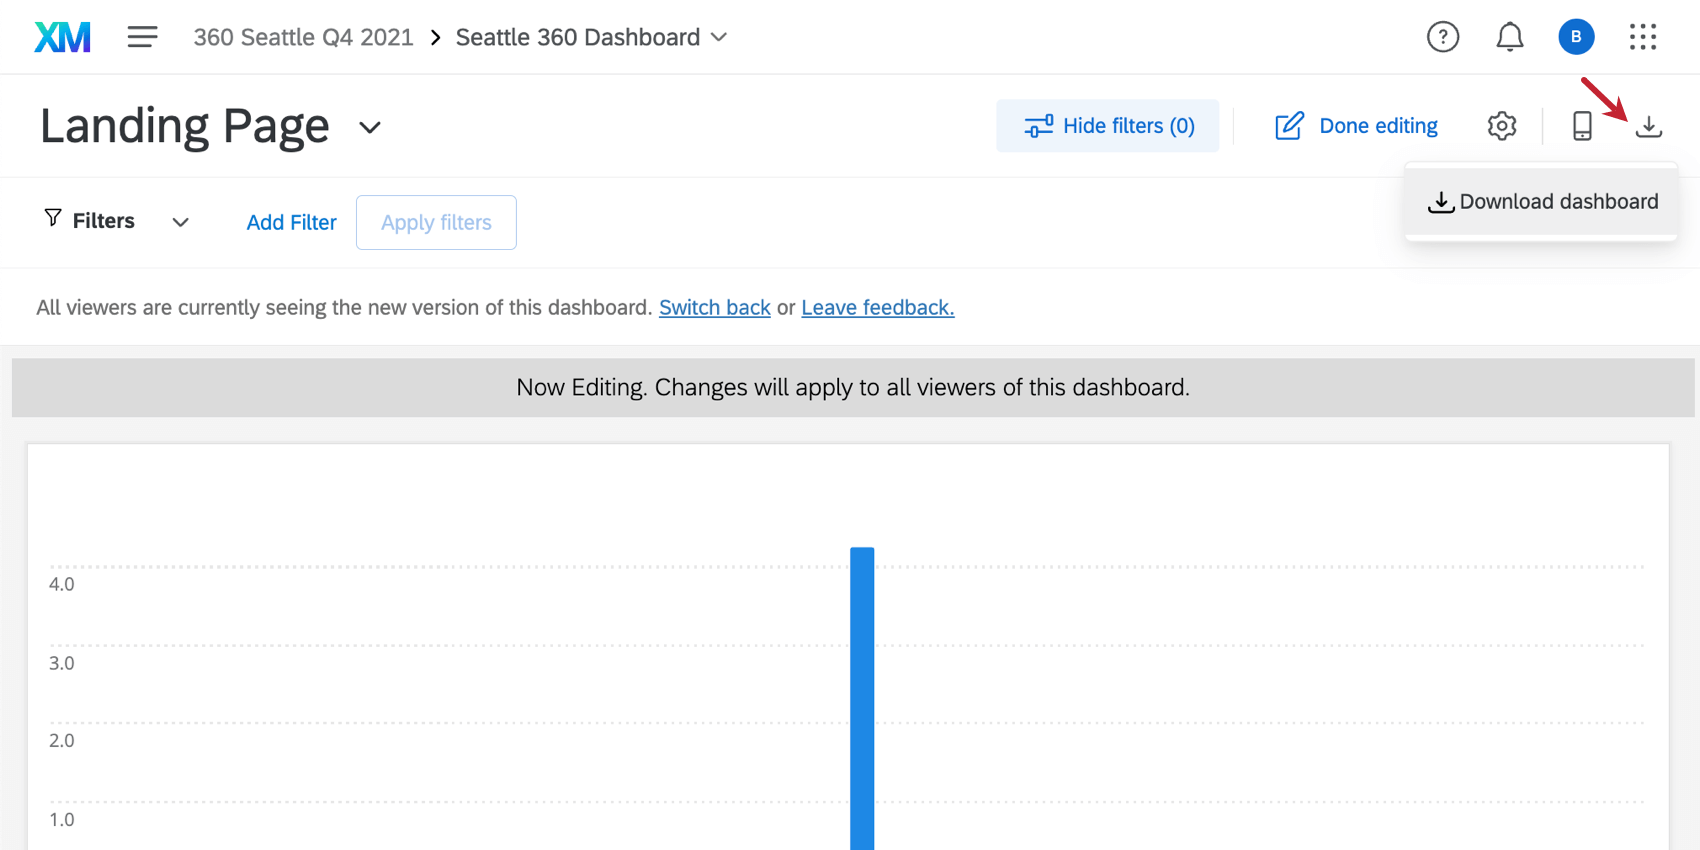
To export a dashboard page, users can click the export button at the top of the dashboard.

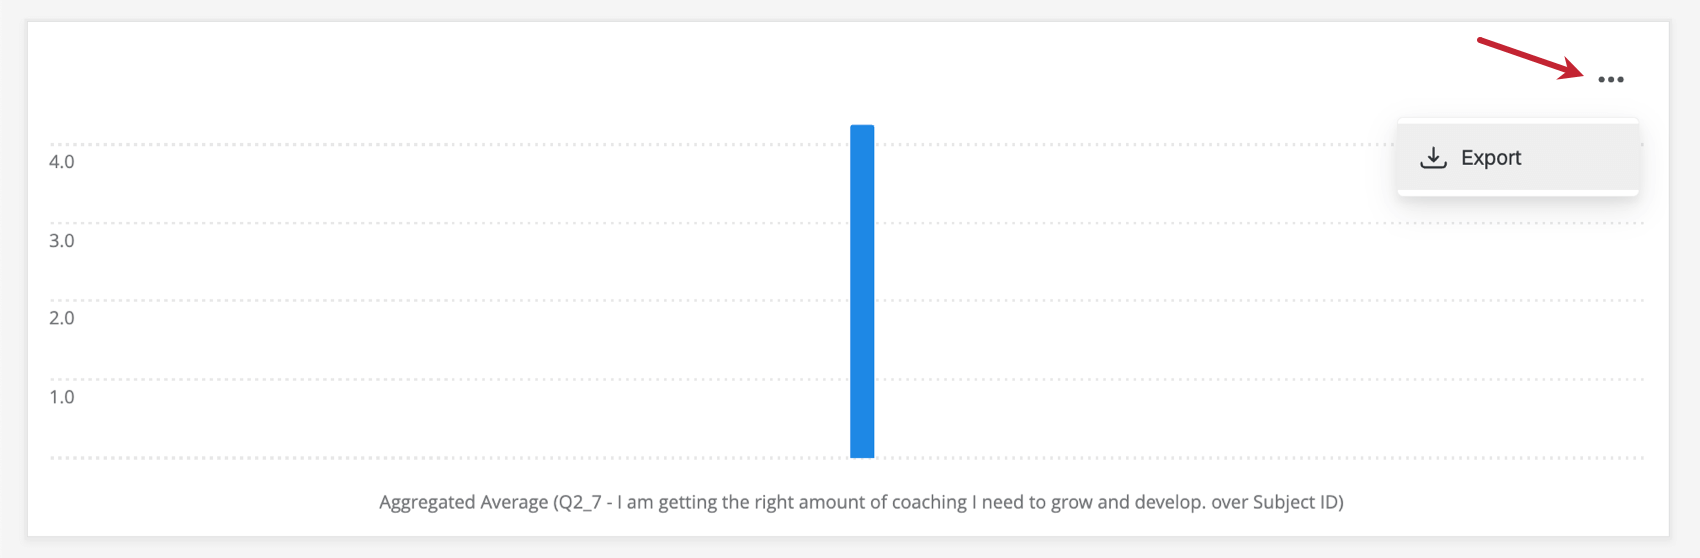
To export a widget, users can click the 3 dots and then Export in the top-right corner of the widget.

For more information about exporting dashboard content and the options available to you when exporting, see Making Dashboards Available for Export.
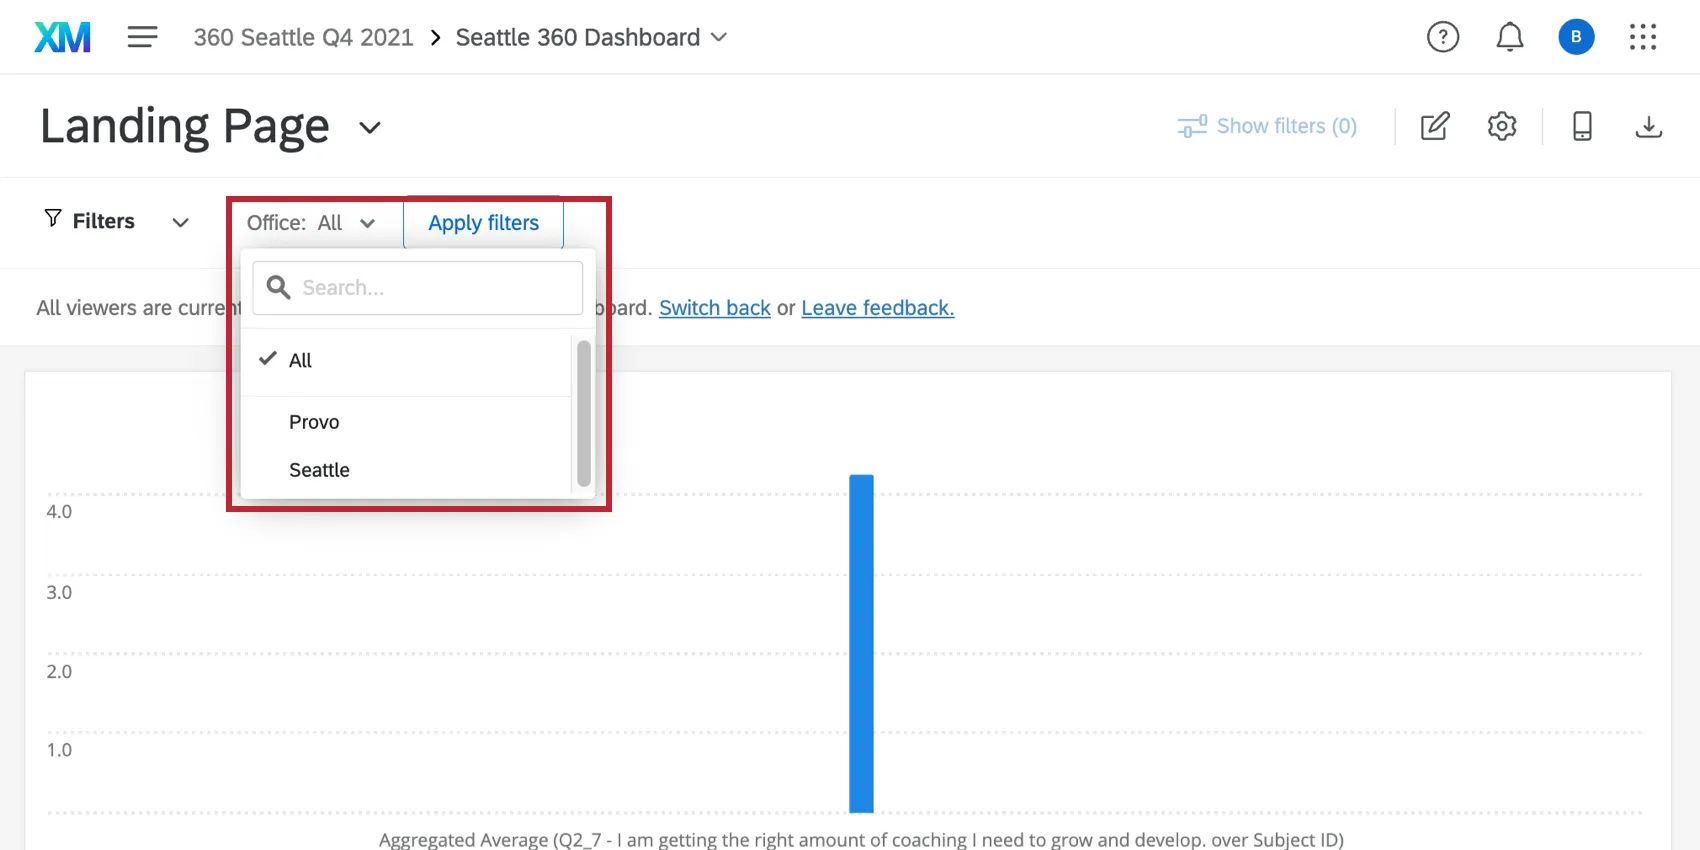
Filtering Dashboards
You can filter your dashboards by applying a filter to a page or by applying filters to individual widgets. This allows you to dive into the data and find trends that you would not be able to see with the data in aggregate alone. For more information, see Filtering Your Dashboard.
Qtip: 360 dashboards do not have org hierarchy filters.
Widgets
Widgets are the graphs and tables that illuminate the data for everyone who visits the dashboard, and there are many different kinds to suit your unique reporting needs. To learn more about adding and customizing widgets, see the Widgets Basic Overview.
360 dashboards have a limited number of widgets. Available widgets include:
- Line Widget
- Horizontal Bar Widget
- Vertical Bar Widget
- Table Widget
- Donut / Pie Widget
- Record Table Widget
- Image Widget
- Rich Text Editor Widget
- Word Cloud Widget
- Response Rates Widget
- Response Ticker Widget
- Gauge Chart Widget
Unique to 360 dashboards, line and bar widgets contain an aggregated metric, which normalizes scores across subjects to calculate department averages.
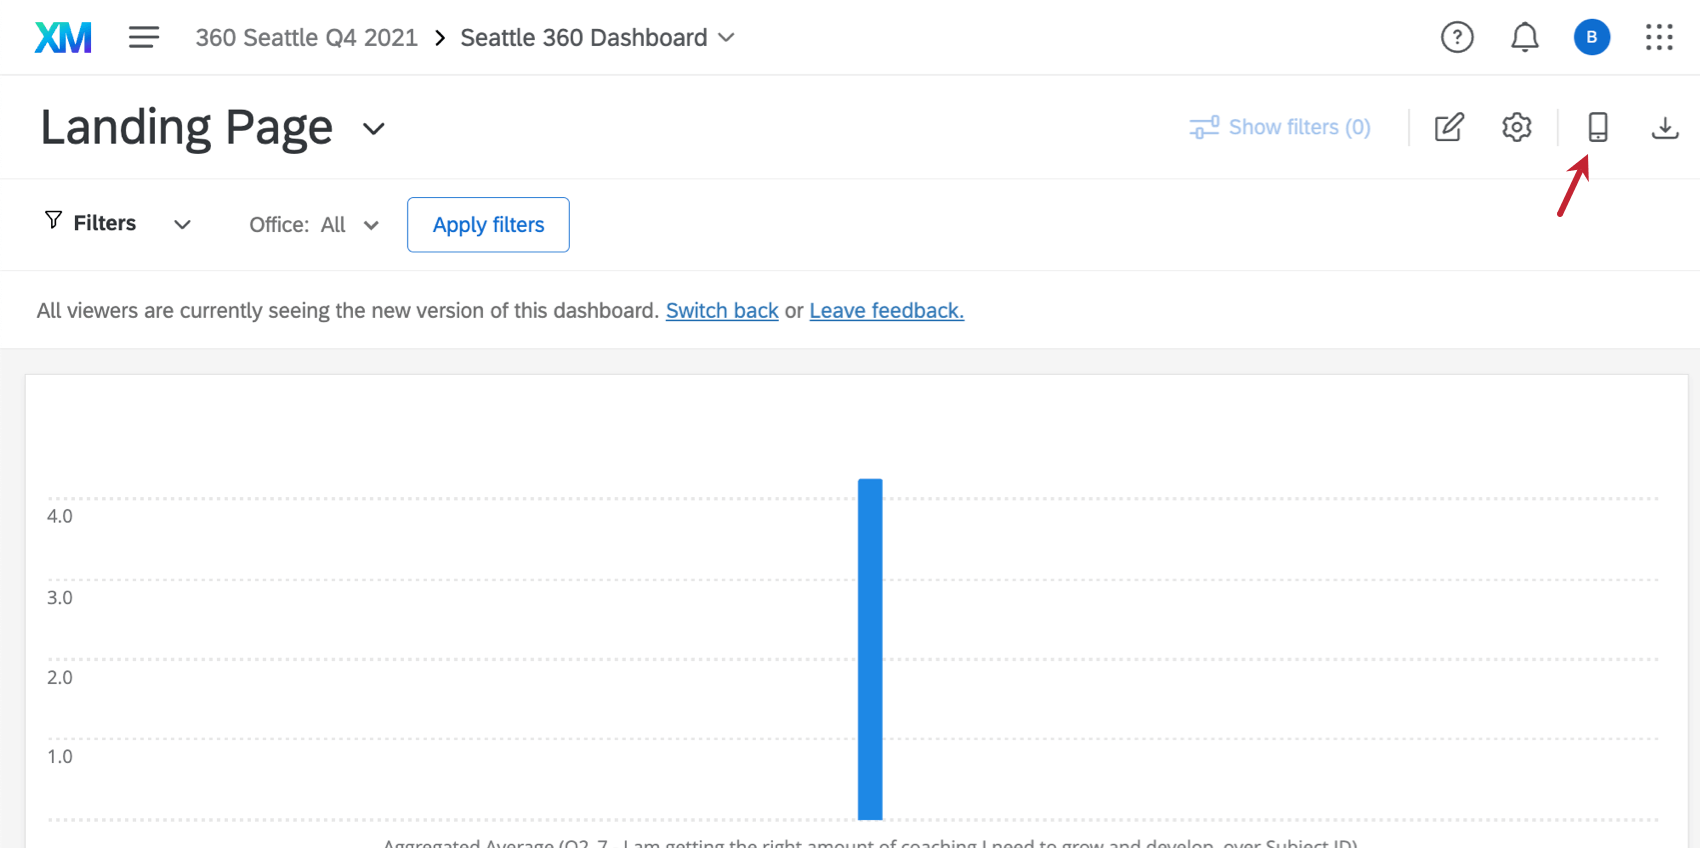
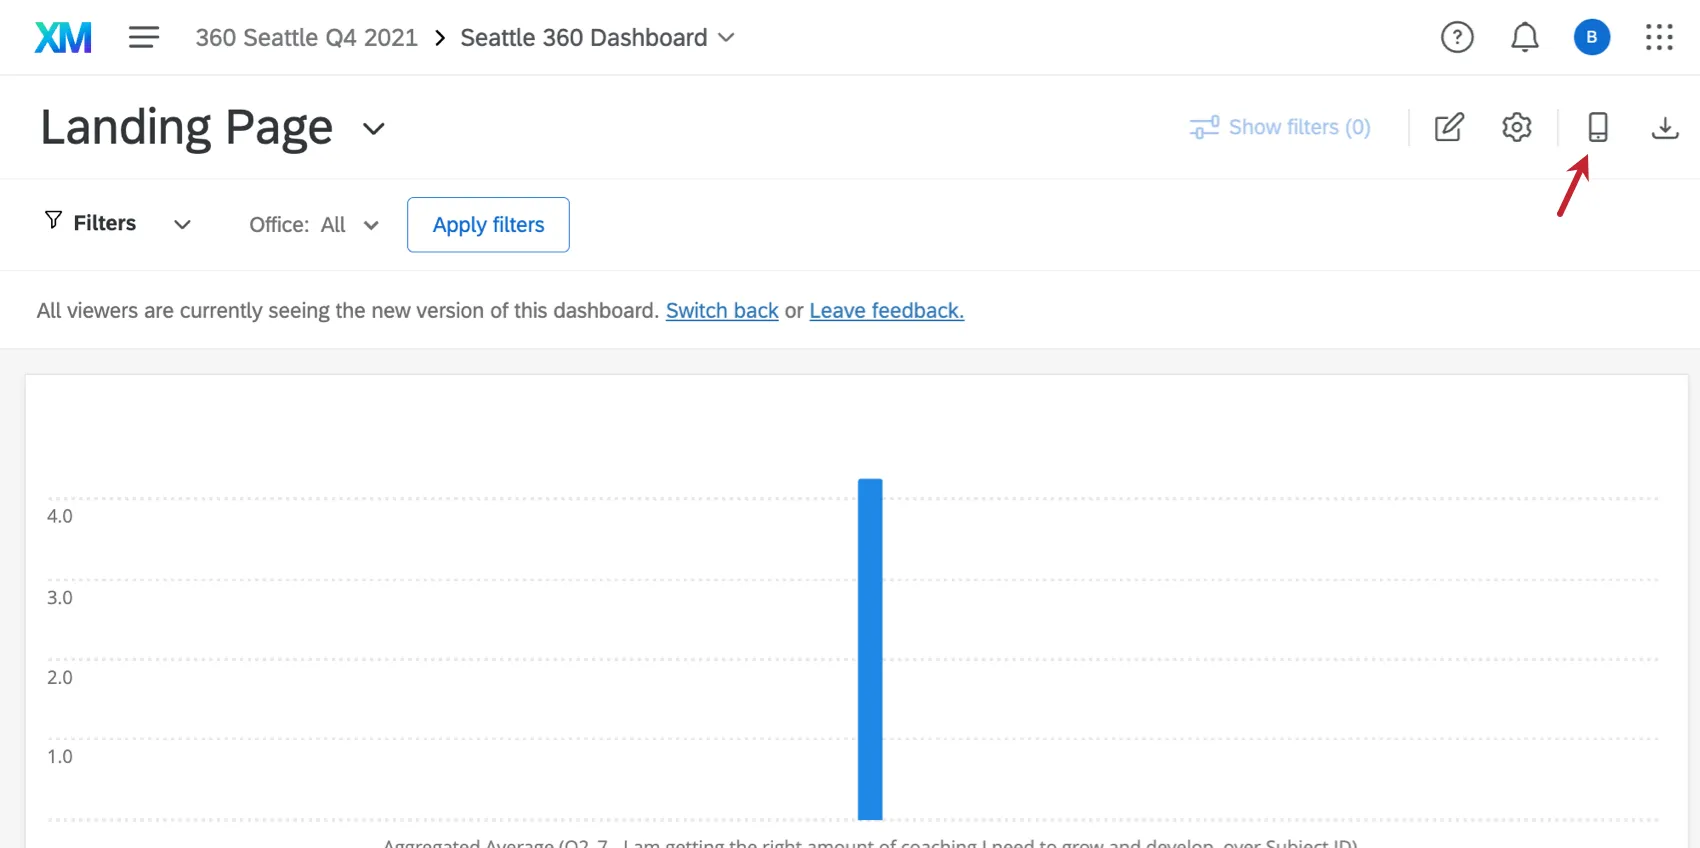
Mobile Preview
If viewing your dashboard in the XM App, the mobile preview allows you to see what your dashboard will look like on a mobile device so you can optimize the design. For more information, see Mobile Preview.
360 Dashboard Data
Mapping data for 360 dashboards is mostly the same as it is for other EX dashboards. See Dashboard Data for more information. This section will cover the characteristics unique to 360 dashboards.
An important distinction for 360 dashboards is that you cannot modify metadata field names or add new metadata fields after you’ve created your dashboard. However, you can still update values for existing metadata fields by choosing Update All Responses with Current Metadata in Participant Options.
In addition, 360 dashboards do not support the following:
- Text iQ
- Comparisons
- Benchmarks
Scoring Categories
360 dashboards support survey scoring categories for reporting in your dashboard. For more information, see Categories in 360 Dashboards.
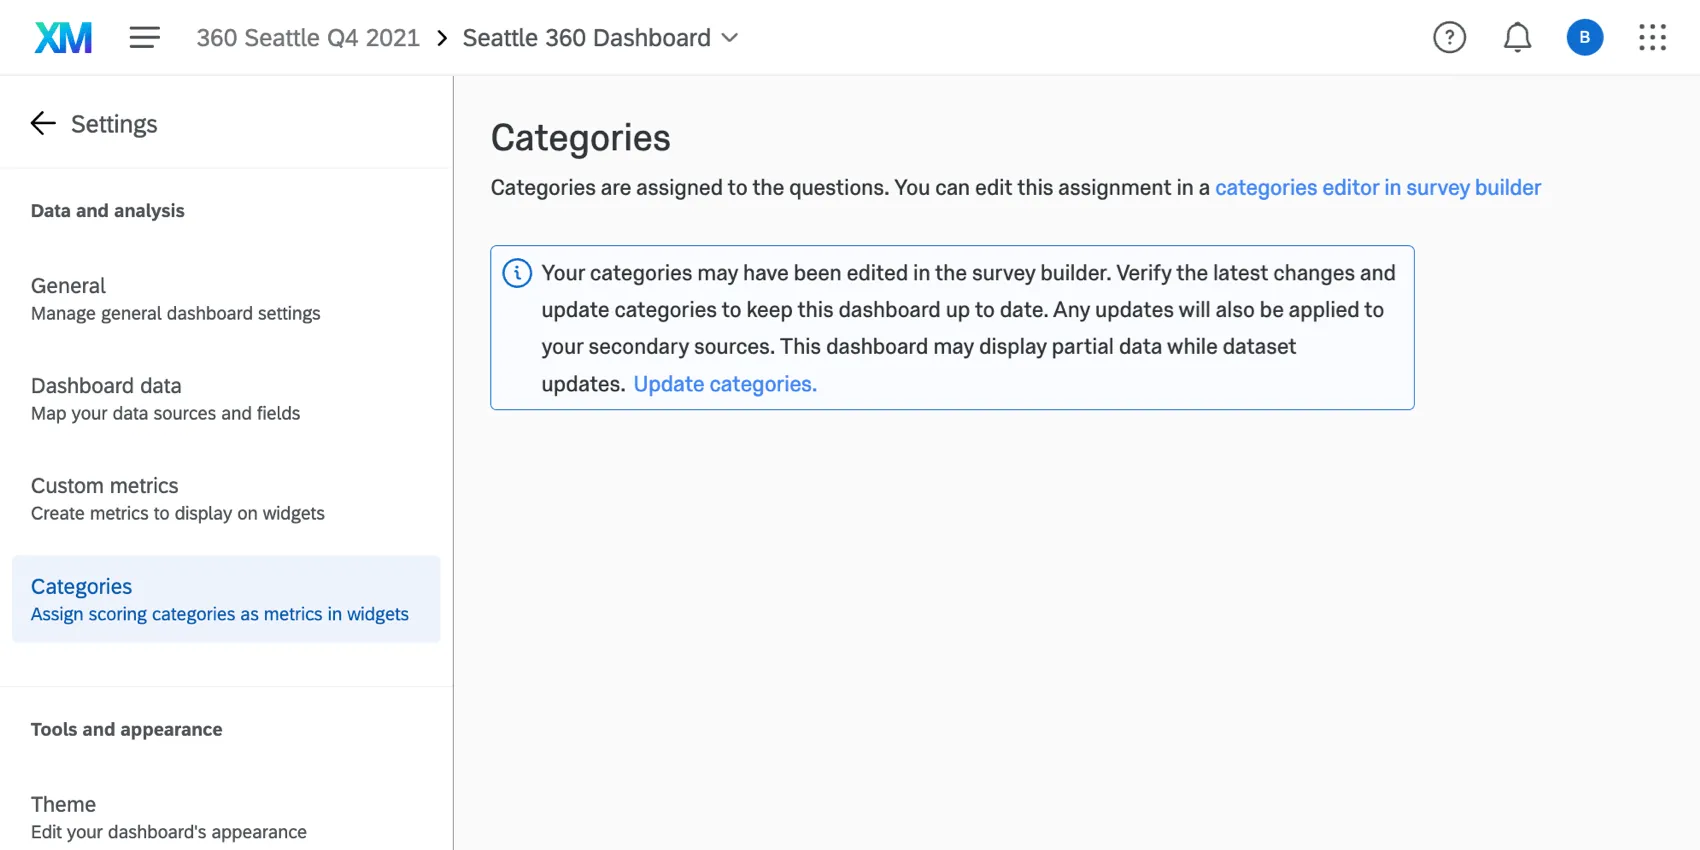
Qtip: Scoring categories cannot be remapped from within the dashboard data tab. When you add sources to your dashboard, if scoring categories are not initially mapped, make sure that the scoring categories are named exactly the same in the primary source and the historical survey. Once you’ve verified that, update the Categories section in your dashboard settings.
That's great! Thank you for your feedback!
Thank you for your feedback!