
Crosstabs Options
What's on this page
About Crosstabs Options
Crosstabs include a variety of options that allow you to filter statistics, adjust the confidence level, and share your data with others.
Qtip: For more on how to report on and analyze statistics, see the Crosstabs support page.
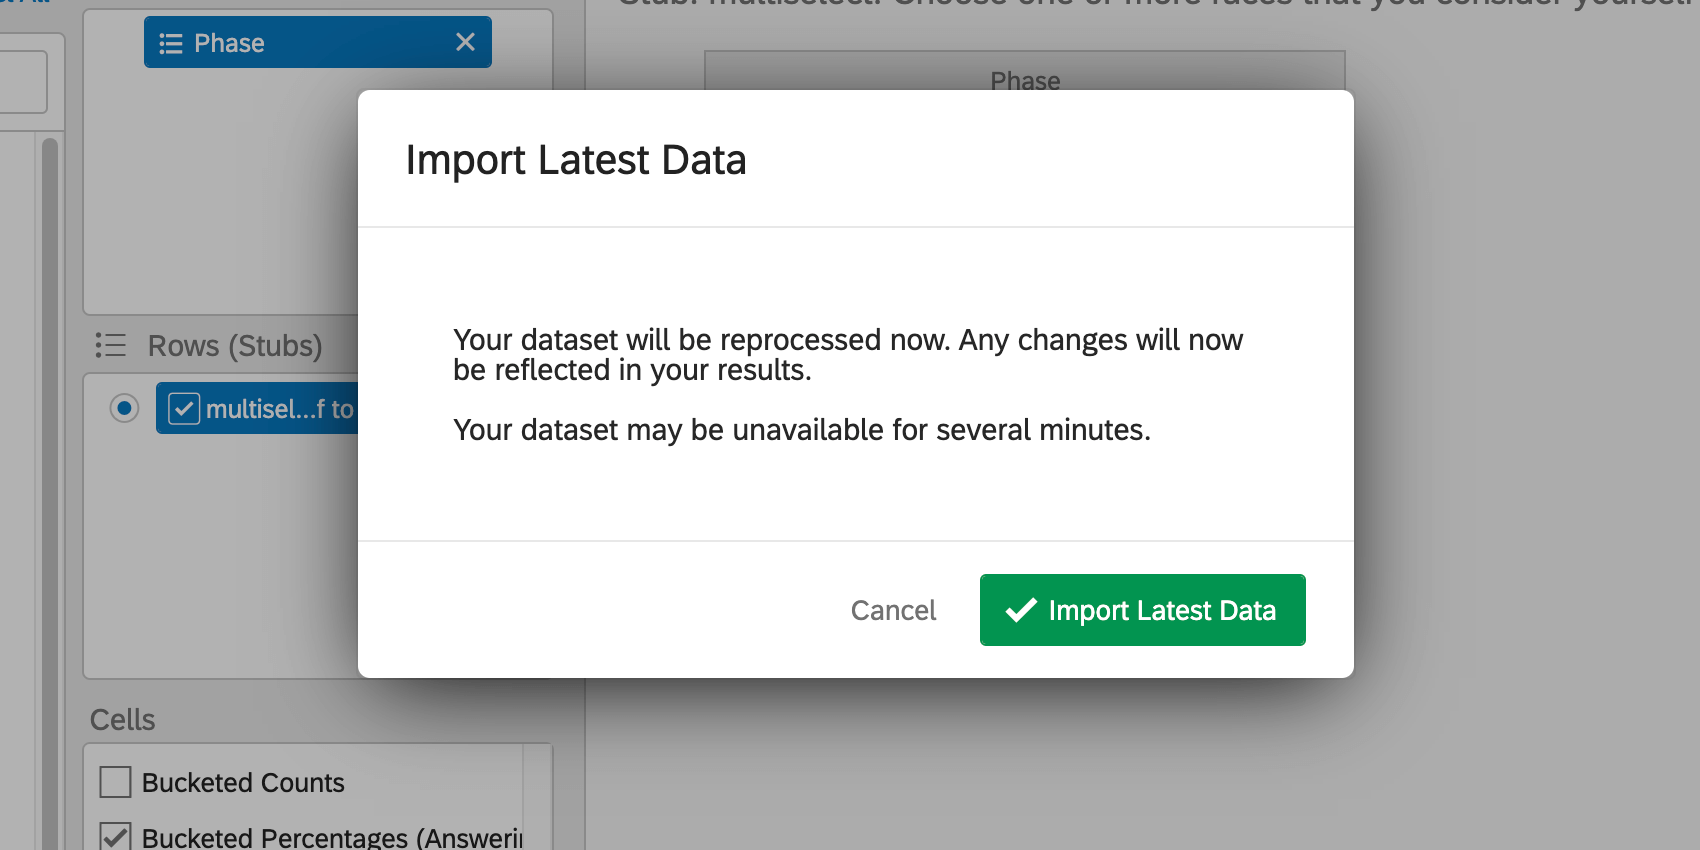
Importing the Latest Data
Crosstabs does not automatically refresh as new data is collected in your survey. In order to incorporate your latest findings into your calculations:

Confidence Level
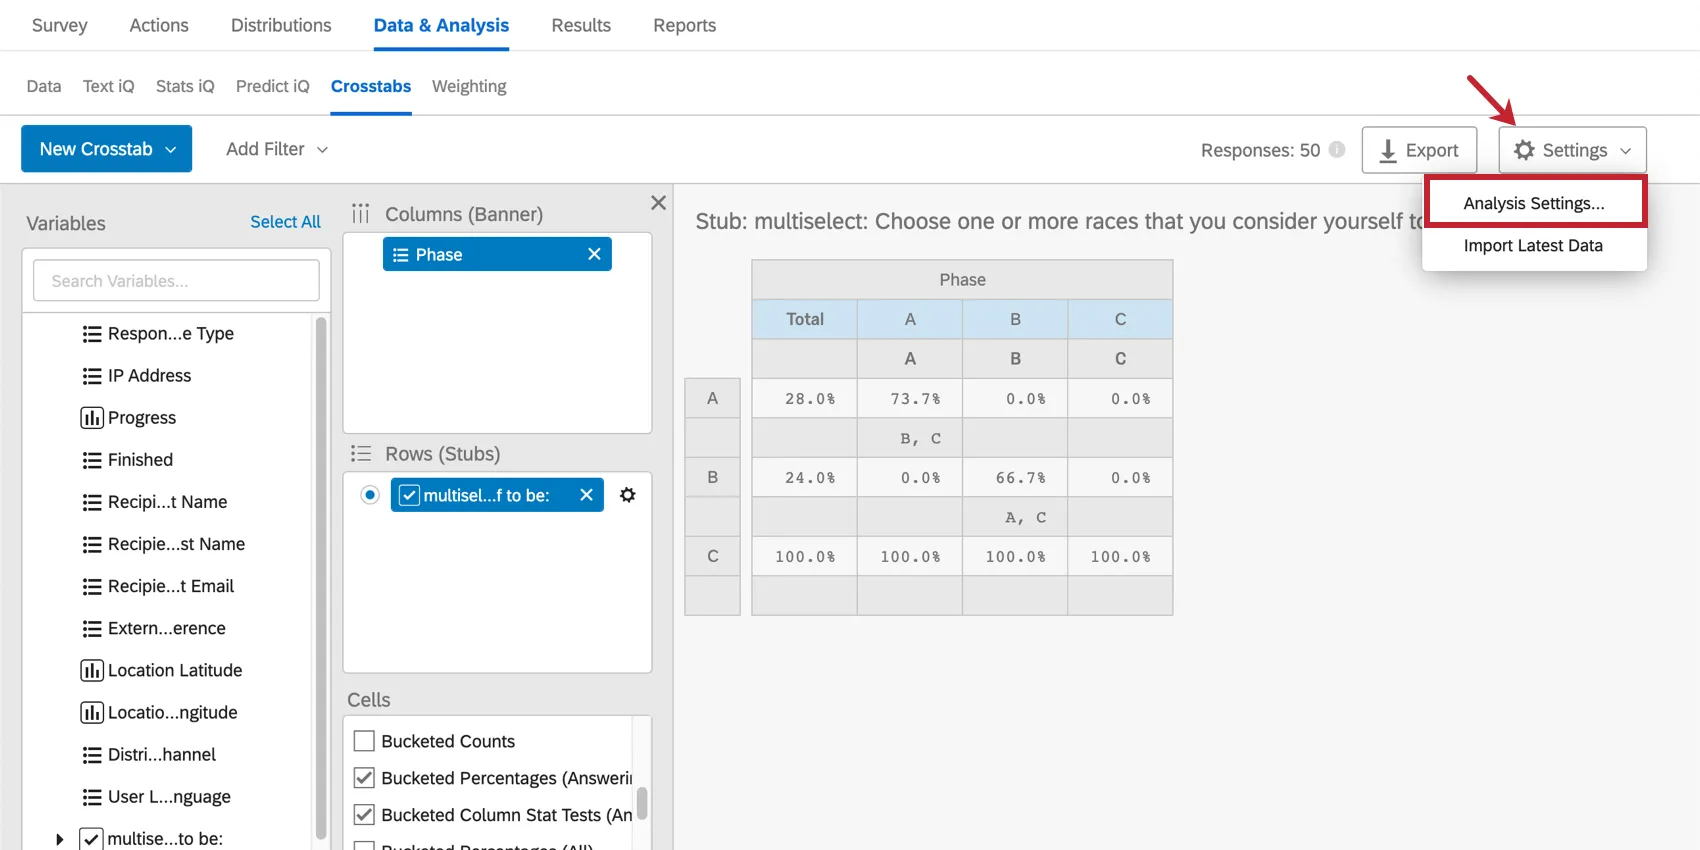
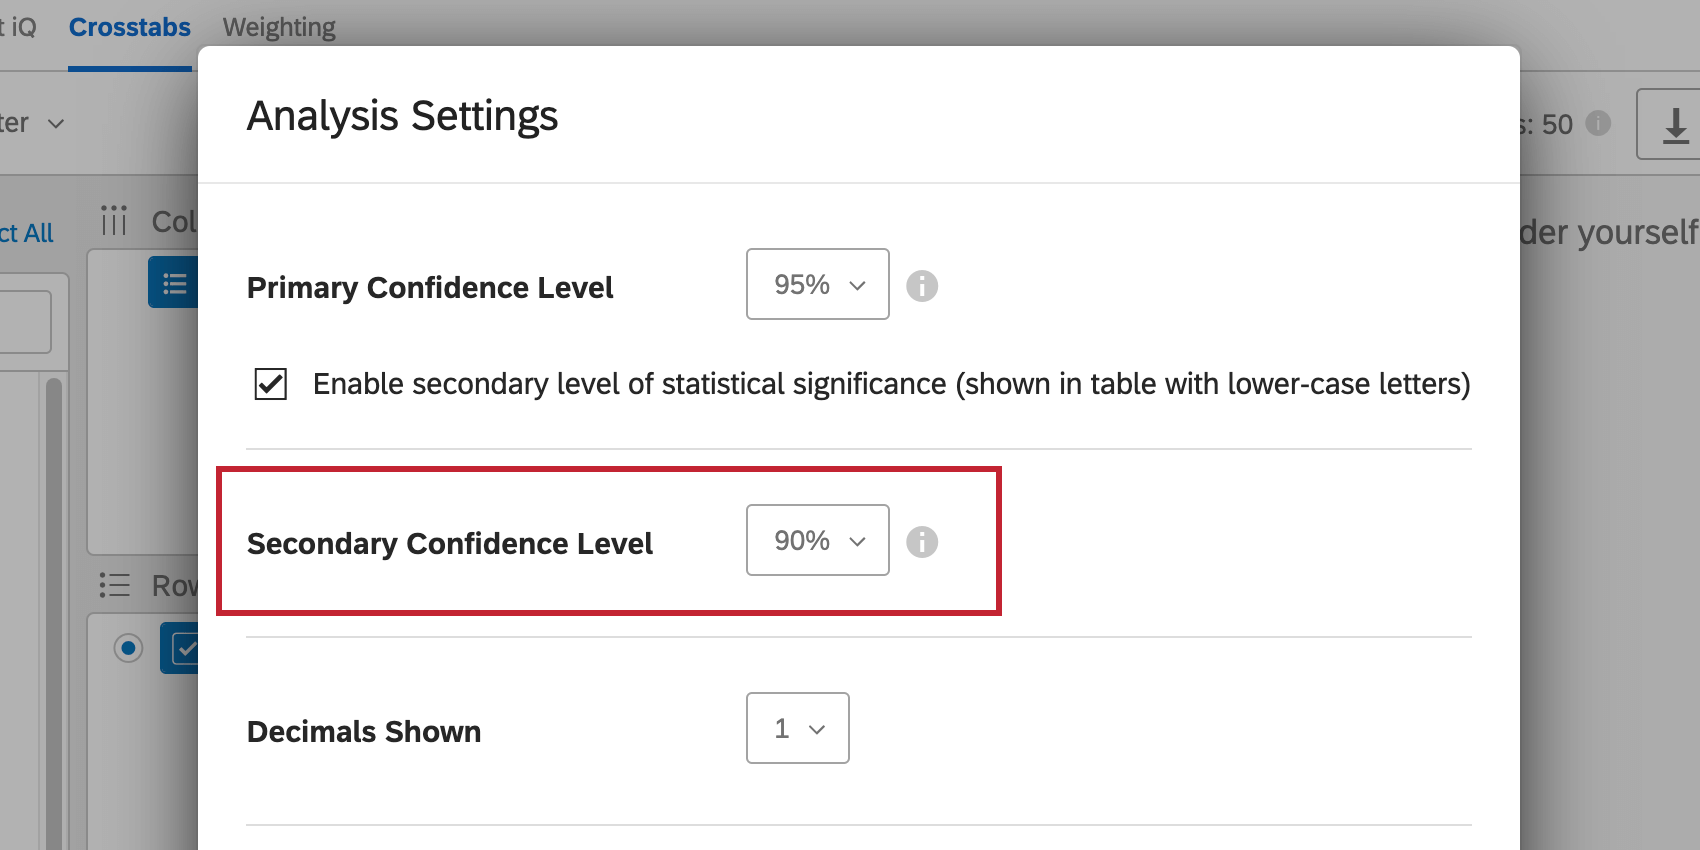
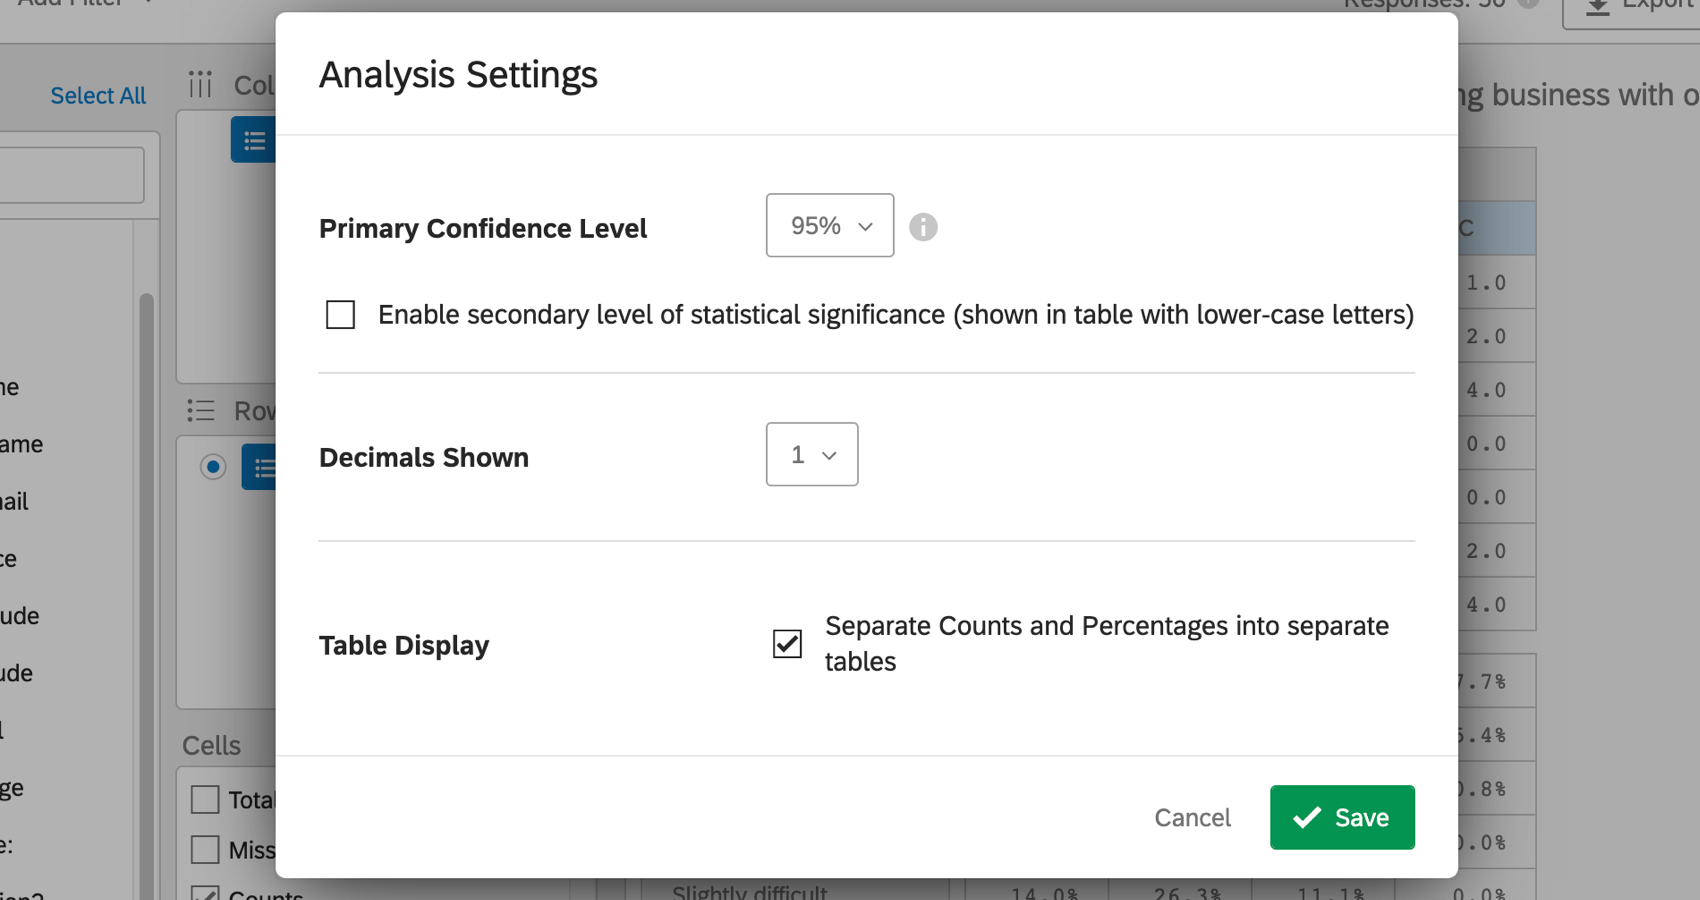
The confidence level adjusts the point at which you want statistical results to be marked as significant. To adjust this level, click Settings in the upper-right and select Analysis Settings.

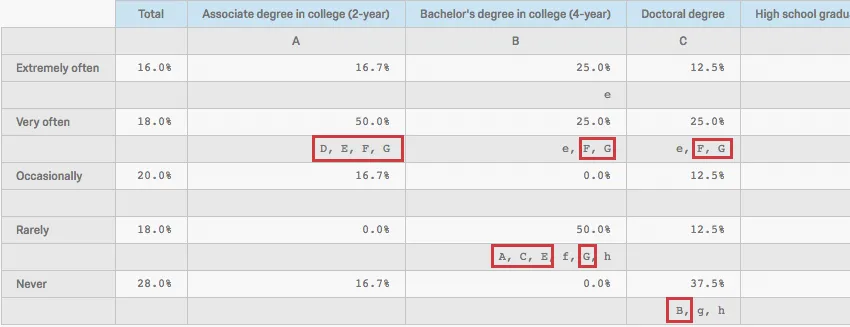
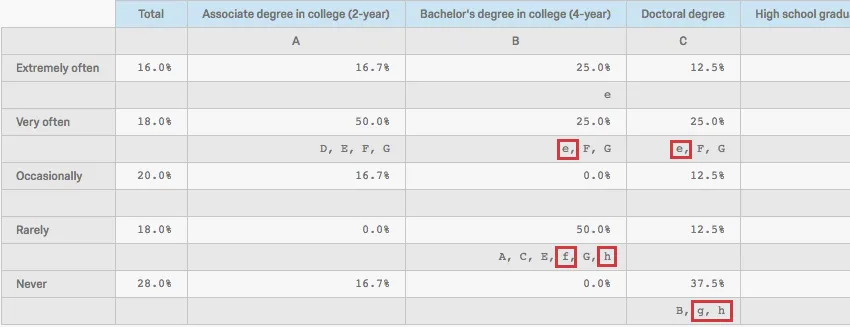
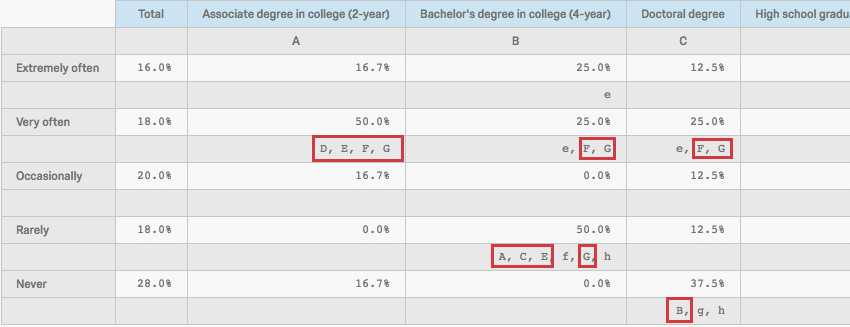
Both primary and secondary confidence levels can be adjusted, and will appear on the same tables. These confidence levels are needed to determine significance in pairwise stat tests. This includes cells such as Column Stats Tests (Answering) and Column Stats Tests (All).
Primary Confidence Level
Click the dropdown to select a different primary confidence level.
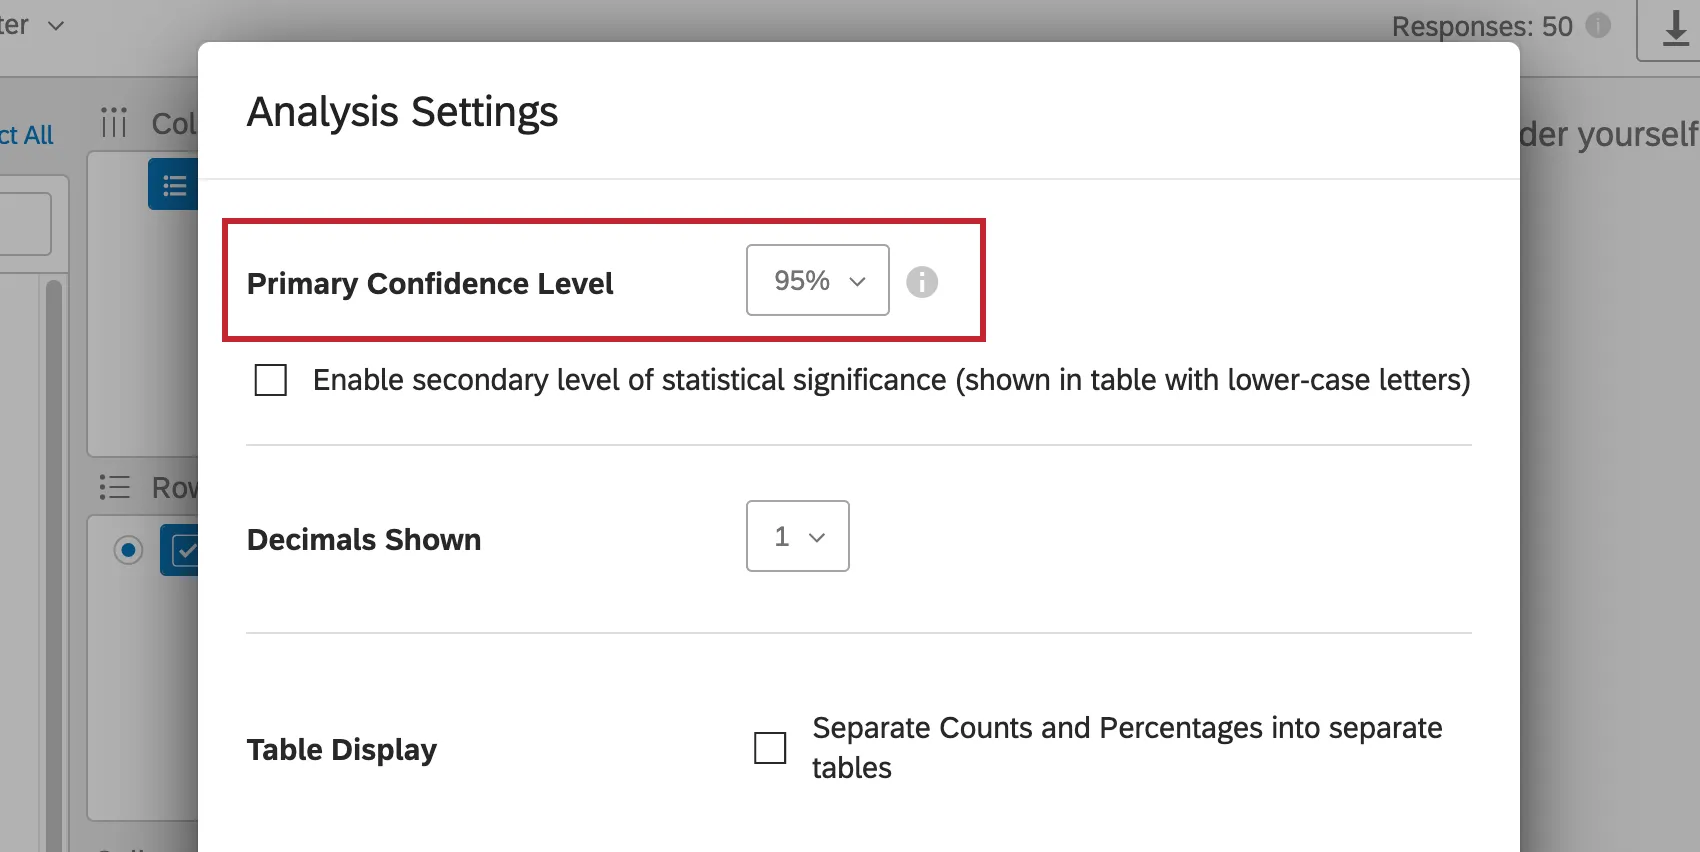
This is the confidence level at which you’d like statistical significance to be indicated with uppercase letters in pairwise stat tests.
This confidence level will also be used to calculate statistical significance in “Overall” stat tests. This includes cells such as Overall Stat Test of Column Averages and Overall Stat Test of Percentages.
Secondary Confidence Level
Select Enable secondary level of statistical significance (shown in table with lower-case letters). Then select a confidence level from the dropdown.
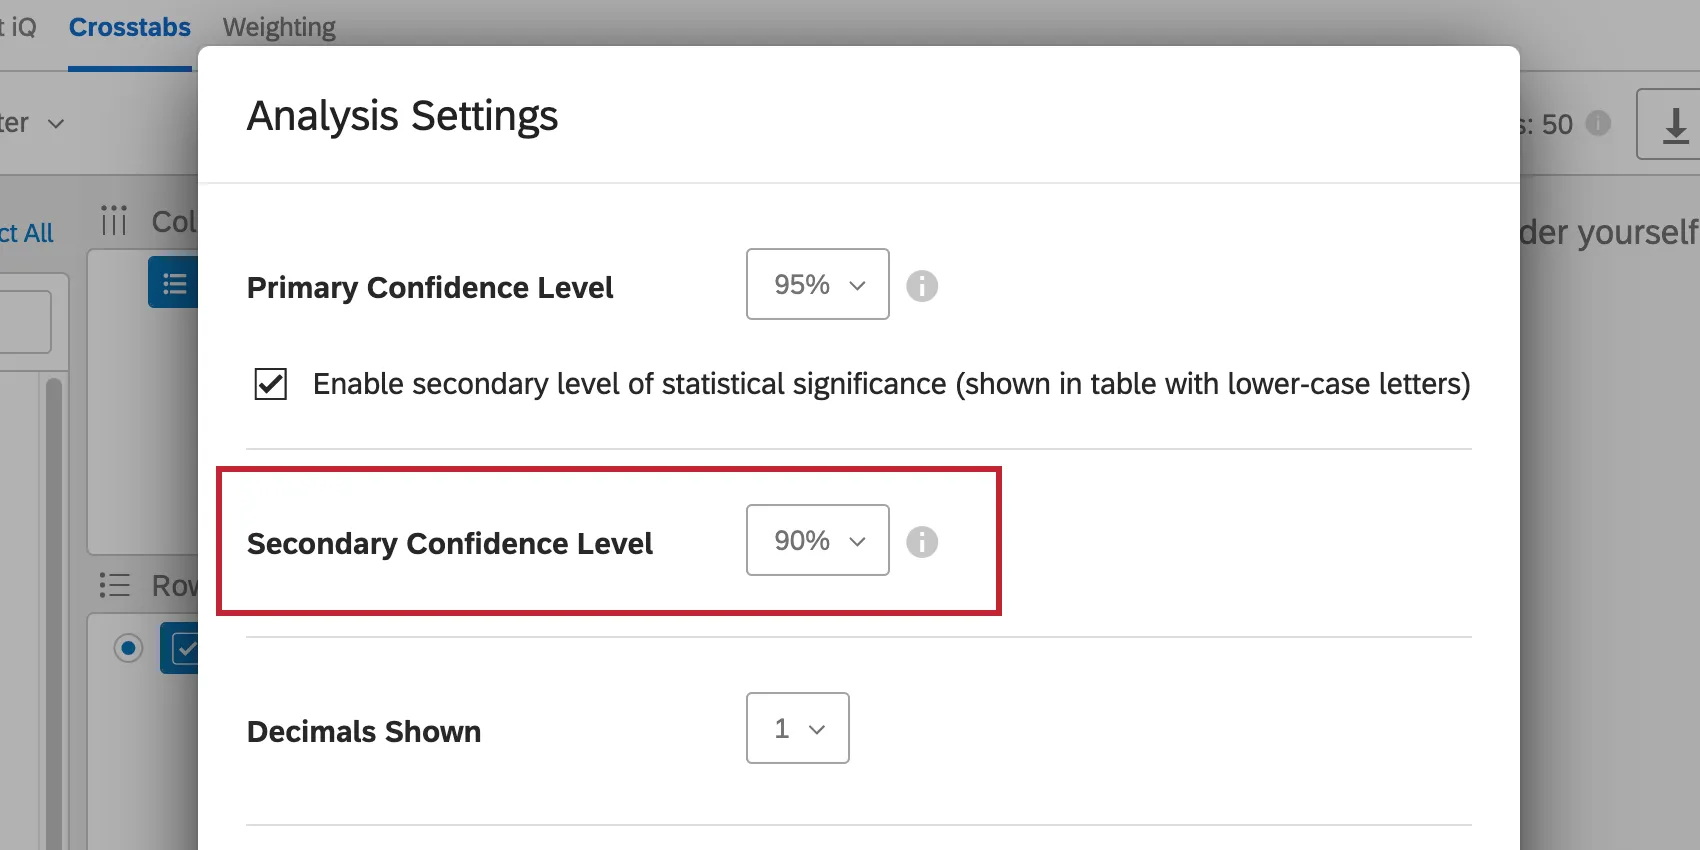
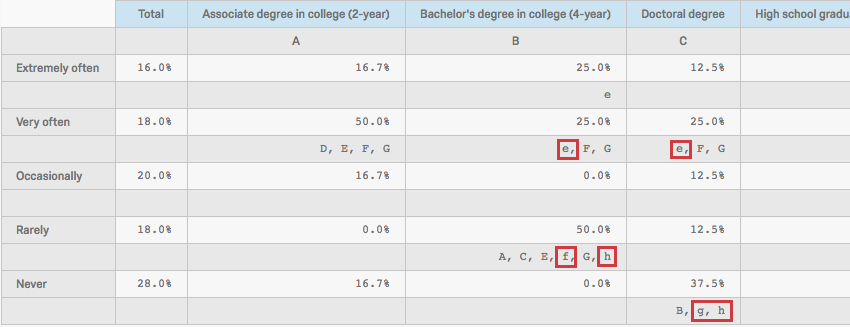
This is the confidence level at which you’d like statistical significance to be indicated with lowercase letters in pairwise stat tests. This is typically lower than the primary confidence level.
Additional Analysis Settings
In addition to confidence level, you can also use the Analysis Settings menu to adjust the following:

- Decimals Shown: How many decimals are displayed for each value in your crosstabs calculations.
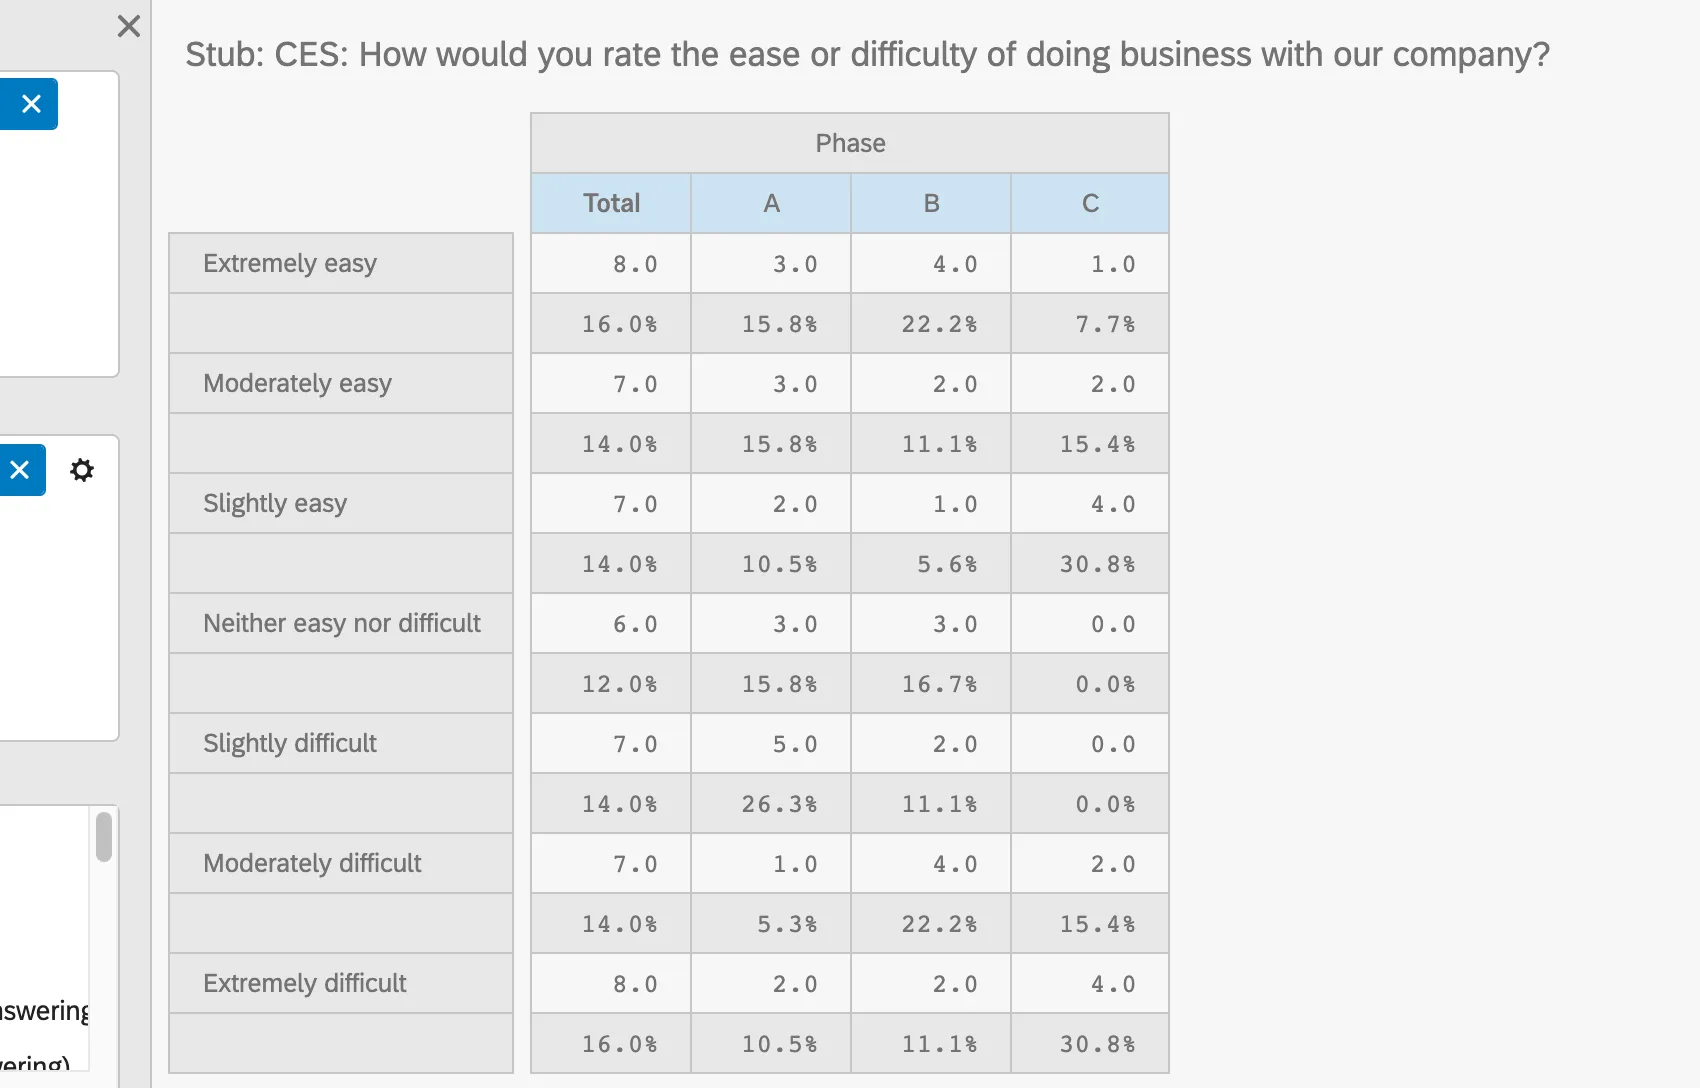
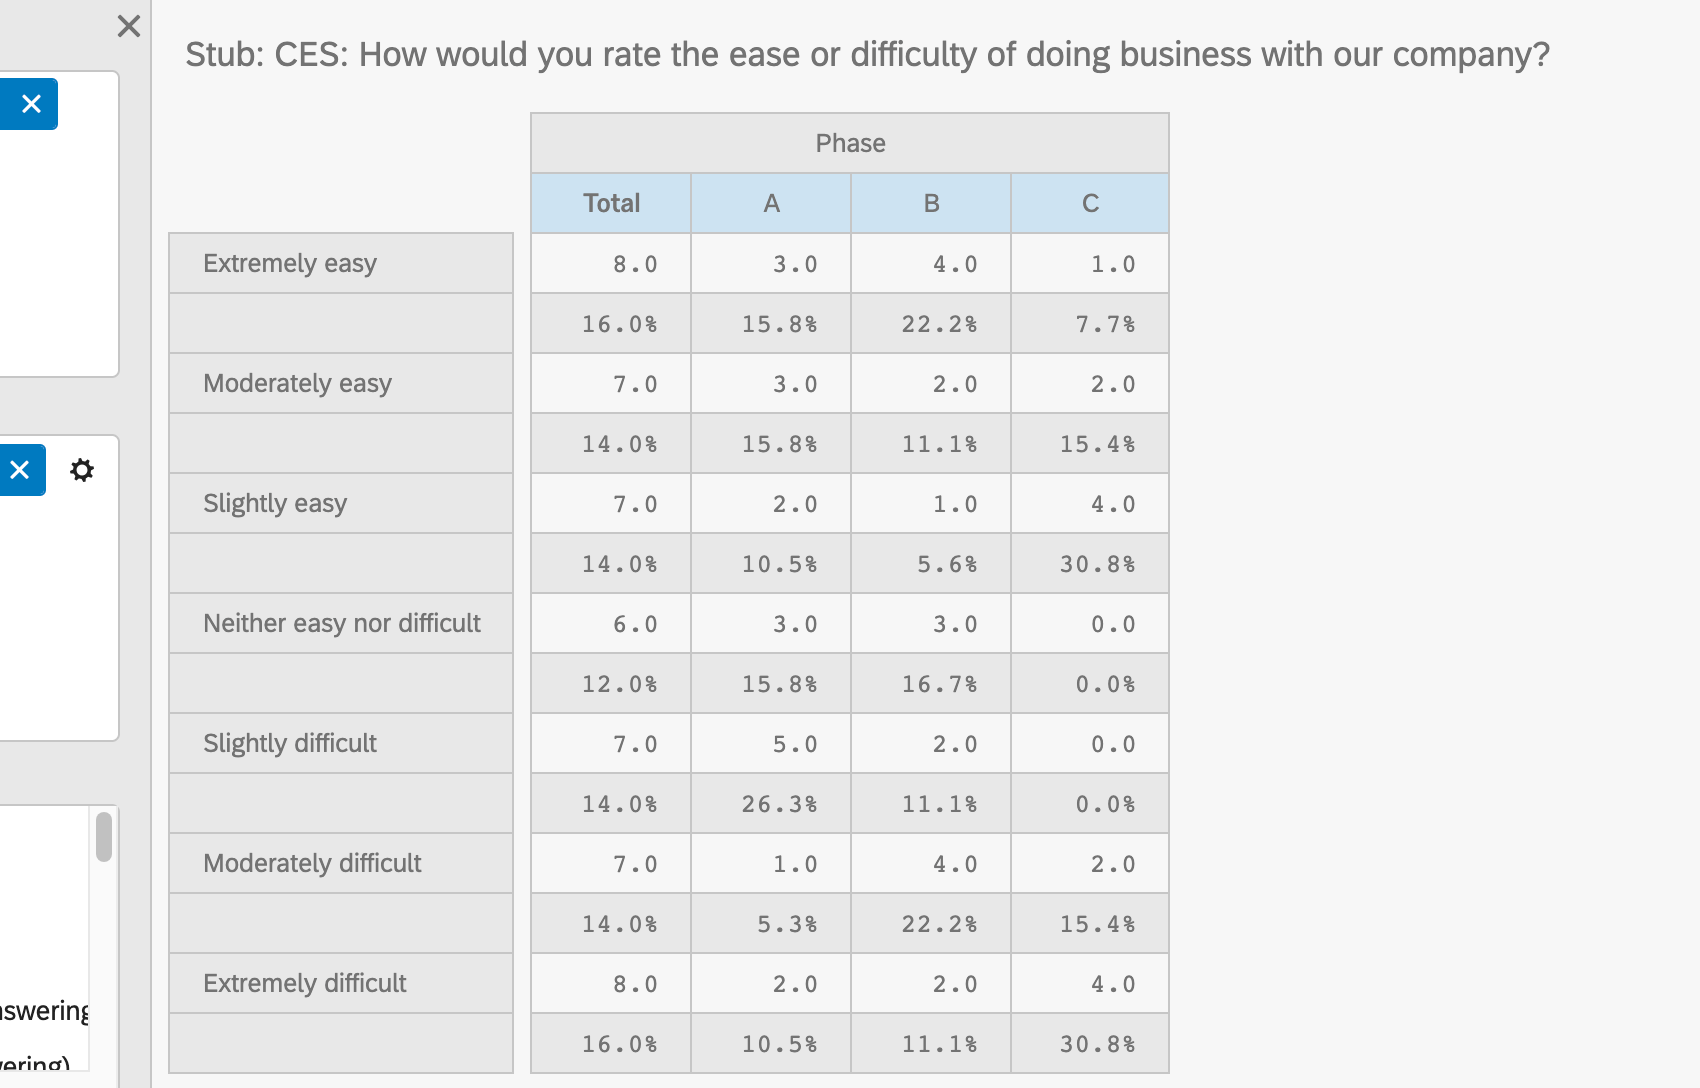
- Table Display: Decide whether to enabled Separate Counts and Percentages into separate tables. This refers to count vs. percentage calculations. This choice does not affect how numbers are calculated and is a purely aesthetic/organizational choice. Example: Here is a table without this setting enabled:

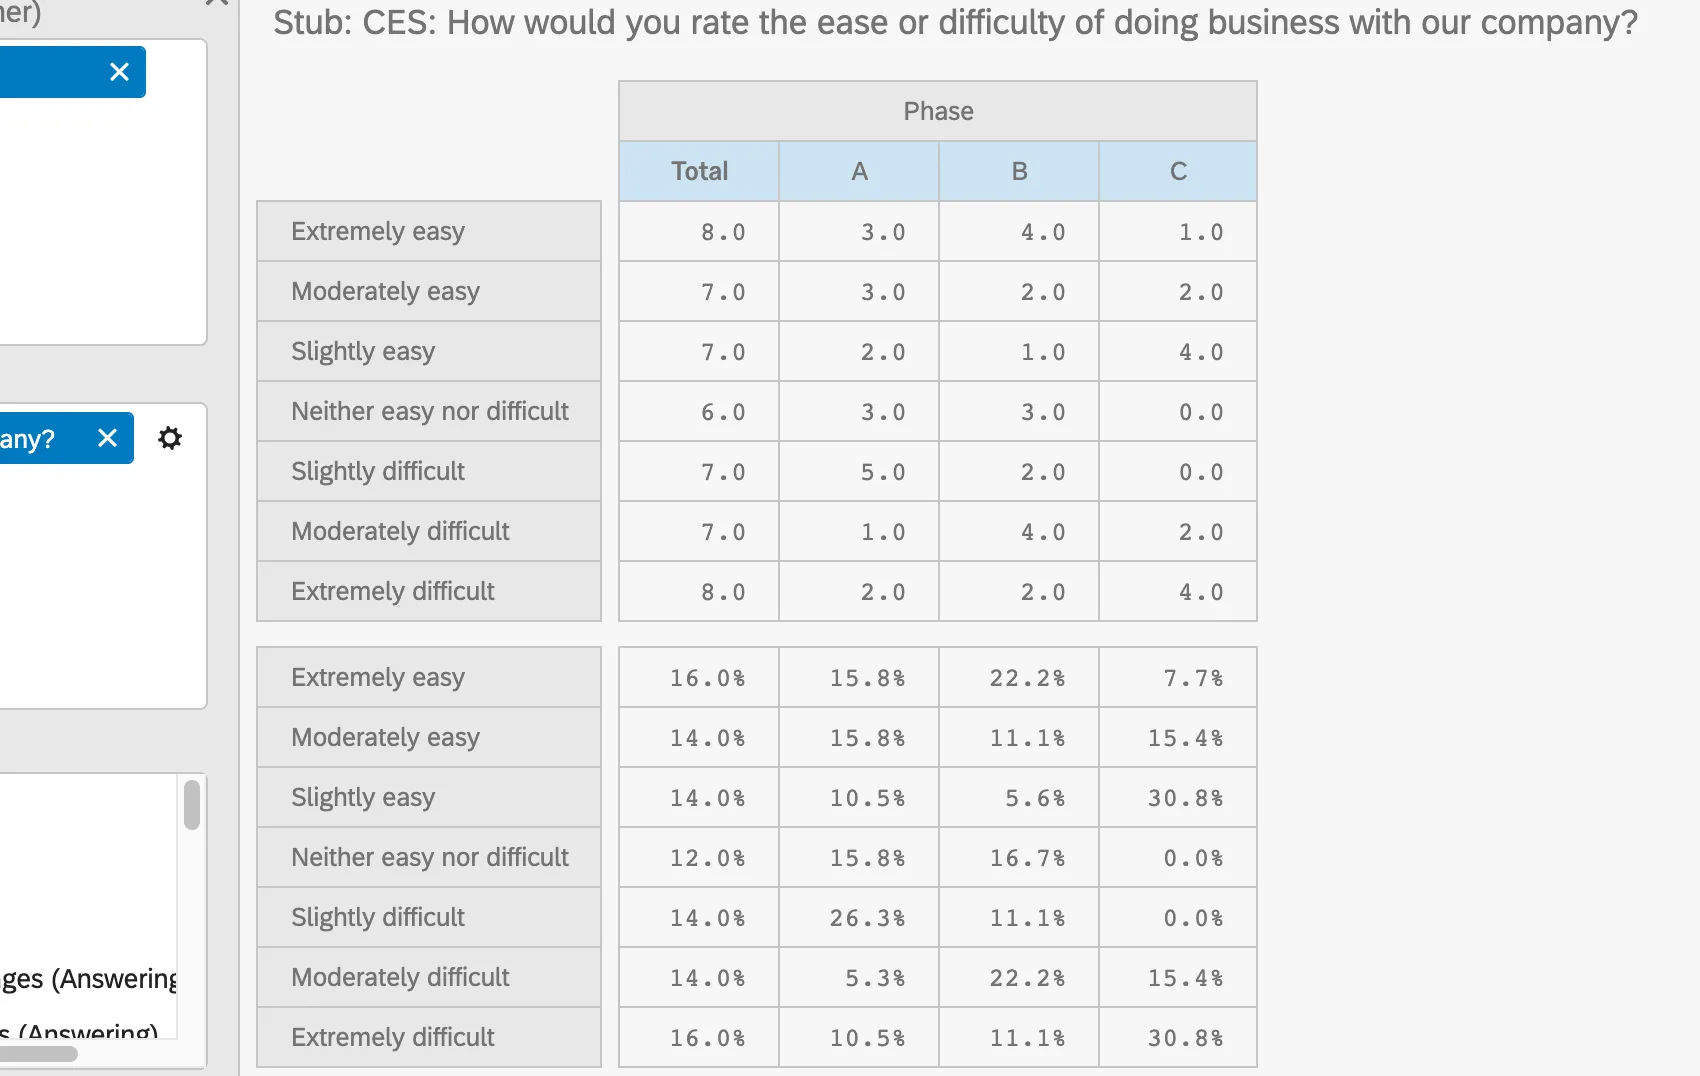
Here is the same crosstab with this setting enabled:

Qtip: Remember to hit Save to keep your changes!
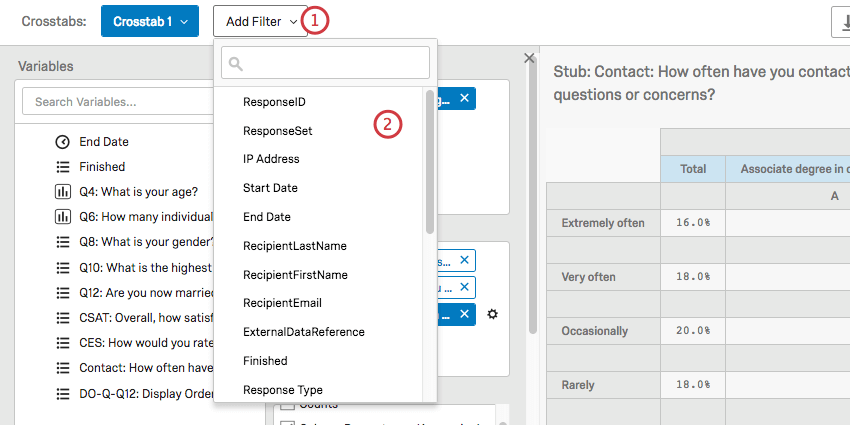
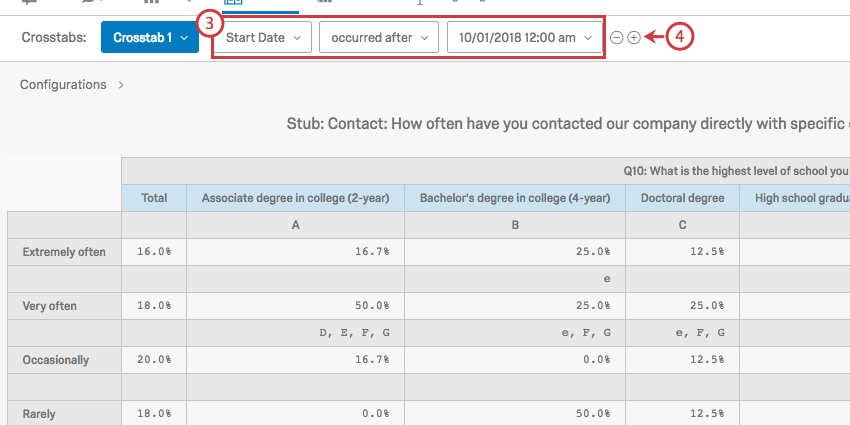
Adding Filters
You can use this series of dropdown menus to add a filter to your crosstab. Note that you are only filtering the crosstab you’ve selected from the upper-left dropdown, not any of the others you have created.
Qtip: Crosstabs can be filtered by questions, Embedded Data, and survey metadata.
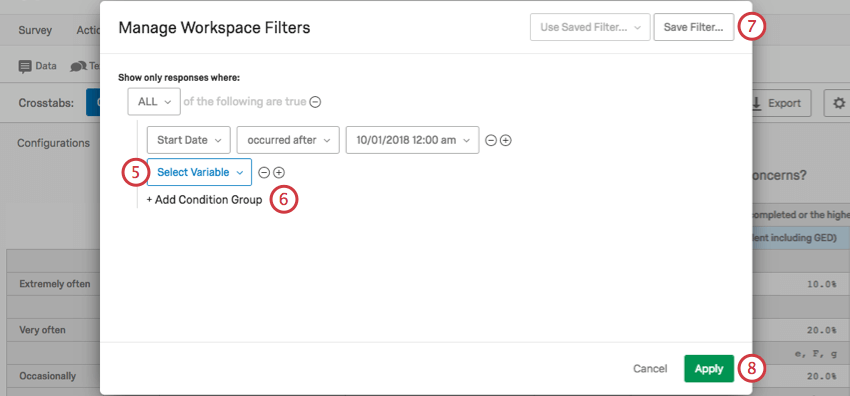
Qtip: Condition Groups are similar to Condition Sets in other Qualtrics filters. You can also see the following linked pages for more information on All vs. Any and Nesting Logic.
Qtip: This option does not apply the filter to other crosstabs – it just saves it so you can use it if you want to.
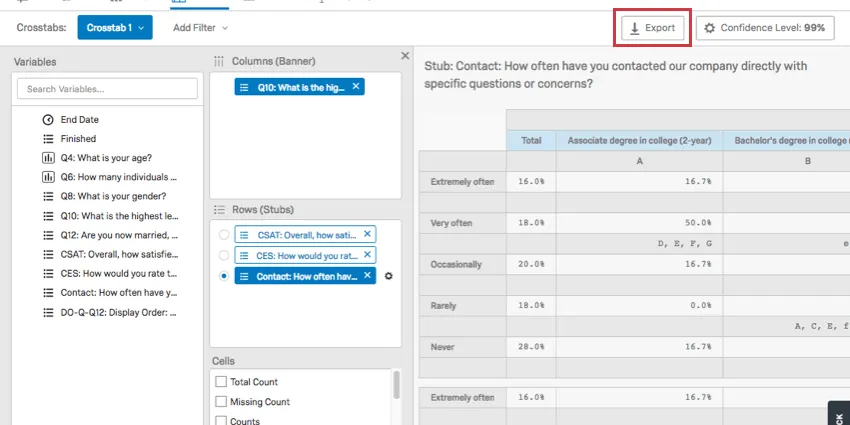
Export Options
You can choose to export your crosstabs to Excel by clicking Export.
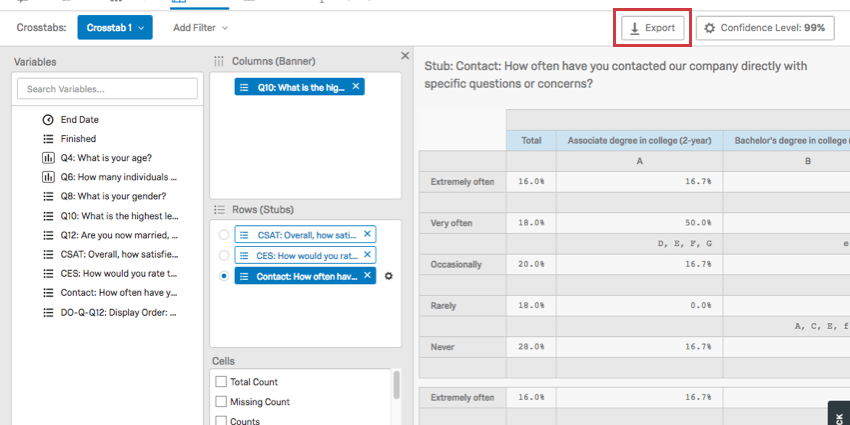
You will then be on a window with the following options:
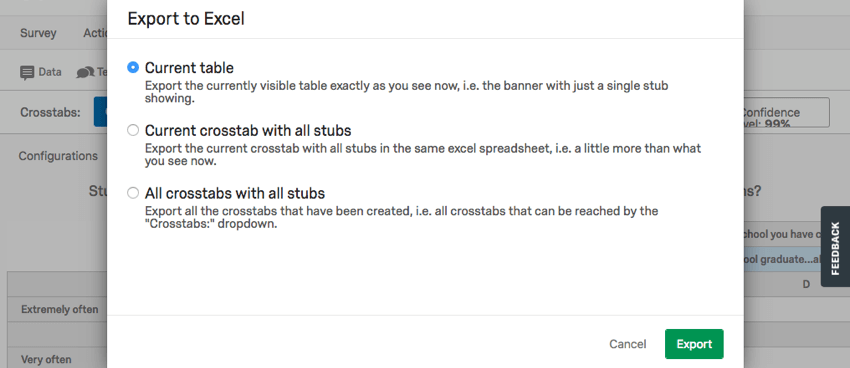
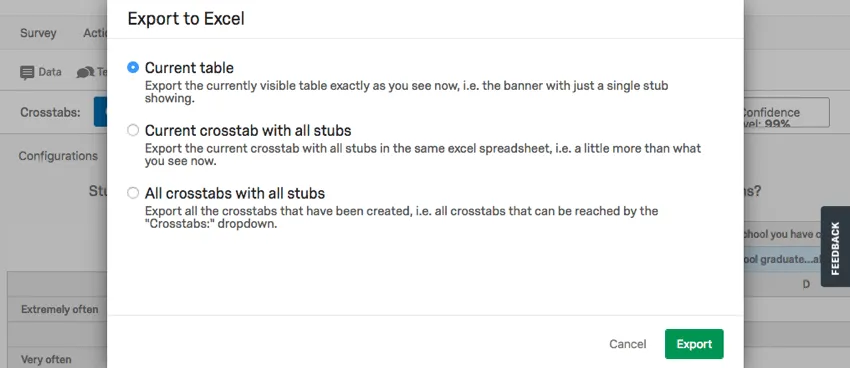
- Current table: Since you can only select 1 Row at a time to display on your crosstab, this option will just export your selected Row.
- Current crosstab with all stubs: This exports all tables from your current crosstab, including every Row you’ve added. Qtip: The options Current table and Current crosstab with all stubs are the same if you have only 1 field added as a Row.

- All crosstabs with all stubs: Regardless of the crosstab you are viewing, this option will export all the crosstabs you have created and include all their rows. This option only exports crosstabs for the survey, not across all surveys in the account.
All files are in xlsx format.
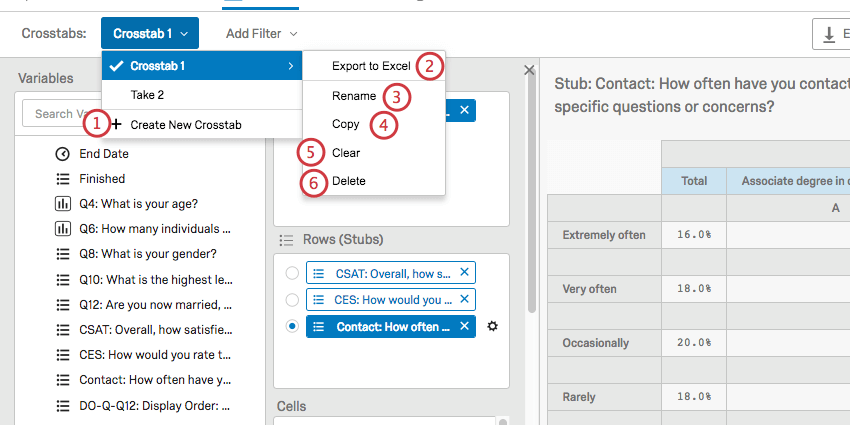
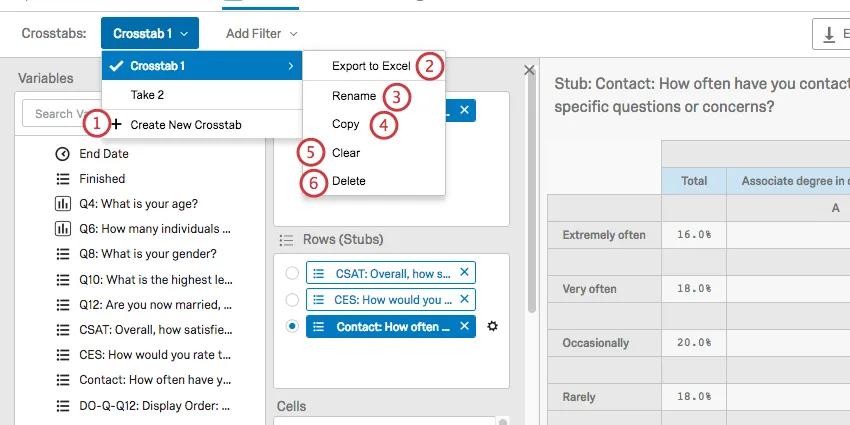
Qtip: You can find these same options by clicking the Crosstabs dropdown, highlighting your selected crosstab, and selecting Export to Excel.
Renaming, Copying, and Deleting Crosstabs
Use the Crosstabs dropdown in the upper-left to manage the crosstabs you’ve created.
That's great! Thank you for your feedback!
Thank you for your feedback!