-

Qualtrics Platform -

Customer Journey Optimizer -

XM Discover -

Qualtrics Social Connect
Advanced-Reports Toolbar
About the Advanced-Reports Toolbar
Once you create your first advanced-report, you will be provided with a toolbar to help you build and personalize your reports. This page will cover the function of each toolbar button.
File Menu
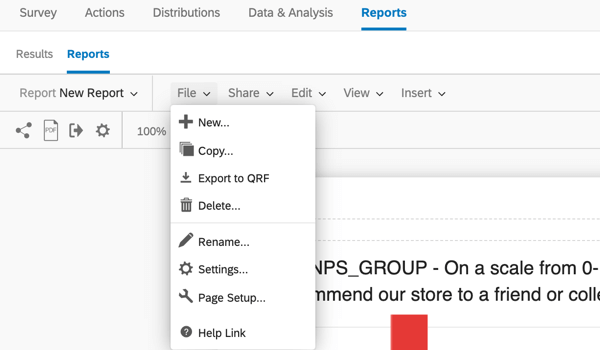
- New: Create a new report. See the Creating Reports section for more details.
- Copy: Create a copy of your report. This option is great if you want to create a report with similar settings and visualizations to your first one.
- Export to QRF: Export a QRF copy of your report. This saves all visualizations, settings, and customization. QRFs are files that can only be read by Qualtrics for the purpose of creating reports. For information on using the QRF, see Creating an Advanced-Report from QRF.
- Delete: Delete your report.
- Rename: Rename your report.
- Settings: Adjust visual settings and more for your report, such as fonts, page orientation, and color palettes. See the Global Settings page for more details.
- Page Setup: This option will take you to the global page settings. This is where you can adjust page size, orientation, and margins.
- Help Link: Takes you to the Support Site.
Share Menu
The Share menu allows you to export a PDF of your report or create a public link people can use to view your report. See the Sharing Your Advanced-Reports page for more details.
Edit Menu
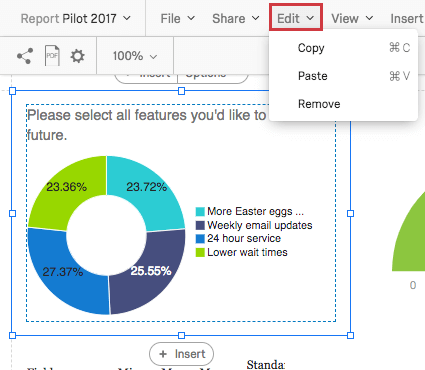
When you click a visualization and then click Edit, you have the option to Copy the visualization, Paste one below it, or Remove the visualization. See the page on Adding and Removing Visualizations for additional assistance.
View Menu
The View button has settings that make it easier for you to edit your report. None of these settings are visible in public reports or in the PDF export.
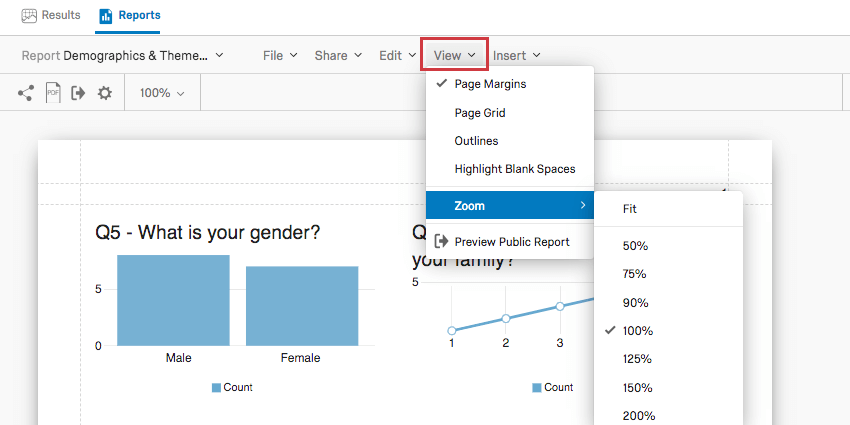
- Page Margins: When selected, you can see a dotted outline around your page margins. When deselected, you cannot see this outline.
Qtip: This does not change the margin size, just the outline around it. To adjust the size of your margins, check out the global page settings.
- Page Grid: When selected, a grid will appear on each page to help you adjust the size and position of your visualizations.
- Outlines: When selected, borders will appear around your visualizations.
- Highlight Blank Spaces: Highlights blank spaces between widgets.
- Zoom: Zoom into and out of the report. The option Fit will fit the report to the page.
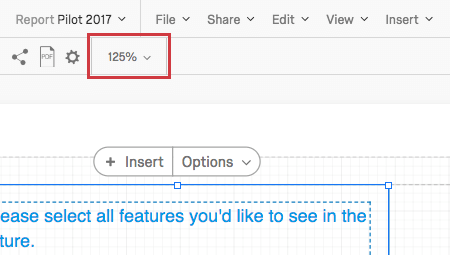
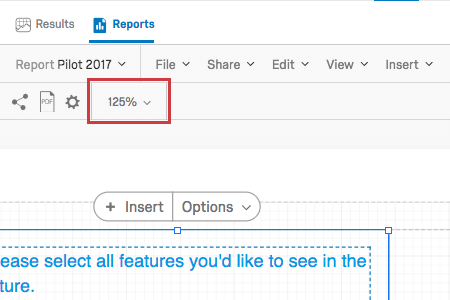
Qtip: You can also adjust the zoom using the zoom dropdown, shown below.
- Preview Public Report: Preview your public report.
Insert Menu
The Insert button on the toolbar allows you to add content to your reports, including visualizations, page breaks, headers and footers. See our Inserting Report Content page for more information.
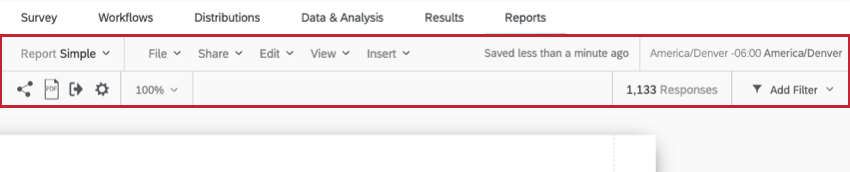
Time Zone
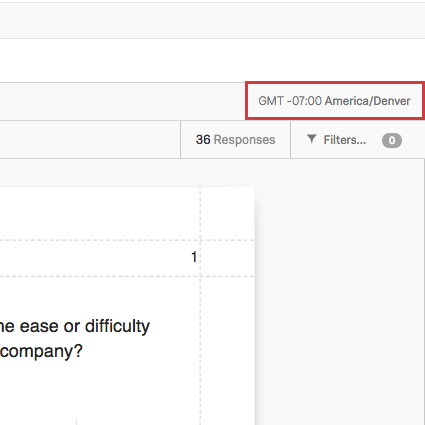
The toolbar displays the report’s time zone. You can change this by adjusting the Locale Global Settings. By default, the report’s time zone will revert to whatever is in your account settings.
Response Count
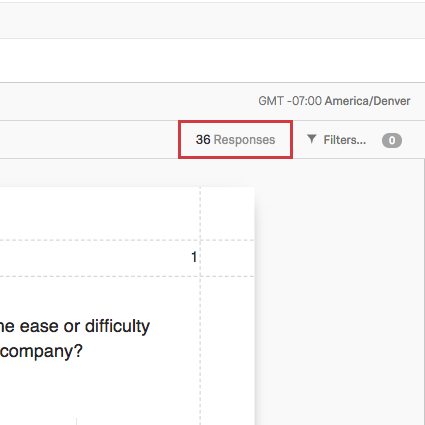
The toolbar also displays the survey’s response count. The response count is equal to the number of recorded responses and does not include responses still in progress. This number will adjust if you add a global filter to your report.
Global Filters
You can filter your entire report using the Filters button on the toolbar. See the Global Filters page for more information.
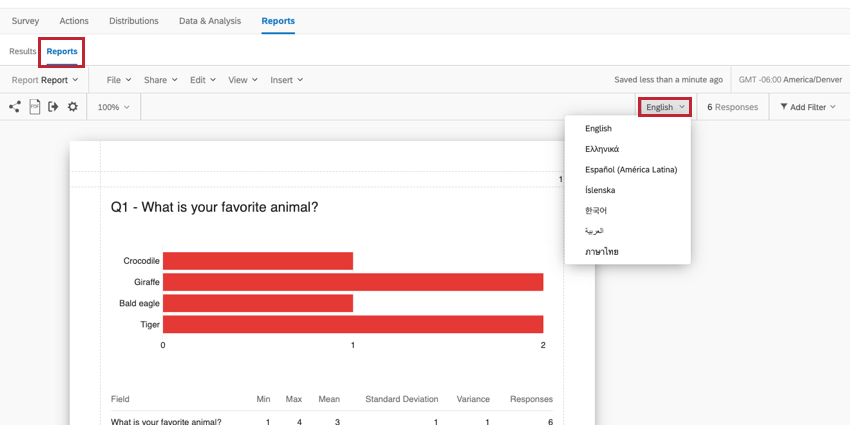
Translating Advanced-Reports
The advanced report can display text from the survey in every language that the survey has been translated to. This includes question text, answer choices, and all other survey content that is translatable. All available survey languages are shown in the drop-down in the report toolbar. For more details about translation, see our page about Translating a Survey.