
Data Mapper (CX)
What's on this page
About the Data Mapper (CX)
The easiest way to format your dashboard data is using the data mapper. This page covers how to create a dashboard data source using the data mapper, how you can format and edit your fields, and how to get your data ready so you can start building dashboards.
Qtip: This page covers how to map fields in CX Dashboards. While extremely similar, there are other factors to take into account if you are configuring fields an Employee Experience (EX) dashboard. If you are working with an Engagement, Lifecycle, or Ad Hoc Employee Research project, see Dashboard Data (EX) instead.
Qtip: Confused about what datasets are vs. data sources? Not sure how to tell the data mapper and modeler apart? Learn more about these and more key terms.
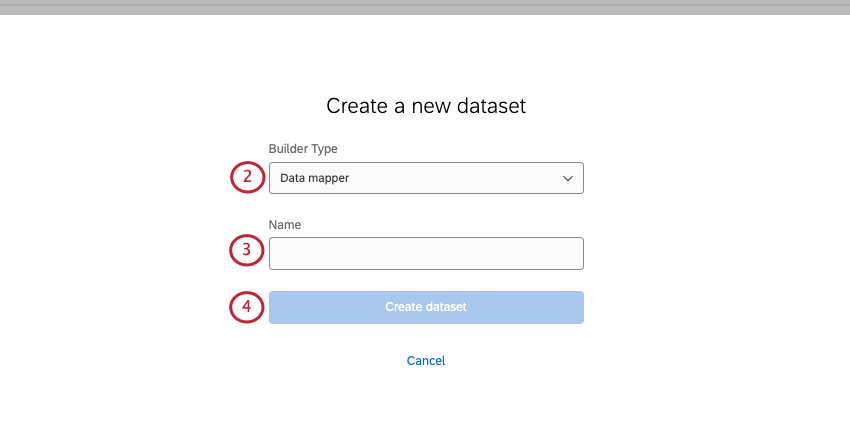
Creating a New Data Mapper Dataset
Qtip: When mapping dashboard data, make sure to only include data that is essential for end-user success. If you are restricting access to many fields, we recommend creating a separate dashboard(s) for just the users who should have access.
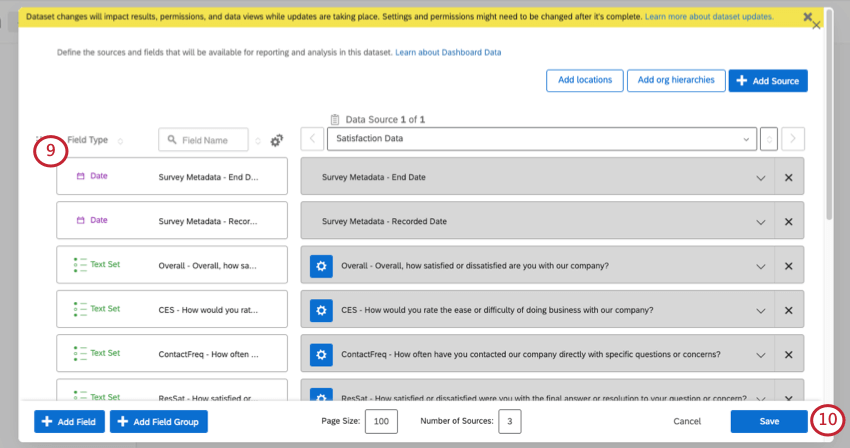
You can create a dataset from any surveys or distributions you have in your account, or any external data sources, including contact data or digital program data.
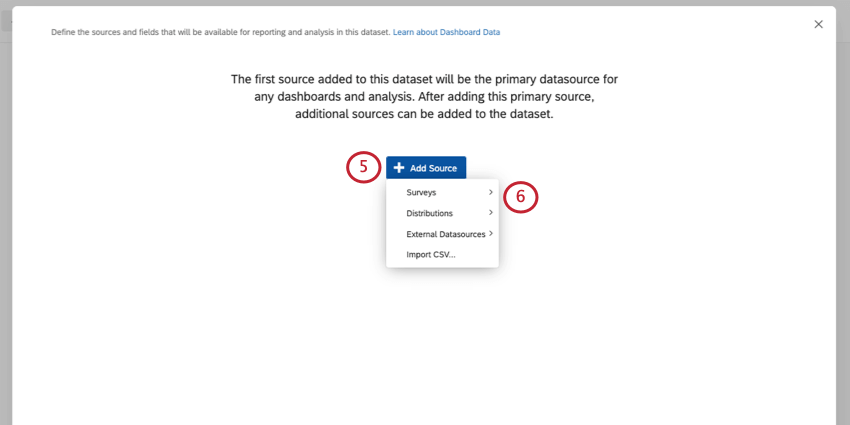
Qtip: To add contact data to your dashboard, click External Datasources and select your contact dataset. See Using Contact Data as a CX Dashboard Source for more information.
Qtip: To add digital program data to your dashboard, click External Datasources and select your Website / App Insights dataset. See Using Digital Program Data as a CX Dashboard Source for more information.
Qtip: To use imported data in your dashboard, see the Importing Data as a CX Dashboard Source support page.
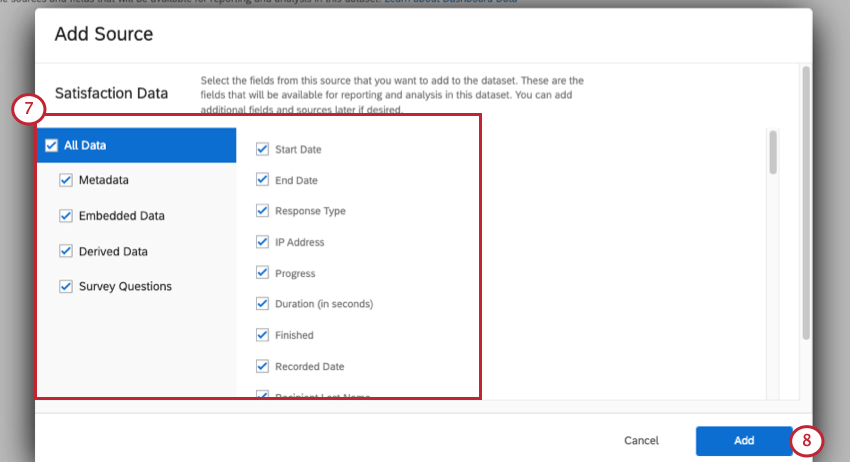
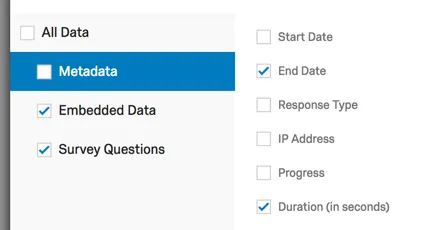
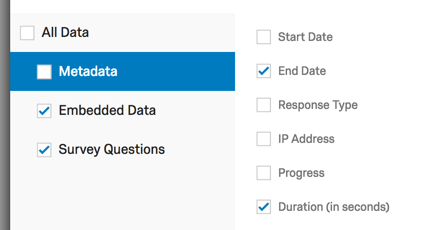
Example: You can use the checkbox to deselect all Metadata – this will remove fields like Response Type and Finished. If you see yourself using some, but not all metadata, you can deselect Metadata and then individually select the fields you want.
Attention: Learn more about differences for derived data below.
Qtip: Any fields you exclude by accident, you can add back in later.
Once your dataset has been created, it can be reused in other dashboards. Learn more about creating datasets and managing datasets.
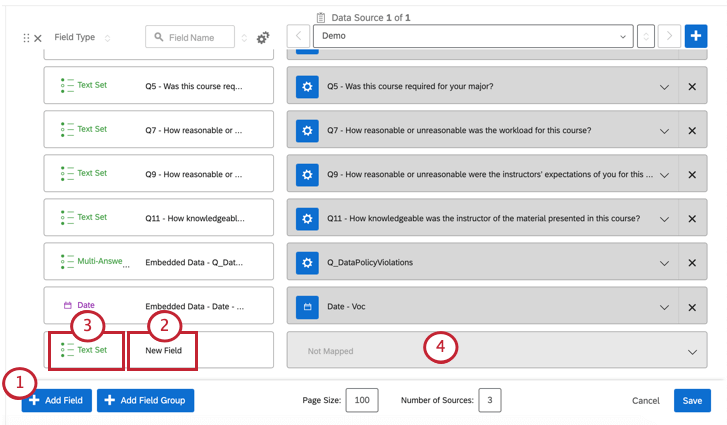
Adding New Fields
Attention: When add a survey question to your dashboard, you will pull in its current setup from the survey, such as recodes, labels, list of choices, multi vs. single answer format, and more. If you later make changes to the question in the survey, those changes won’t be carried over to the dashboard. If you’ve made a lot of edits, the easiest solution is to unmap the field, then map it again.
Example: For example, if you add a new answer choice to a question in the survey after it’s already mapped in the dashboard, this new answer choice will appear as an internal choice ID instead of text, and you’ll have to add that label to your dashboard field (or map and remap the field).
Attention: Learn more about differences for derived data below.
Qtip: Updating the field name will not affect your survey and will only be visible within CX Dashboards.
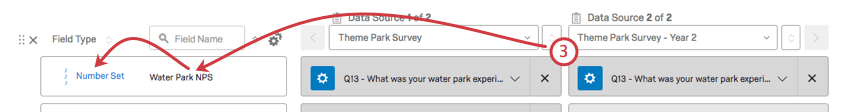
Qtip: Field types define the type of data mapped into the field and consequently determine which widgets will be available for each field. If you don’t see your desired field name when selecting the source of a widget, you may need to change the field type or use a different widget. Be aware that changing Field Types can break widgets on any Dashboard using the affected fields. As such, we often recommend adding a new field that maps to the same question rather than editing the field type or field mapping of existing fields (e.g., you may have a Text Set field for a NPS group as well as a separate Number Set field for a NPS value).
Qtip: Hover over a field to see the move icon. You can use this to drag and drop the field around your mapper.
Mapping and Unmapping Fields
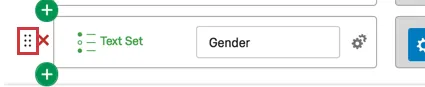
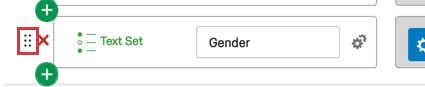
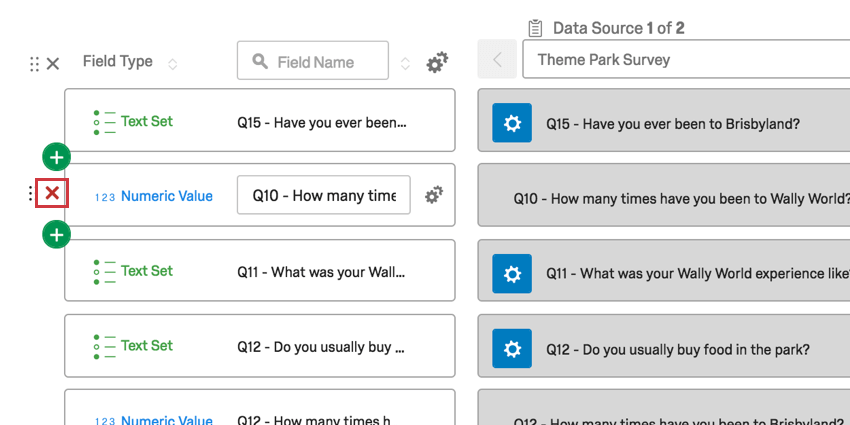
Unmapping a field is as simple as clicking the X to the right side of the field. Subsequently, the field will be grayed out.

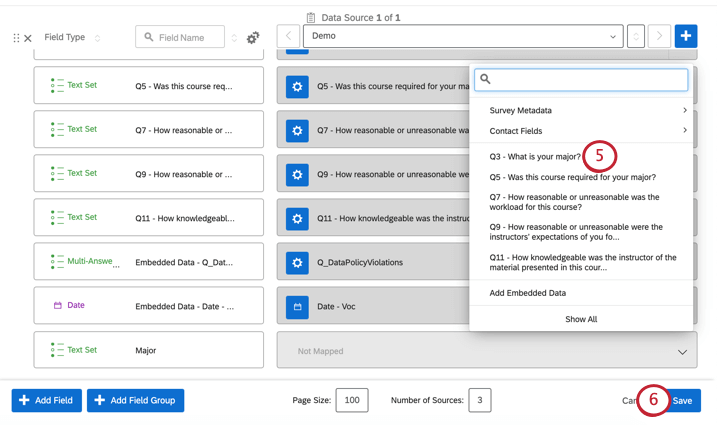
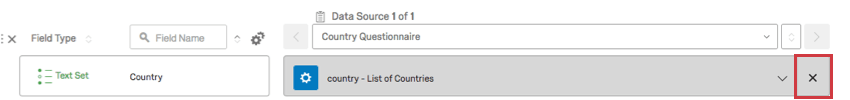
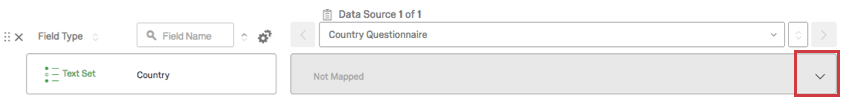
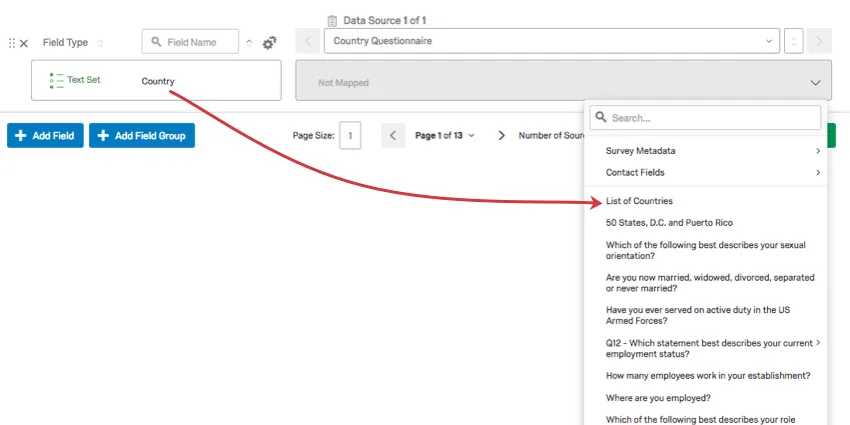
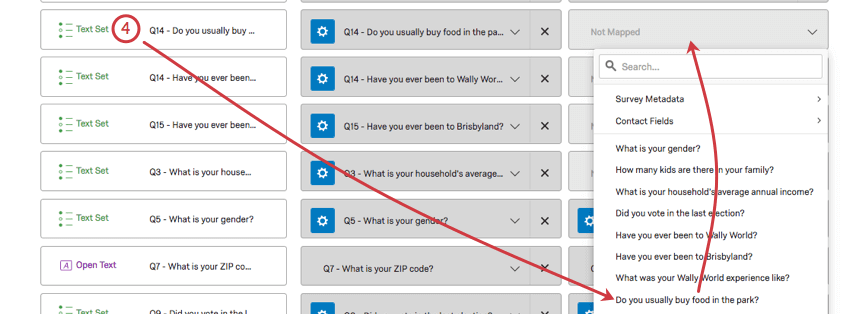
To map a field, click the down arrow to the right of any Not Mapped item. This will open a list of choices that will allow you to map to the appropriate field type.

The field type and the question type must be compatible. In this case, the Country field should be mapped to the survey question pertaining to countries.
Qtip: See the Field Type Compatibility page for which field types you should choose for each type of question.
Managing Multiple Sources
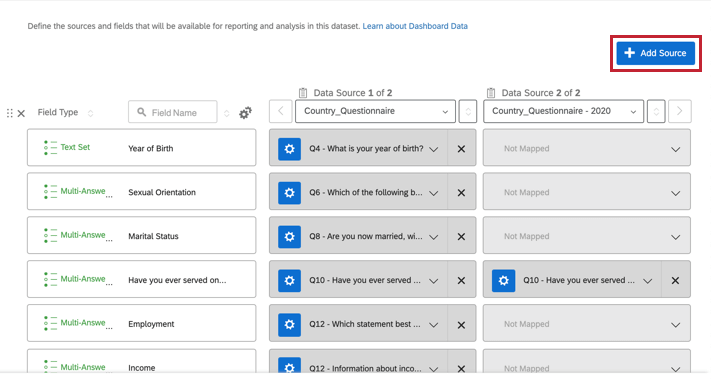
After adding in your first data source, you can click on the Add Source button and select a different survey to add additional sources.
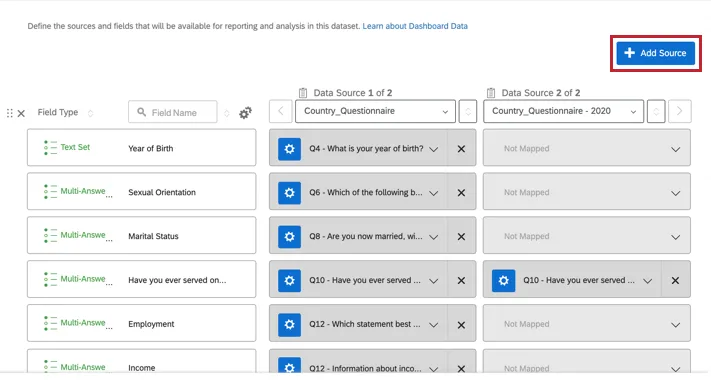
Additional data sources will not be automatically mapped, so you will need to map their fields manually. While you can map as many data sources as you want into your Dashboard Data, you cannot map the same survey or data source twice (they will be grayed-out in the “Add Source” menu if already added). After adding in an additional data source, you can either merge data from both sources into the same field or keep the data separate.
Qtip: To ensure best functionality, do not add more than 60 sources. Dashboards with too many sources may be unable to be copied.
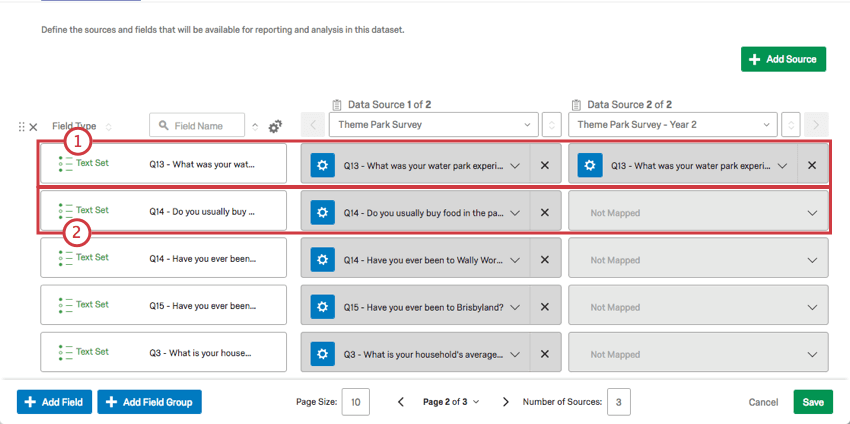
Merging vs. Separating Multiple Fields
You can merge data from multiple sources into the same field or keep the data separate. For example, you may want data from CSAT questions in 2 different yearly surveys to show up in the same widget, but want to separate your 2016 CSAT from your 2017 NPS score.
Warning: A Number Set is best for scale-point questions such as NPS (0-10) or Likert scales (1-5). However, you shouldn’t merge a 7-point satisfaction scale question with an 11-point NPS question.
Qtip: The data mapper does its best to guess the most compatible fields, but these selections may not be perfect. If you feel the wrong options are being offered here, click Show All to see more.
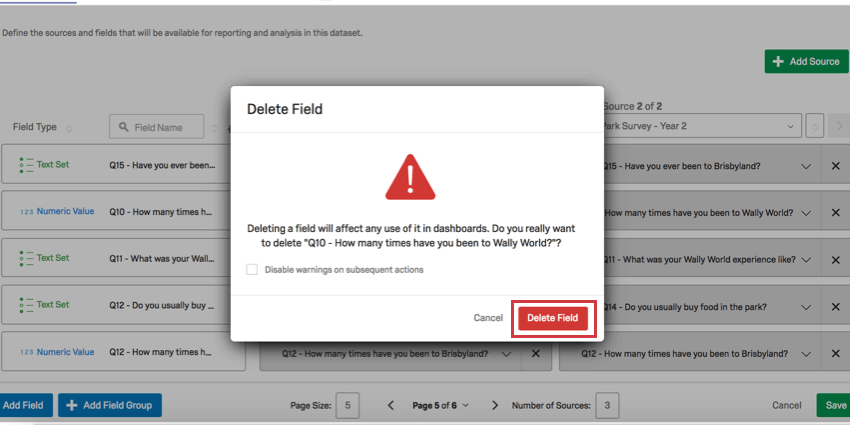
Deleting Fields
Once you delete a field, the action cannot be undone. Additionally, deleting fields can break widgets that are using the field you wish to delete. Please use caution when deleting any fields.
Derived Data
Derived Data are any custom fields or scoring categories you’ve created in your source project.
Attention: When you map in a derived data field, its configuration is locked to how it was set up in the dashboard source the first time it was mapped. Note that unlike regular dashboard fields, derived data cannot be updated by only unmapping and remapping the field. Instead, to update a derived data field, you can add a new copy of the field with a different name. You’ll then need to edit any relevant widgets to use the new field instead.
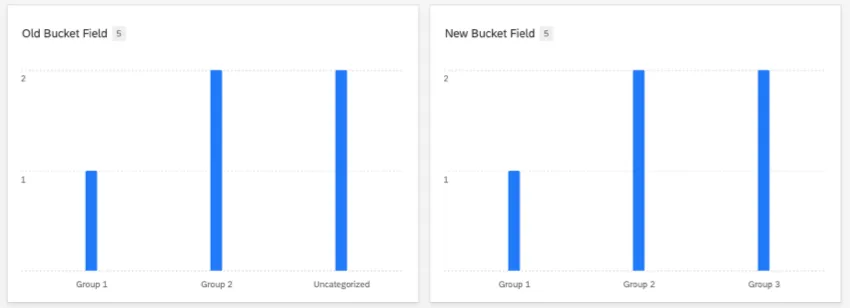
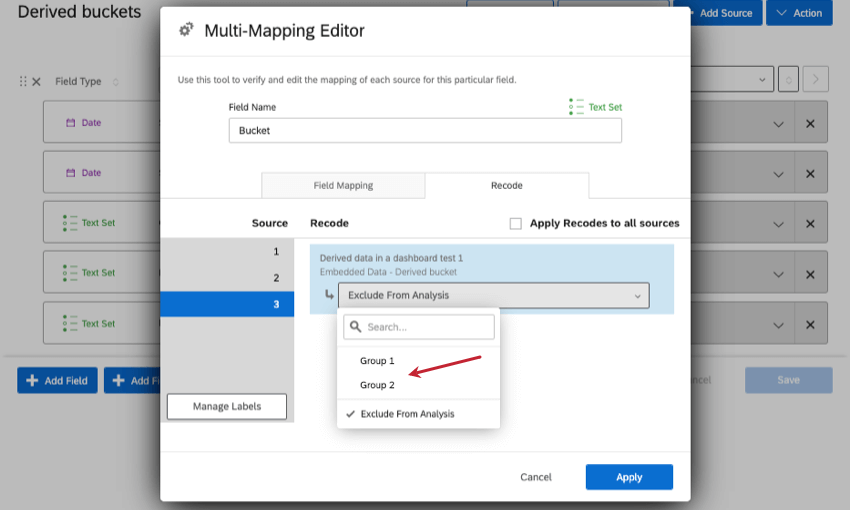
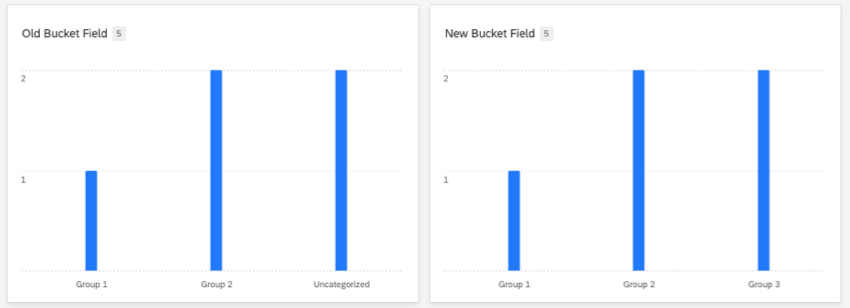
Example: You had a survey with a bucketed field. You made your dashboard, then updated the bucketed field in your survey by adding a third choice group. However, your dashboard field only shows the first 2 groups, and doesn’t give you the option of adding the new bucket in the recode editor.

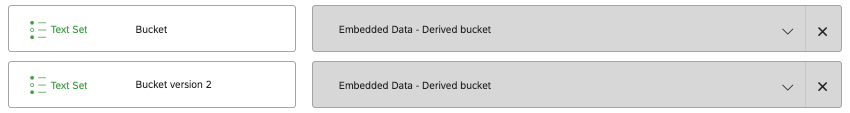
To solve this, you add the same bucket field again, but add “version 2” to the name.
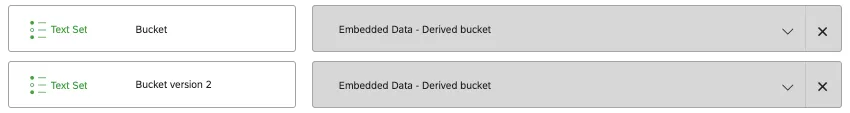
The version 2 field shows all of your new data when you add it to a widget.
Qtip: You can also unmap and remap your entire dataset to fix a derived field, but that will also require you to reconfigure your entire dashboard.
Qtip: You can only map concat/coalesce derived data fields as open text or text value field types.
Static Text
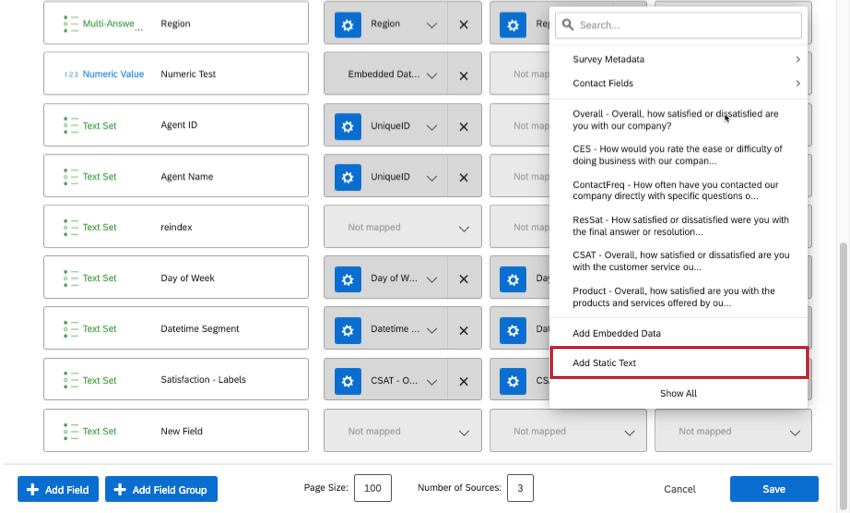
When you’re mapping a new field to your dashboard, instead of choosing a specific question or metadata to map it back to, you can select Add Static Text. Static text can be helpful if every respondent has the exact same value for the same field. Data sources, however, can have different static values for the same field.

Example: Datasets come with a “data source” field by default, but this cannot be relabeled or changed in field type, giving it limited reporting options. Instead, you create a field called “Named Data Source,” and set the static text for each survey according to a name you’d like to show shareholders. Then you can make this field a multi-answer text set and show the performance of each survey in a bar chart. You can also analyze the field in Stats iQ, which the default data source field cannot do.
Example: One of the ways you can map journey data is using static text. Without having to set up any embedded data, you can quickly indicate which survey is which step on a journey. For example, you can name your field Journey, and make the value Onboarding for your employee onboarding survey, and Exit for your employee exit survey. See Mapping Historical Journeys for an example.
Static text can only be used with multi-answer text set and text set field types. Static text is compatible with fields in groups, so long as they’re the right field type.
You can make a field where some data sources’ values are static text, while other data sources’ values are mapped to specific fields.
Static text is available in CX Dashboards and BX Dashboards, but it is not available in any kind of Employee Experience dashboard.
Editing Existing Data Mappers
Once your data mapper’s been created and added to your dashboard, you can go back and edit it as needed. To do this:
Qtip: You can also edit your data mapper from the global Data page, which houses all of your account’s datasets.
More Ways to Use the Data Mapper
Here are some more actions you can take in the data mapper.
- Recoding Dashboard Fields (CX)
- Assigning Field Types
- Date Field Format (CX)
- Field Groups (CX)
- Date Time Segmentation (CX)
Supported Survey Features
Data collected with the following survey project features can be mapped to CX Dashboards:
- Multiple Choice
- Text Entry
- Net Promoter Score (NPS)
- Matrix Table
- Side by Side
- Rank Order
- Pick, Group, and Rank
- Slider
- Drill Down
- Constant Sum
- Loop & Merge
- Carry Forward
- Exclude From Analysis
- Embedded Data
- Custom Fields
Unsupported Survey Platform Questions & Features
Data collected with the following survey project features cannot be mapped to CX Dashboards:
- Matrix Rank Order
- Matrix Constant Sum with Total Box
- Hot Spot
- Heat Map
- Timing
- Graphic Slider
- File Upload
- Highlight
- Signature
Qtip: Scoring values are not directly compatible with CX Dashboards. However, you can save the scoring value as an embedded data field in the survey flow so that the field could be mapped into the dashboard via embedded data instead.
FAQs
What are text topics and how can I use them in CX Dashboards?
What are text topics and how can I use them in CX Dashboards?
You should use text topics when you need to assign topics based on open-ended text responses from your participants.
Text topics will map automatically to your dashboard as your perform text analysis in the dashboard. See Text iQ in CX Dashboards for more details.
I created a new field in Data & Analysis, but these values aren‘t showing up in CX Dashboards. Where do I find them?
I created a new field in Data & Analysis, but these values aren‘t showing up in CX Dashboards. Where do I find them?
Manual custom fields, Bucketing variables, and Formula variables created in Data & Analysis can all be pulled into CX Dashboards.
Your fields will appear in different places in your Dashboard Data:
Finally, make sure you added the field to your dashboard data.
How many columns / unique fields can my dataset have?
How many columns / unique fields can my dataset have?
Is there a limit to the number of data sources you can add in each dataset?
Is there a limit to the number of data sources you can add in each dataset?
How many dashboard datasets can I create?
How many dashboard datasets can I create?
How many times can I use the same data source in a dashboard dataset?
How many times can I use the same data source in a dashboard dataset?
How do I add imported video and audio data to my dashboard?
How do I add imported video and audio data to my dashboard?
On the other hand, survey projects with video questions can be mapped to both data models and data mappers.
What’s the difference between data sources and datasets?
What’s the difference between data sources and datasets?
Learn more about these key terms.
That's great! Thank you for your feedback!
Thank you for your feedback!