
Getting Started with CX Dashboards
What's on this page
Qtip: CX Dashboards are included with CX licenses. If you don’t have a CX license and are interested, you can request a demo with an Account Executive.
What’s a CX Dashboard?
CX stands for Customer Experience, which is an area of market research devoted to the overall experience a customer has with a company. CX is about more than just customer satisfaction, and seeks also to understand the customer journey, the ease with which customers interact with your company, whether they’d recommend your company to other people, and so on.
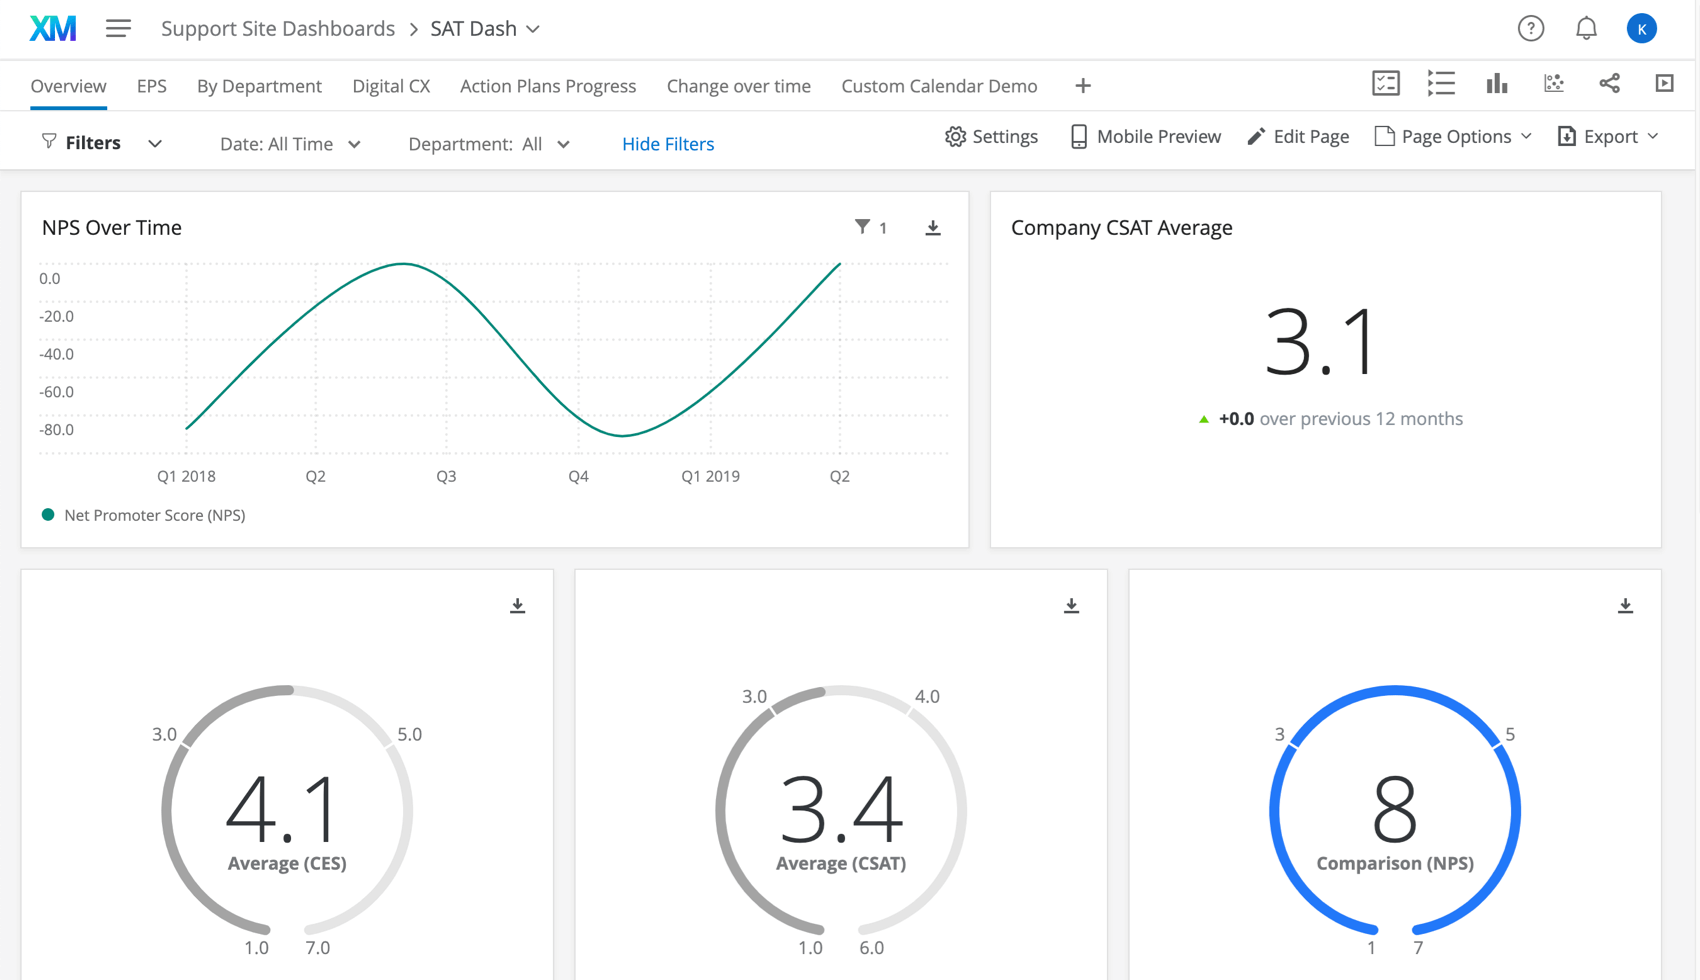
CX Dashboards allow you to report on your CX research with eye-catching visualizations. Highlight key findings, action insights, invite colleagues to collaborate, and report out to stakeholders.

We will continue to use the Customer Experience example on the following pages, as we explain how to make your first dashboard project. You don’t have to follow this example exactly – in fact, CX Dashboards are just as good at reporting on any scholarly or marketing research you may conduct – but we hope these pages will provide a helpful framework to get started.
How Do I Make a Dashboard Project?
On the following Getting Started pages, you’ll learn the necessary steps required to create a dashboard.
Key Terms
Here’s a list of key terms that will pop up as you proceed through our Getting Started pages. Terms may have links to “deeper dives,” support pages that don’t just cover getting started, but more detailed instructions and troubleshooting.
Qtip: These terms are listed in alphabetical order – this doesn’t necessarily reflect the order you’ll encounter them in the platform.
Customer Experience (CX): A field of research devoted to investigating the full experience a customer has with a company. This can include (but is not limited to) satisfaction, digital experience, NPS® data, customer churn and retention, customer journeys, and more.
Dashboard: A dynamic reporting project that allows you to create detailed data visualizations and configure the level of access for all colleagues and teams involved.
Dashboard user: Any person you share the dashboard with. This person could have editing power over the dashboard, or merely a view-only access.
Qtip: Are you in charge of making dashboards, and want to provide an easy guide for the view-only users you’re sharing the project with? See CX Dashboard Viewer.
Dataset: A collection of data sources that are available for you to report on in your dashboard. You can find all of the datasets you have access to on the Data page.
Data source: Where the data in your dataset comes from. This can be surveys, data you imported to Qualtrics, tickets, directories, or other external sources.
Field: Each individual question, survey metadata, embedded data, or data column you plan to report on in the dashboard is its own individual field. “Values” refers to the data in the field. E.g., “age” can be a field, and the individual ages are the values of that field.
Field type: The format of your field’s data, which determines how the data is reported in a widget, and which widgets it is available to. For example, a feedback response is open text, allowing people to enter whatever text they want describing their opinion of your company. This kind of data can be listed by response, or broken out into a word cloud, but probably wouldn’t make sense in a bar chart or line graph. See Field Types & Widget Compatibility.
Filter: A means of filtering your data by other data you’ve collected. For example, you can filter data collected after a certain date, or only view data for a certain department. See Filtering CX Dashboards.
Map: To map a field is to designate what survey question (or other data source) corresponds to what dashboard field.
Page: Dashboards are broken into separate pages. This is where widgets and filters are added.
Project administrator: A user with editing access to a whole dashboard project, not just an individual dashboard within the project. This person can create, copy, move, and delete dashboards. They can also add other administrators to the project. See Adding Project Administrators to a CX Dashboard.
Recode: To change the values in a dashboard field. For example, changing a “Very Satisfied” to “Very Unsatisfied” scale to be 1-5 numerical values instead. See Recoding CX Dashboard Fields.
Role: How you determine which users have access to which dashboards. See CX Dashboards Roles.
Tickets: A means of tracking tasks in the Qualtrics XM platform. They are optional, but including them in your Qualtrics CX Program can help you action insights you gather from customer feedback. See Tickets Task for setup and Ticket Reporting for how to incorporate them into a dashboard.
Unmap: To remove a mapping. For example, if you added the wrong survey question to a dashboard field, or wish to remove the field altogether, you can unmap it.
Widget: The charts, tables, and images used to visualize data in a dashboard.
Data mapper: The easiest and most common way to format your dashboard dataset. See Data Mapper (CX) for more information.
Data modeler: A way to create dashboard datasets by combining data from different types of sources (i.e., tickets and surveys together) and perform joins. See Creating a Data Model (CX) for more information.
Join: Combine rows from 2 or more tables based on a related column between them, such as an ID. See Joins for more information.
Union: Combine multiple data sources together into a single dataset. Rather than combining individual rows of data, as you do in a join, you simply add more rows to the same dataset. See Unions for more information.
FAQs
How can I stay up to date on new Qualtrics features?
How can I stay up to date on new Qualtrics features?
To access these release notes, you need an XM Community account. These accounts are free for any users with a Qualtrics account. This support page contains information for how to register an XM Community account.
Once you're logged into the XM Community, head over to the Weekly Product Updates Introduction Post. This post contains all the information you need to get started with subscribing to product updates!
What are CX Dashboards?
What are CX Dashboards?
Can Dashboards projects only be used for customer experience research?
Can Dashboards projects only be used for customer experience research?
That's great! Thank you for your feedback!
Thank you for your feedback!