
Filtering CX Dashboards
What's on this page
Qtip: This page refers to filtering in CX Dashboard projects only.
About Filtering CX Dashboards
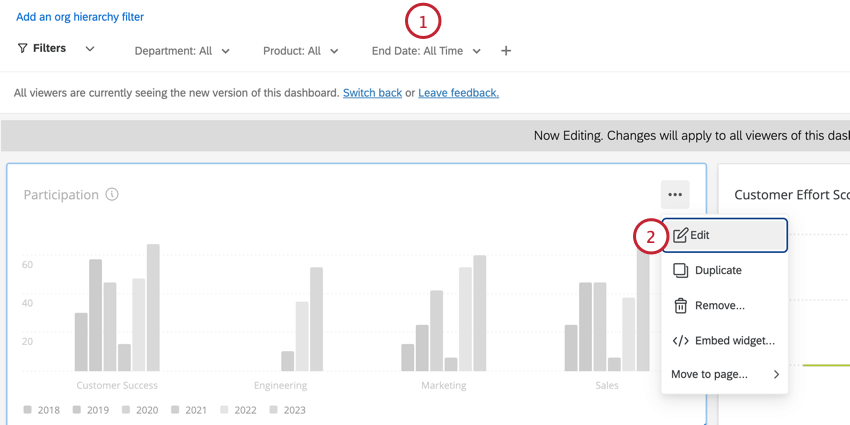
In CX Dashboards, you can filter your dashboards by applying a filter to every widget on a page or by applying filters to individual widgets. This allows you to dive into the data and find trends that you would not be able to see with the data in aggregate alone. Different data types will result in different kinds of filters (e.g., Text Sets will give you a dropdown list of options while Dates will give you a calendar from which to select a date range).
Warning: When filtering on a Number Set or Text Set field, the filter will display a maximum of 5,000 values.
Qtip: You cannot apply a filter to the entire dashboard. You can only add filters to individual dashboard pages and to individual widgets.
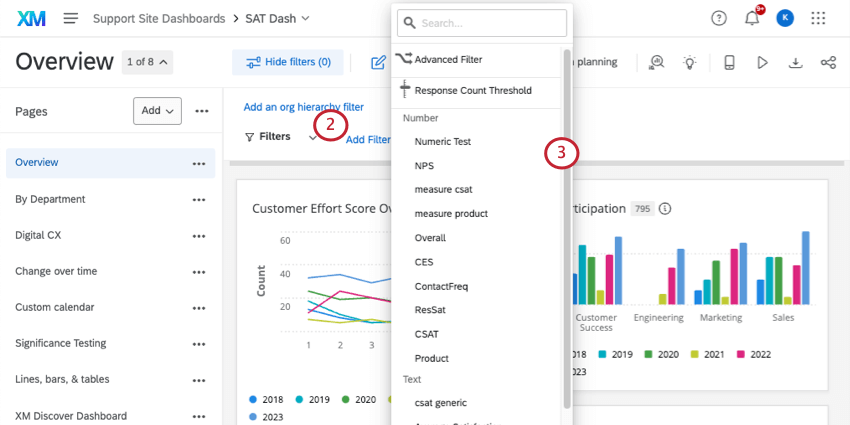
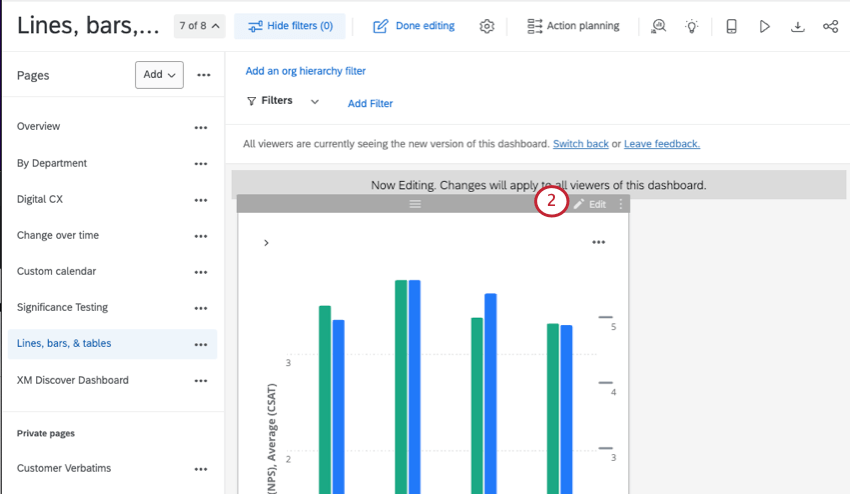
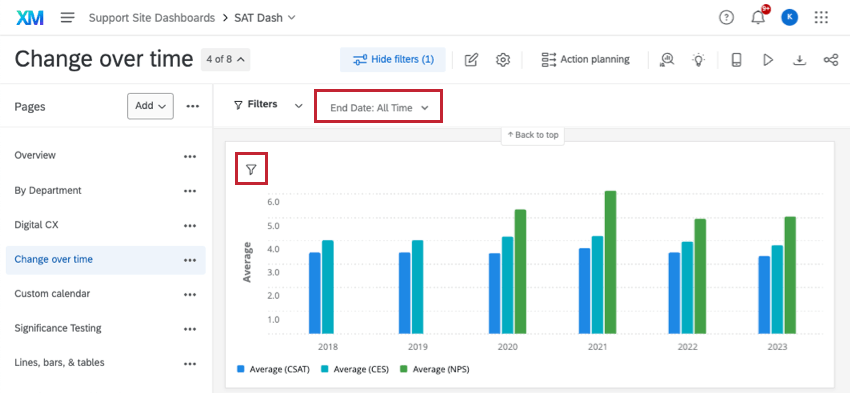
Adding Page Filters
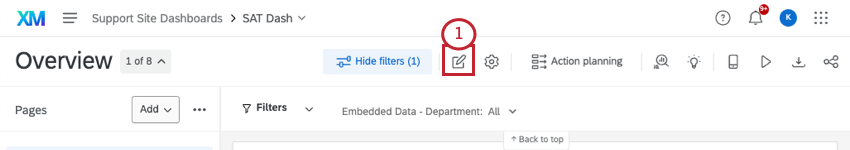
Qtip: Page filters apply to every widget on the page, not the entire dashboard.
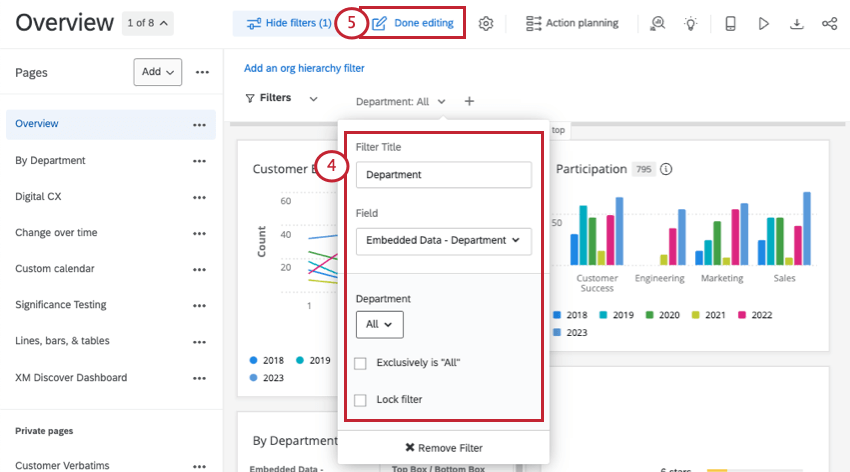
Qtip: Adding page filters while editing the dashboard makes the filter available to dashboard users. You’ll still have to define your filter conditions after adding the filter in order to have it apply to your data.
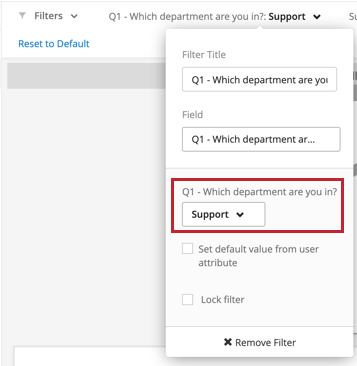
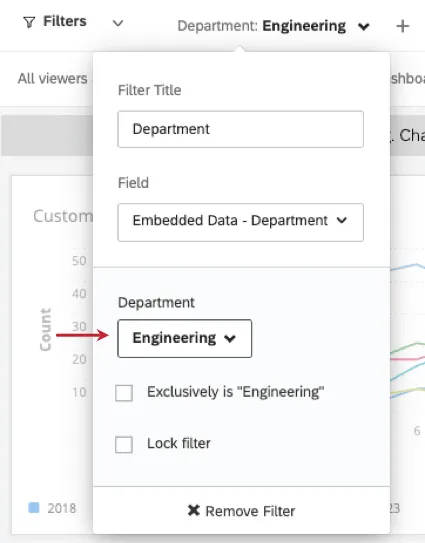
Attention: If you select specific values while editing your filter and then exit out of editing mode, the filter will be applied automatically for your dashboard viewers. In the below example, the value Support was selected for the filter, “Which department are you in?” When dashboard viewers go to this dashboard, the filter “Which department are you in?” will automatically be set to filter for Support.
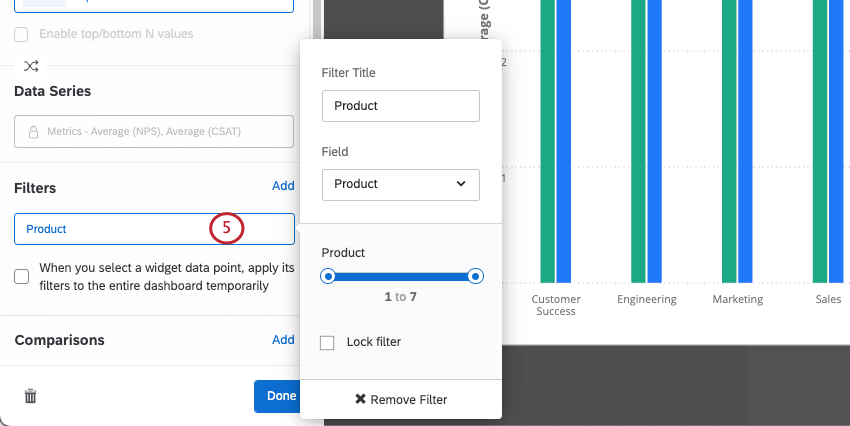
Adding Widget Filters
Qtip: Advanced filters always apply and are not overridden by widget-level filters. See Filter Interactions for more information on how filters interact.
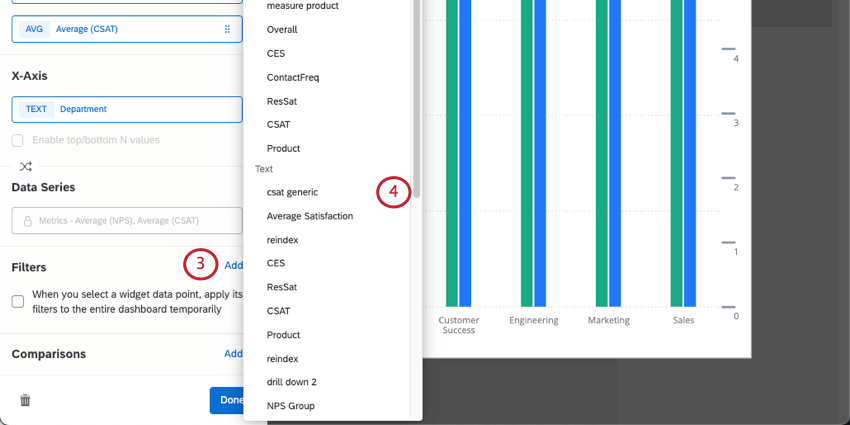
Qtip: Filters set on individual widgets will not apply to anything else on the page.
Qtip: Different data types will result in different kinds of filters (e.g. Text Sets will give you a dropdown list of options while Dates will give you a calendar from which to select a date range).
Qtip: Adding page filters while editing the dashboard only makes the filter available to dashboard users. You’ll still have to define your filter conditions after adding the filter in order to apply it to your data.
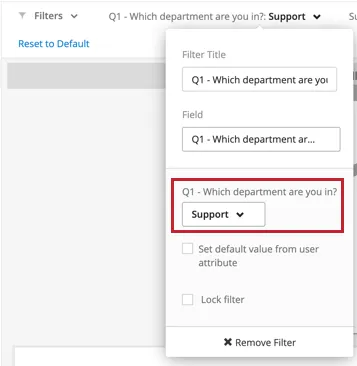
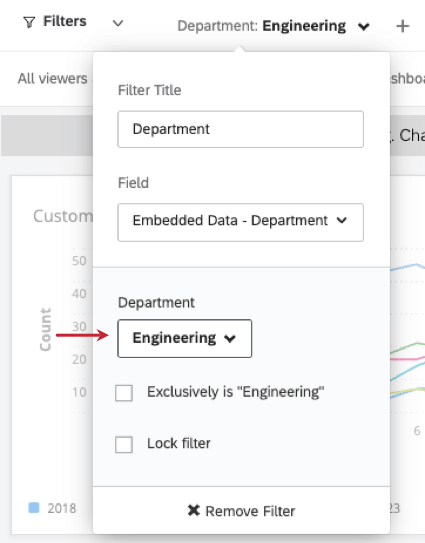
Attention: If you select specific values while editing your filter and then exit out of editing mode, the filter will be applied automatically for your dashboard viewers. In the below example, the value Engineering was selected for the filter, “Which department are you in?” When dashboard viewers go to this dashboard, the filter “Which department are you in?” will automatically be set to filter for Engineering.
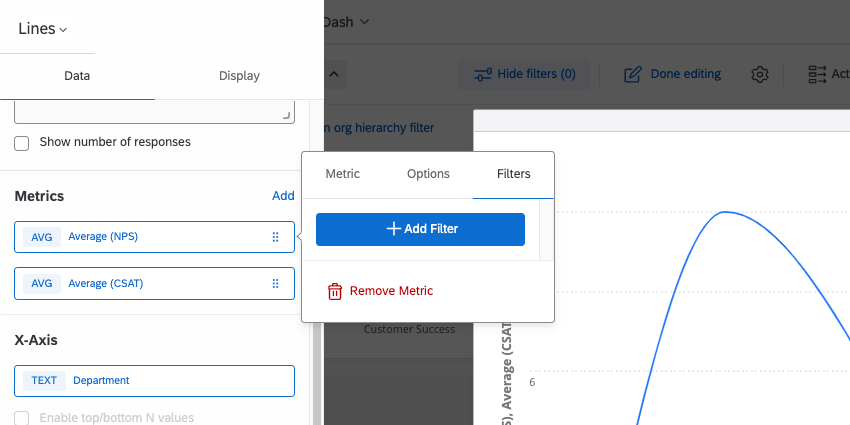
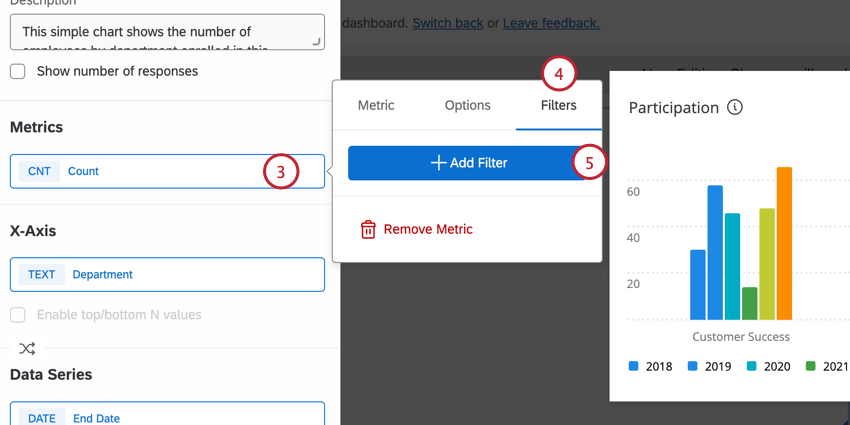
Adding Filters to Metrics

In addition to filtering dashboards and widgets, you can add a filter on your widget’s metric. Filters on the metric will restrict the data that is displayed in the widget. For more information about adding metric filters to widget, see our page on Widget Metrics.
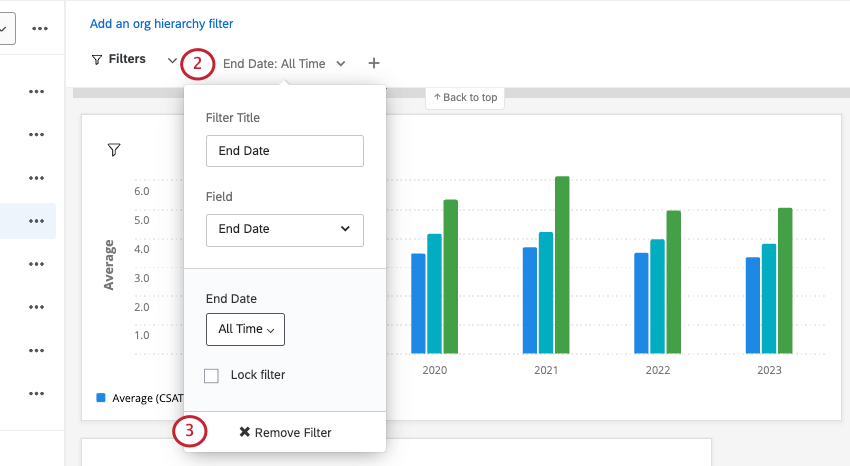
Locking Filters
Warning: Locked filters are not a replacement for applying data restrictions to dashboard viewers. If you need to limit what data your dashboard viewers have access to, we highly advise you set up data restrictions.
Sometimes, you don’t want your dashboard viewers to be able to change certain filters. For example, let’s say you have a dashboard page analyzing data for a specific store location. You can add a page filter for store location, select the specific store location as the filter value, and then lock the filter.
When editing your filter, enable Lock Filter to lock it. Both page filters and widget filters can be locked.
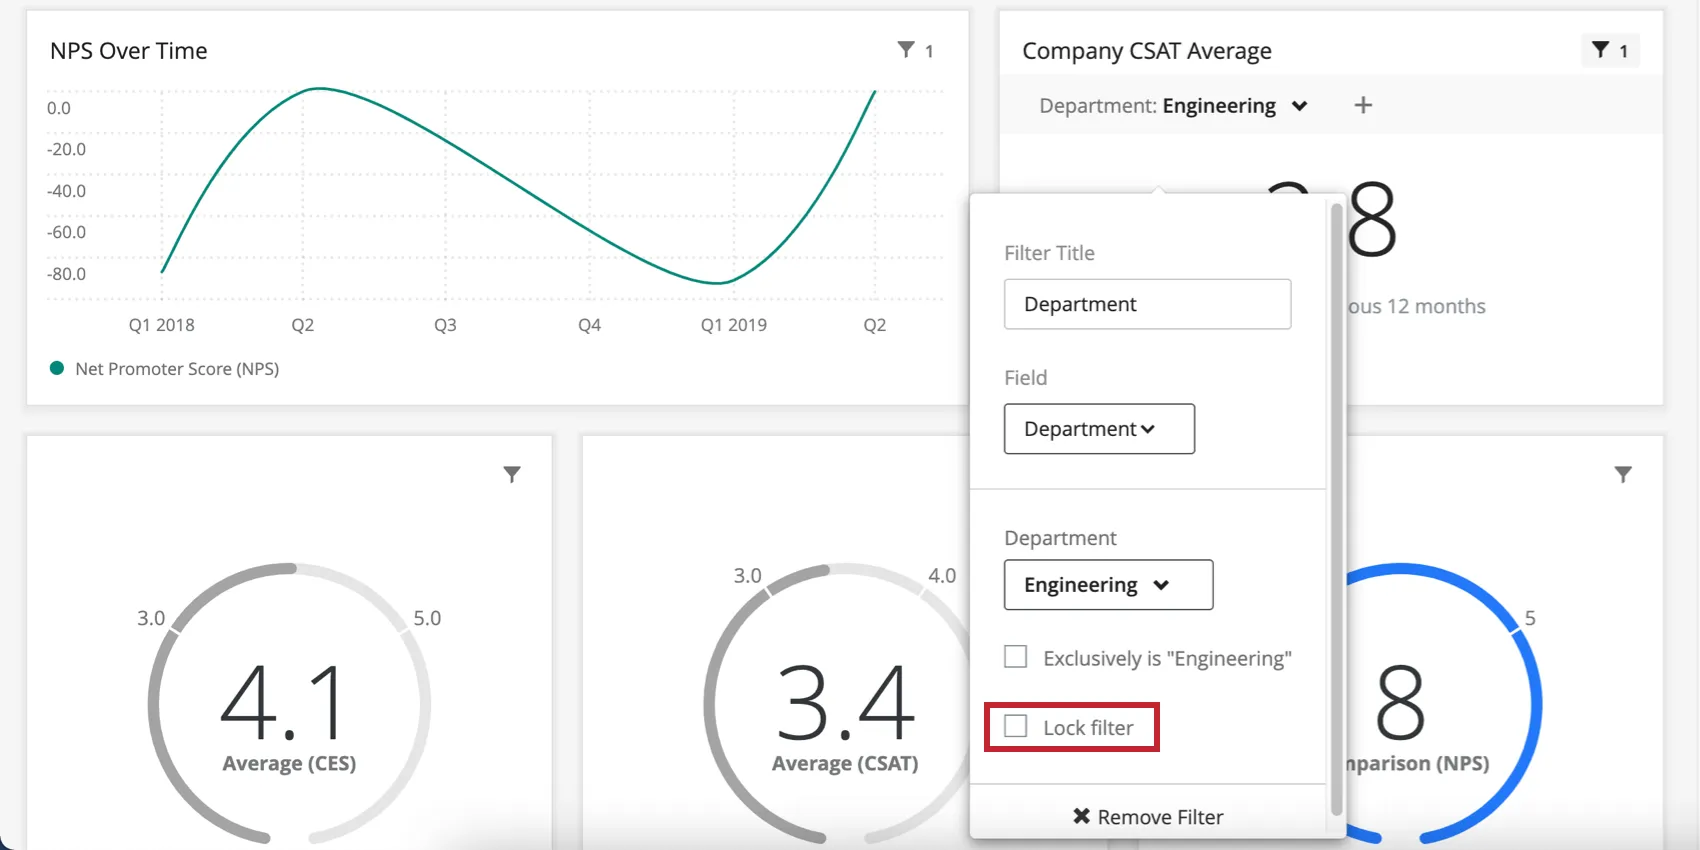
Once a filter is locked, dashboard users won’t be able to adjust it. You can always edit the filter again and unlock it. Locked filters are recognizable by their dark grey background.
Qtip: Locked filters are different from saved filters. When you create a saved filter, it does not include any locked filters. Locked filters only apply to the specific page or widget where they are activated.
Using Filters
Removing Filters
Filter Interactions
Generally speaking for non-Advanced Filters, page level filters will apply to widgets that also have a widget level filter applied. However, in circumstances where the widget level filter and page level filter conflict, the widget level filter will override the page level filter.
For example, if a page filter is set to show only responses from male respondents and a specific widget has a filter to show only responses from female respondents, the page level filter will be ignored and the widget will only show female responses.
However, in a situation where a page level filter does not completely contradict a widget level filter, both filters will be applied. For example, if a filter is set to only show responses from male respondents and the widget level filter is set to show only responses from participants ages 18-24, then the widget will show responses for males who are 18-24 years of age.
When the combination of choices selected in two or more filters results in no data, the filter tells you. After selecting the value of first filter, the next filter will tell you what choices now have no data. This lets you know what filter conditions are less helpful to combine, since they yield no results.
Exclusively is “All”
For fields that have been mapped as Multi-Answer Text Sets, you will have an option called Exclusively is “All” when adding the field as a filter. When selecting this option, the filter will only return data if the user responded with exactly your selection.
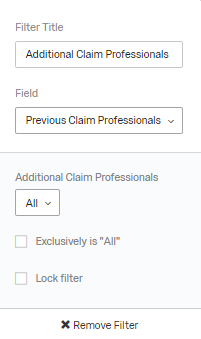
For example, if the question was, “What modes of transportation do you use: Train, Car, Bus” and you specified “Exclusively is: Train, Car,” you would only get responses where the user selected both Train and Car, nothing else.
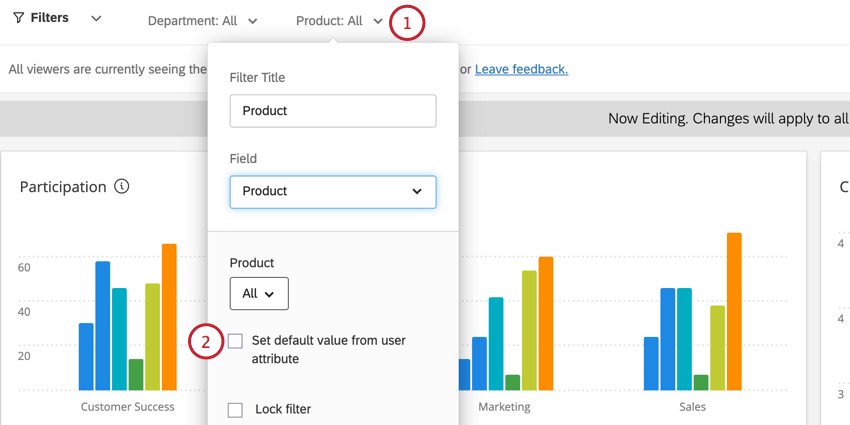
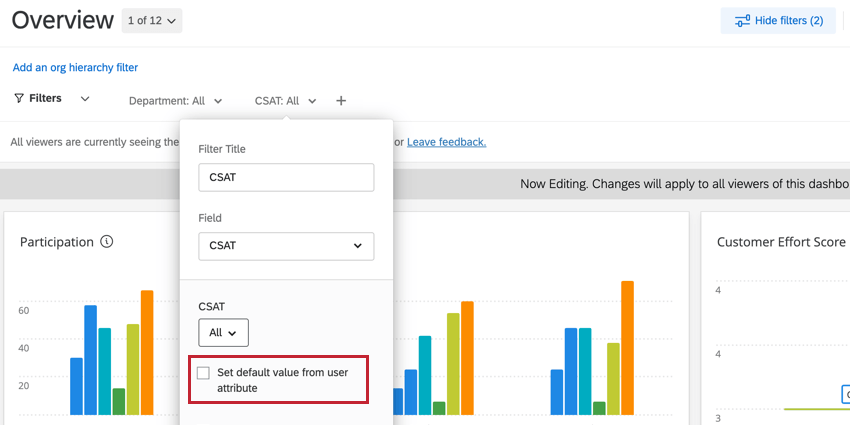
Set Default Value From User Attribute
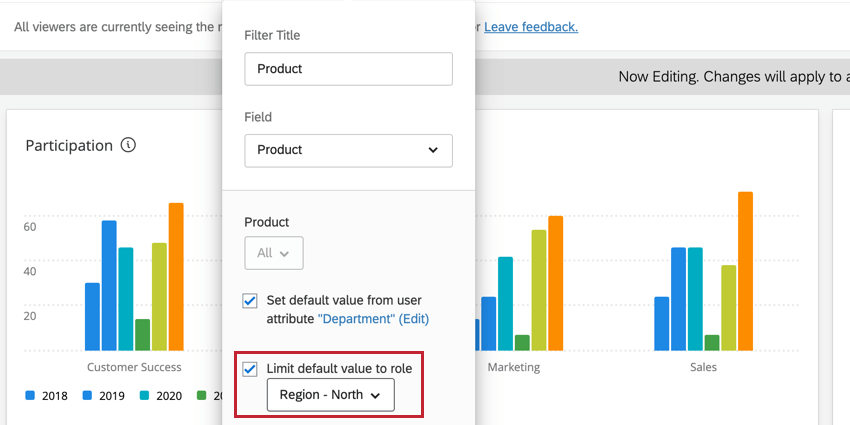
For fields mapped as a Text Set field type, you will have the option to Set default value from user attribute when adding the field as a filter. When selecting this option, the filter will automatically filter for a specific value based on the dashboard viewer’s user attributes.

This requires you to map attribute values to filter values by following the steps below.
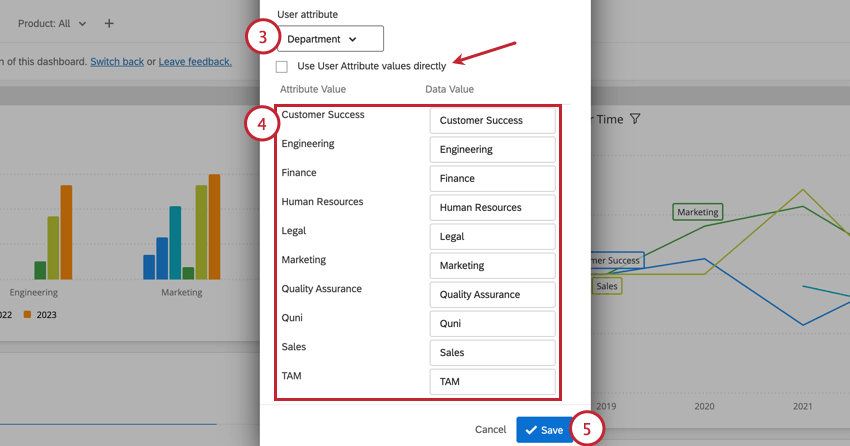
Qtip: Enable Use User Attribute values directly if your filter values and user attribute values already have a one-to-one correspondence and don’t need to edited.
Qtip: You can also assign users who have multiple values for a single user attribute. Multiple values must be separated by a double colon (::). See Editing Individual Metadata Values for more information about using multiple values for a single user attribute.
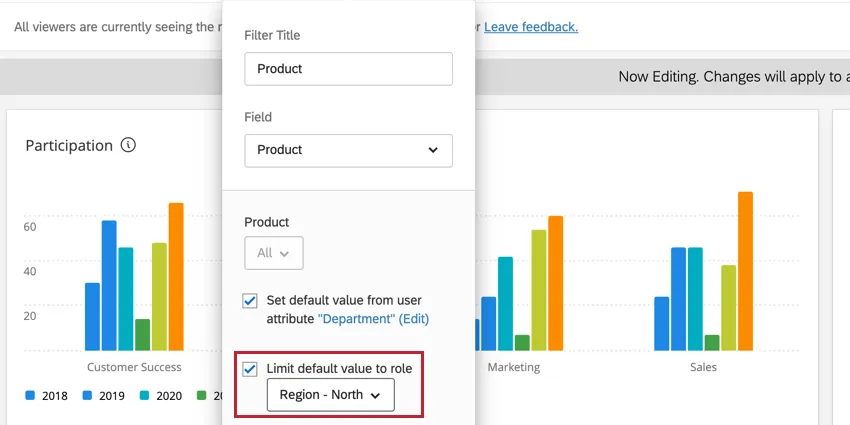
After mapping your values, you also have option to Limit default value to role. This option makes it so that only users in the selected role have the default filter value. Users not in the role will see the filter without a default value applied.
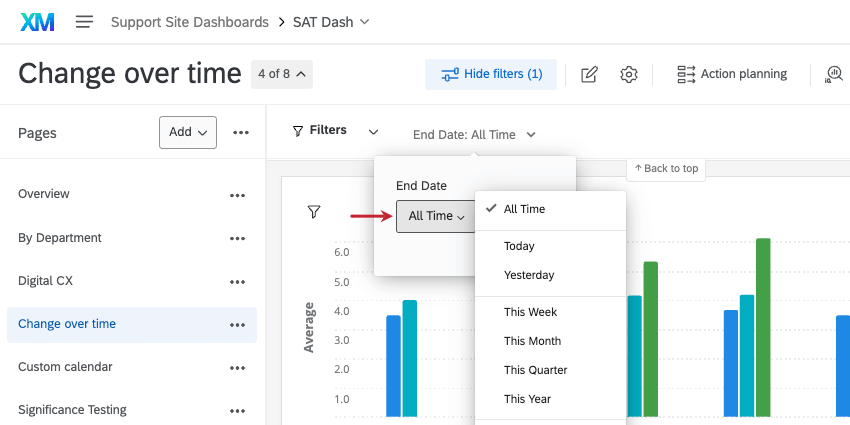
Date Filters
Filters made for fields of the Date field type are unique in a couple of ways. For one, when specifying the date range, you have a lot of unique options. In addition, these filters themselves have ways of offsetting the data you pull in.
Specifying the Date Range
- Today/This Week/Last Days/Last 180 Days/etc.: This date range is dynamic. If you have “This Week” selected, the data that appears will literally be from the past week, changing as you progress through weeks.
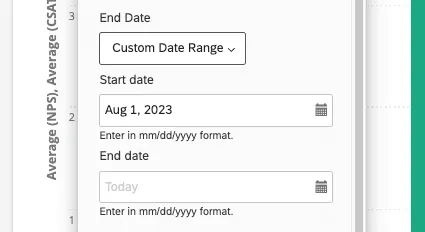
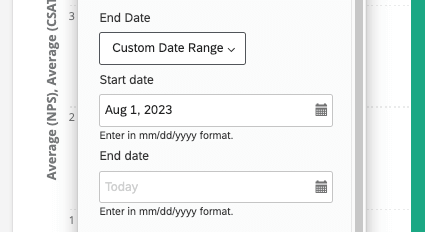
- Custom Date Range: Using the calendars, specify the dates over which you want data included.
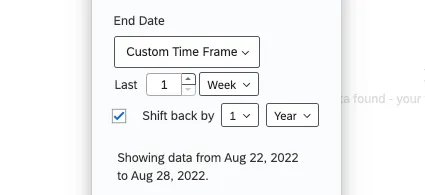
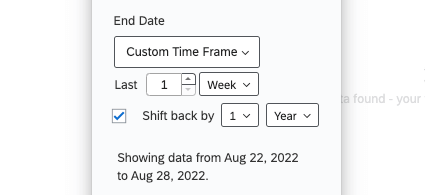
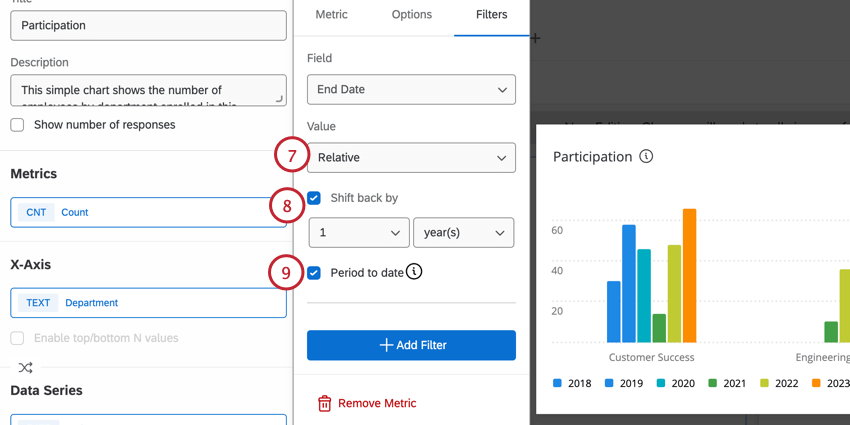
- Custom Time Frame: Custom Time Frame allows you to filter for data collected within the last number of days, weeks, months, quarters, or years. You then have the option to “Shift back” the data by a given period of time. This “Shift back” is described below. For example, in looking at data from the last two quarters, you can “Shift back” by one year to see what the data looked like in the same two quarters one year ago. The filter will describe the exact dates it is covering.
Shift back by Quarter or Year
When you select a preset timeframe like Last 180 Days, or choose Custom Timeframe, you can select Shift back by to adjust the data being displayed in the dashboard to the same period in the amount of time specified. For example, let’s say I want a page of my dashboard to always tell me how my company performed the exact same time last year. Thus shifting back date filters allows us to make helpful comparisons to our current performance.
You can shift back filters by as many years or quarters you want.
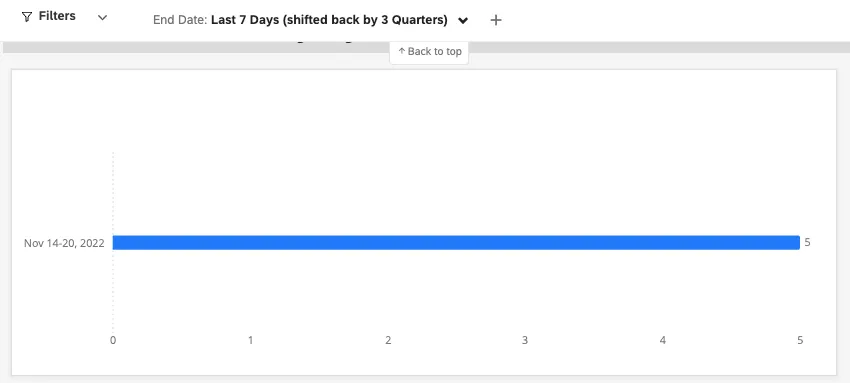
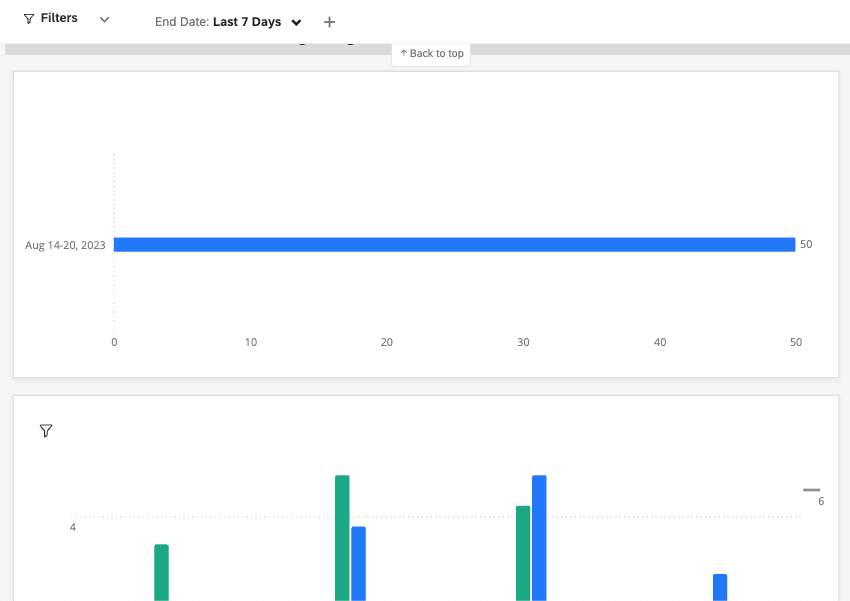
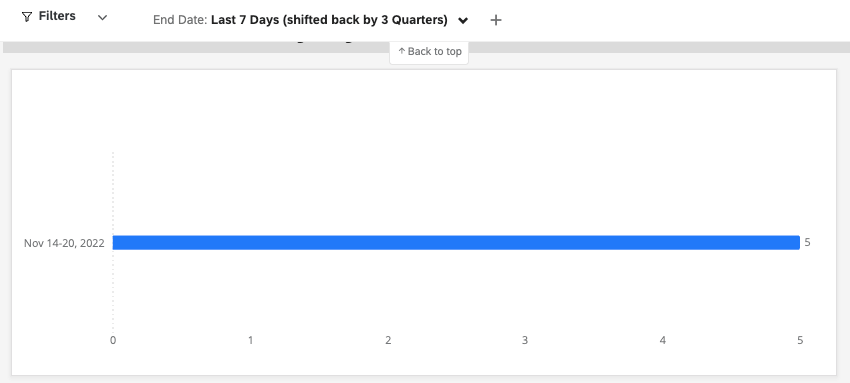
Example: I create a filter on August 21. It is Q3. This is the data I see for the Past 7 Days.

When I offset this data by 3 Quarters, I see data for November 14-20. November is the second month of Q4, just like August is the second month of Q3. August 14-20 covers roughly the same period of 7 days in Q3 that November 14-20 does in Q4.
Relative Filters
Relative filters are a type of shift back filter that can only be on the widget level to simple charts and simple tables. The purpose of relative filters is to filter a widget relative to a page-level date filter. For example, if your entire page is filtered to show data for the last 7 days, you can use a relative filter on your widget to show data for the same week last year.
Translating CX Dashboard Filters
Like many other elements in the dashboard, page filters can be translated. To learn more, see the Dashboard Translation (CX) support page.
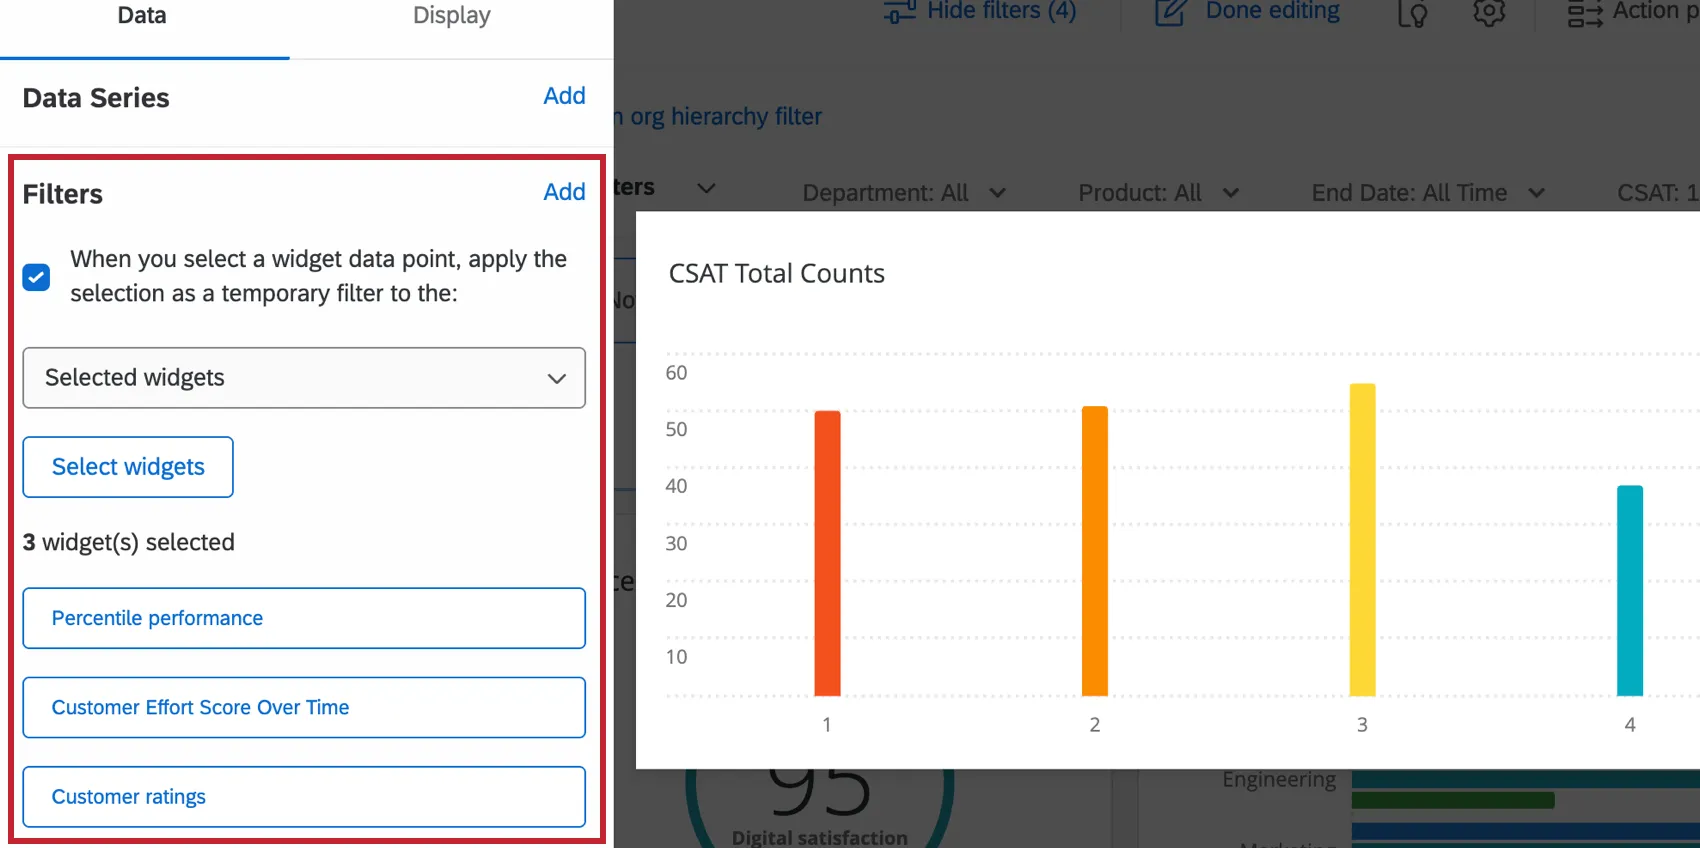
Widget to Widget Filtering
Enable widget to widget filtering to filter other widgets in your dashboard after clicking on a specific data point. For more information, see Widget to Widget Filtering.
FAQs
I selected "Set default value from user attribute" in my CX Dashboard page filter. Why are these users still seeing all data? / Why aren’t these users seeing a specific attribute value?
I selected "Set default value from user attribute" in my CX Dashboard page filter. Why are these users still seeing all data? / Why aren’t these users seeing a specific attribute value?
Also, make sure that the user does not appear in two different Roles. Similarly, make sure the dashboard hasn‘t been shared with users both individually and through a Role. In either case, they will see the most restrictive of the two.
Lastly, make sure that you have set the correct data restriction.
Can Dashboards projects only be used for customer experience research?
Can Dashboards projects only be used for customer experience research?
That's great! Thank you for your feedback!
Thank you for your feedback!