
Custom Metrics
What's on this page
About Custom Metrics
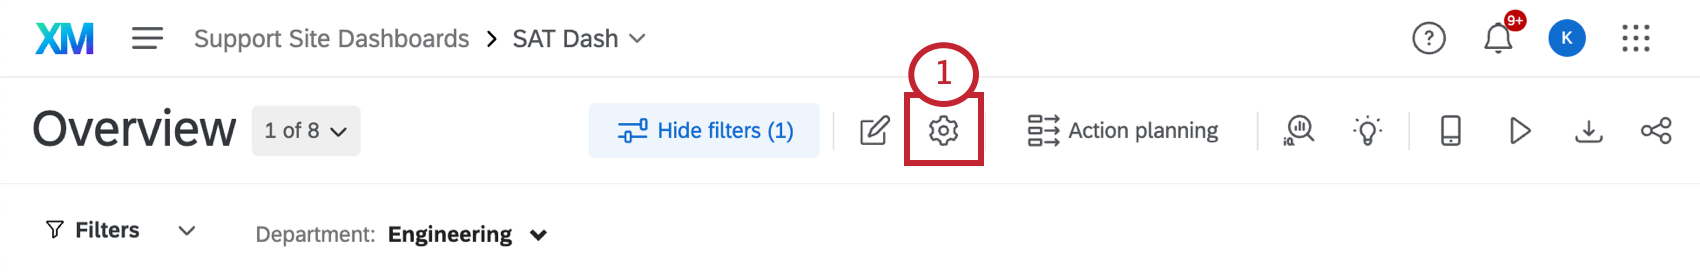
Custom metrics are created in the dashboard’s settings. You can use custom metrics to build equations based on one or more data fields. This allows you to create a single custom metric that pulls in data from different fields in your dashboard.
Note that custom metrics are not project-wide; they will only be available in the dashboard where you created them and in copies of that dashboard.
Feature Availability
Custom metrics are only available in the following types of dashboards:
Creating a Custom Metric
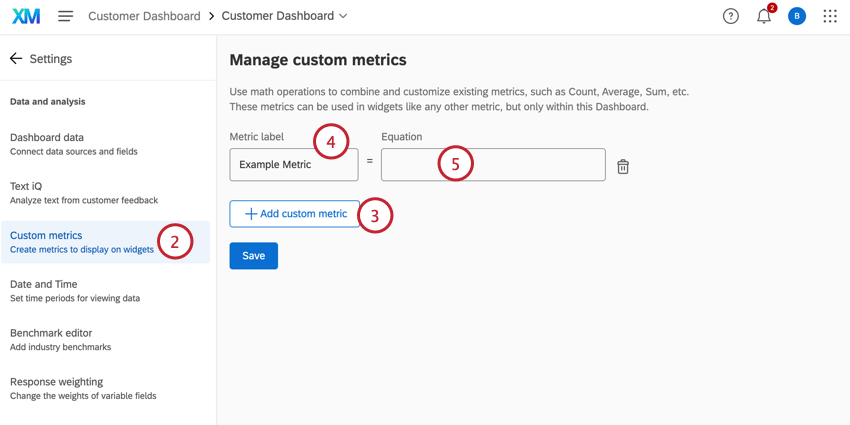
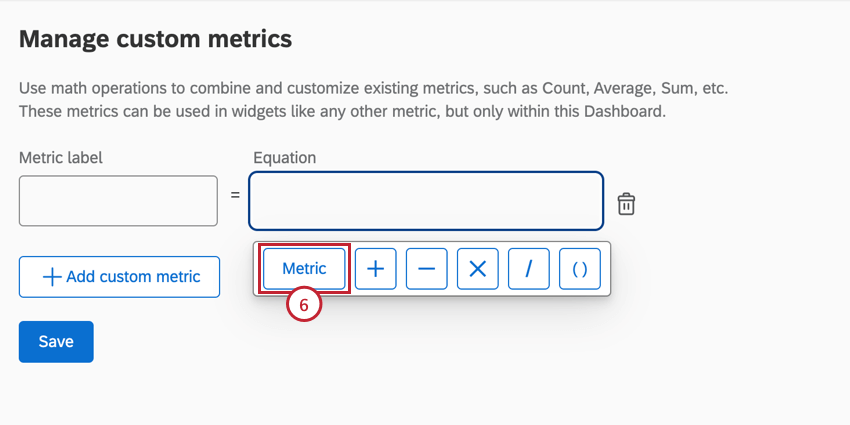
You can create as many custom metrics as you’d like. To create a custom metric:
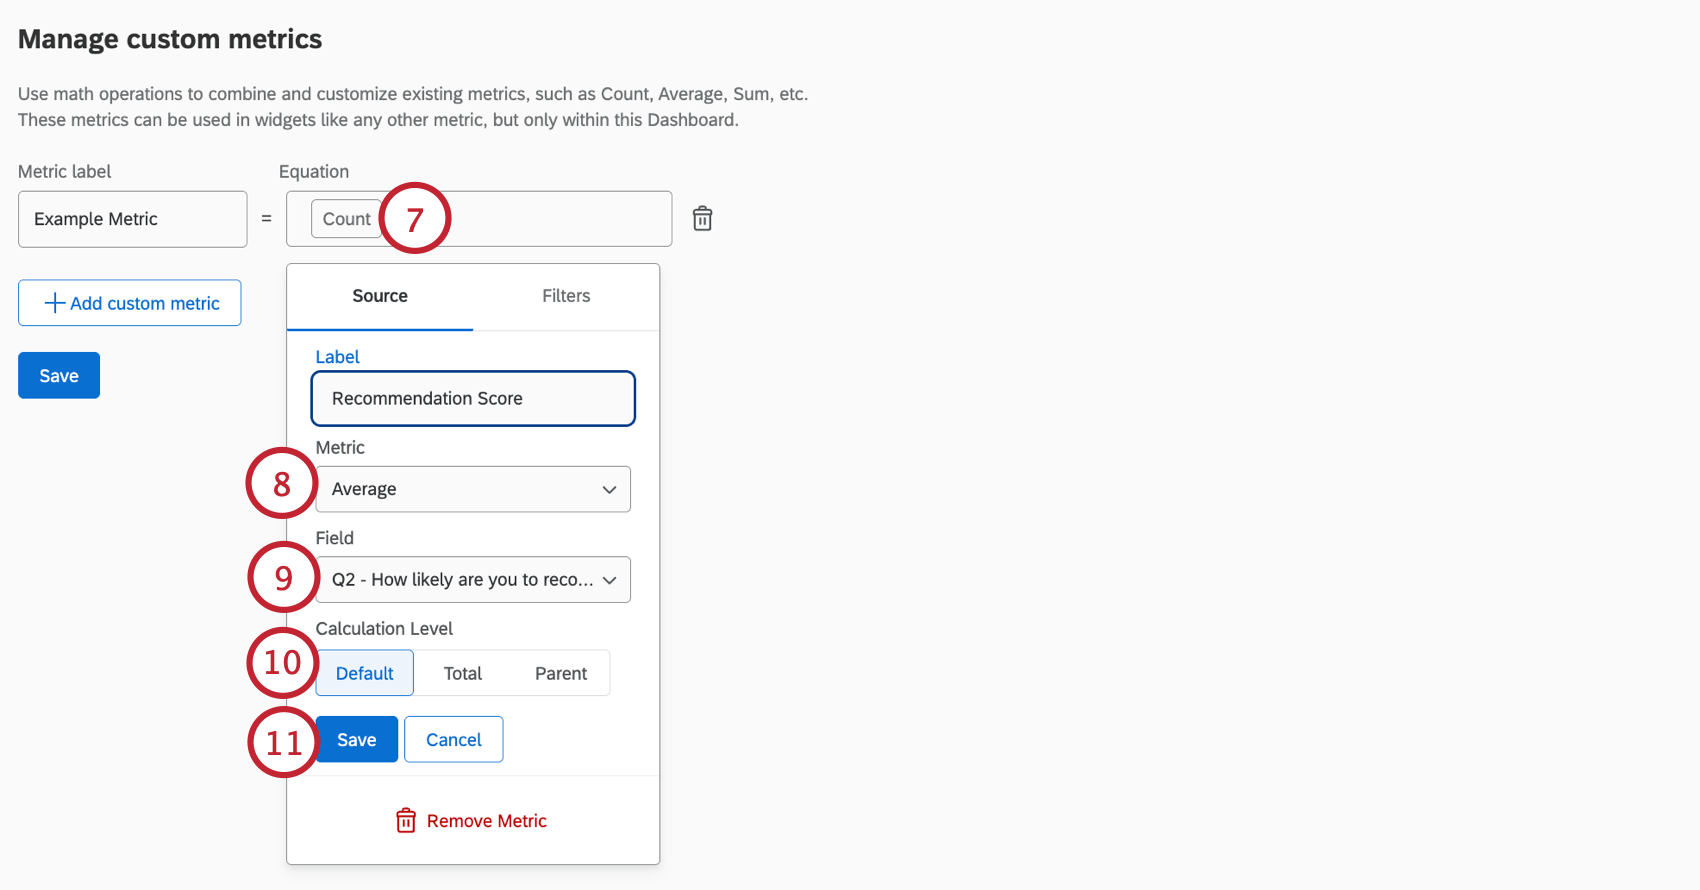
Attention: Do not select Subset Ratio from the Metric dropdown when you create a Custom Metric. Instead, see the linked section in order to add a Subset Ratio Metric.
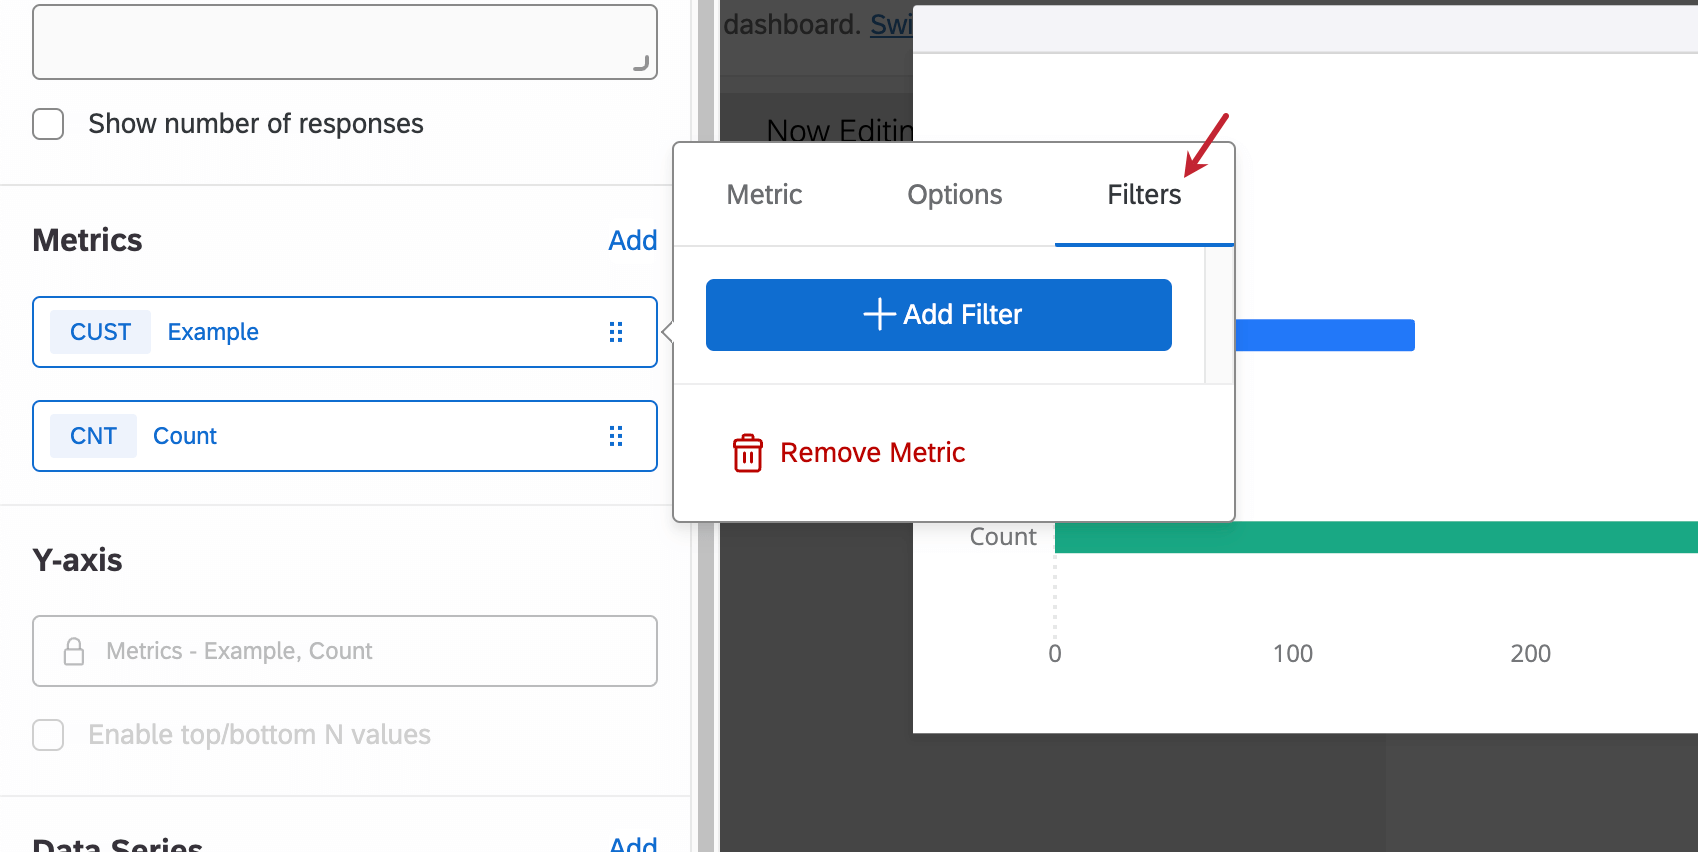
Qtip: You can also filter your metric by switching to the Filters tab when choosing a metric.
- Default: Calculate data at the most granular level applying all row, column, or axis dimensions.
- Total: Calculate data at the widget level, ignoring all row, column, or axis dimensions.
- Parent: Calculate data one level up from the most granular level, using the parent row, column, or axis dimension.
Qtip: “Calculation Level” replaced an option called “Ignore Breakouts.” The same widget behavior is accomplished by selecting “Total” for the calculation level.
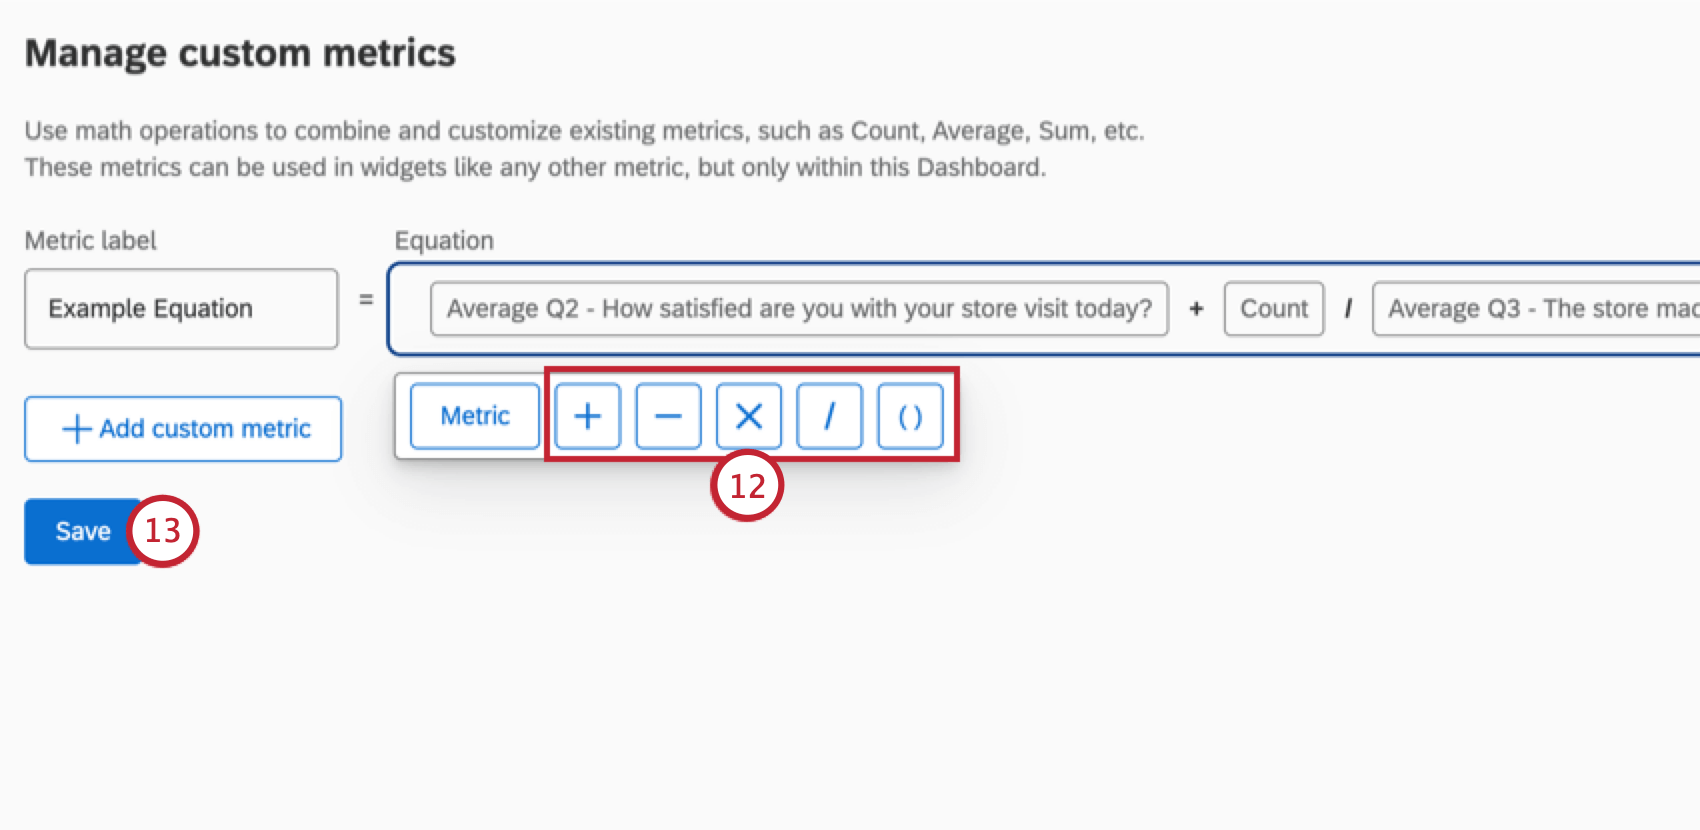
Qtip: If you see a red triangle with a “!” inside of it, this means that the equation is currently invalid. Check to make sure you do not have unnecessary mathematical functions or two metrics next to each other that are not separated by mathematical functions. Both of these instances could cause the equation to be invalid.
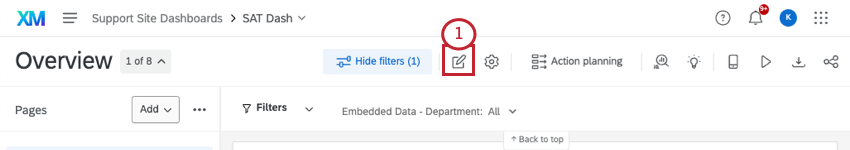
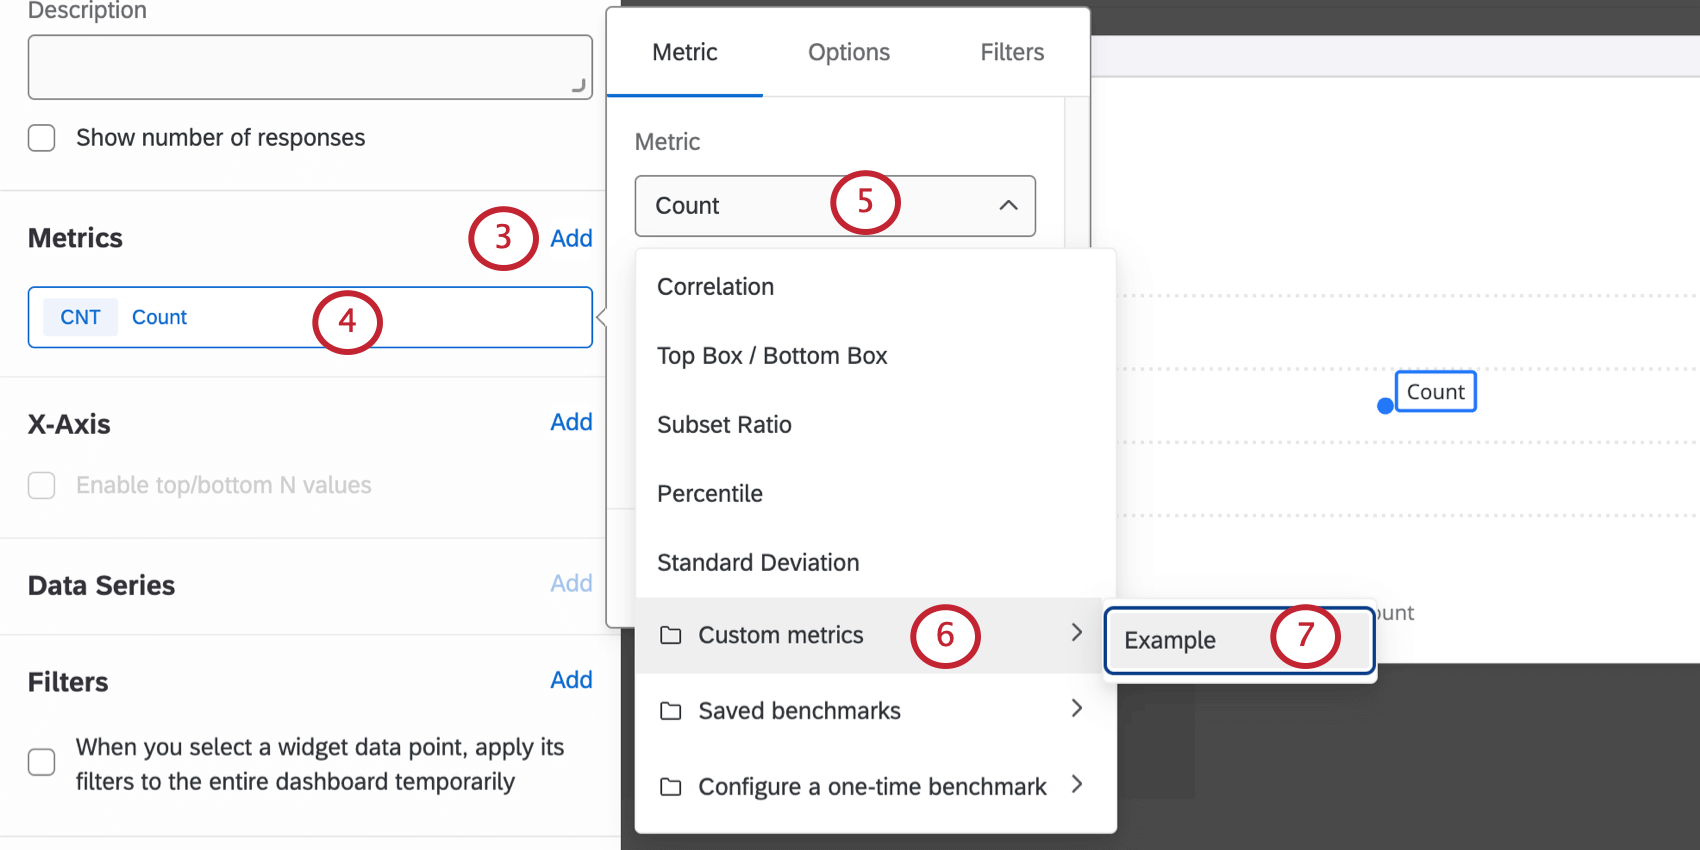
Adding a Custom Metric to a Widget
Subset Ratio Metric
Qtip: This metric is available on line, horizontal bar, vertical bar, and table widgets in CX and EX dashboards. Although this page specifically relates to CX, the directions for using the subset ratio metric are consistent across both CX and EX dashboards.
If you would like to display a proportion of values in a line, bar, or table widget, we recommend that you use a subset ratio metric instead of a custom metric. Subset ratios are especially useful in Brand Experience dashboards and can help reduce load times.
Keep in mind that when selecting the numerator and denominator for the ratio, each respective field will be independent. The numerator will represent one count metric, regardless of the denominator you choose (although they can be related), and vice versa. In other words, the subset ratio metric can be thought of as (Item 1 count) / (Item 2 count), where Item 2 does not automatically tie Item 1 to the proportion.
When reporting on imagery attributes in line and bar charts, the base size needs to be set to the number of people who are aware of the brand. For example, you may want to create a custom metric that takes the number of people who selected a specific brand in an attribute question and divide by the number of respondents aware of the brand. The subset ratio metric makes it easy to calculate this proportion by automatically selecting the correct numerator and denominator.
Qtip: The numerator and denominator fields must be numeric or have numeric recode values. Numeric values, number sets, text sets, and multi-answer text sets that can be recoded as numeric values are compatible with the subset ratio metric. This includes measure group fields with one of those fields types. For example, a text set field labeled “one” can be recoded as “1” in the dashboard recode editor. Text iQ fields mapped as text sets are not compatible with this metric, since they do not have numeric recode values.
Adding a Subset Ratio Metric to a Widget
Qtip: The metric setup for line, bar, and table widgets will be the same.
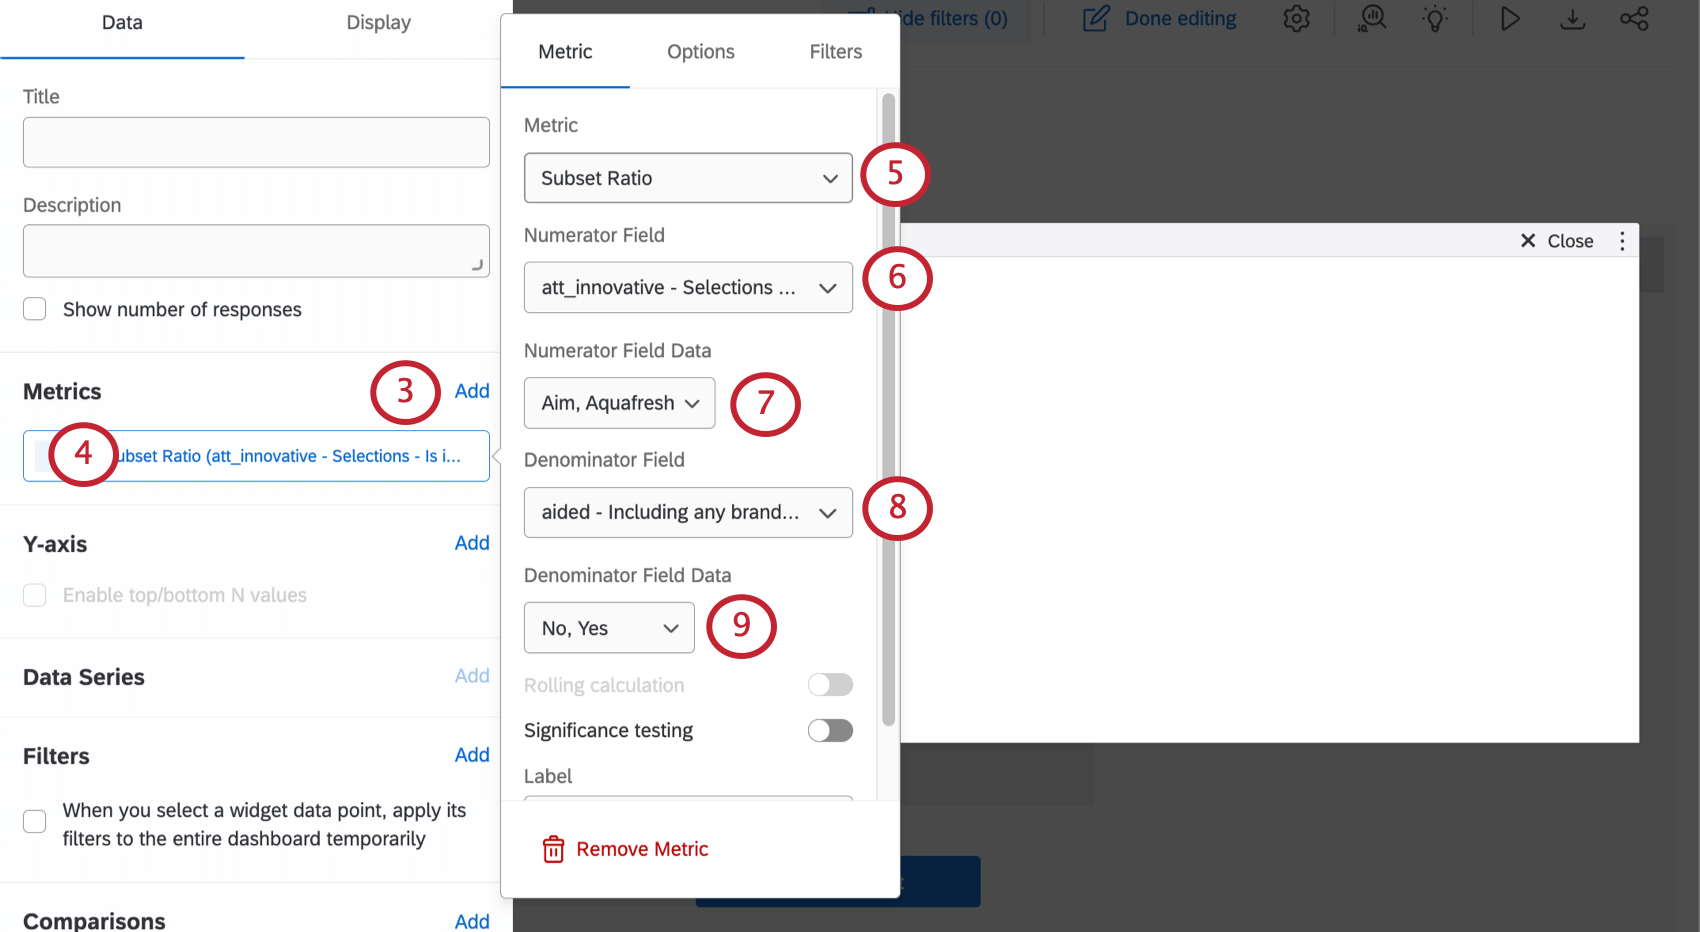
Qtip: The numerator field should be the present values. In a Brand Experience project, this will be one of the imag questions.
Qtip: These values will help you visualize the number of people who selected a specific answer choice. For example, we would choose the specific brands we’d like to analyze, Gartells and Jones.
Qtip: The denominator field should be the total values. In a Brand Experience project, this will be the aided question.
Qtip: These values will help you visualize the number of people who were aware of a specific answer choice. For example, we would choose the same brands as the numerator values, Gartells and Jones.
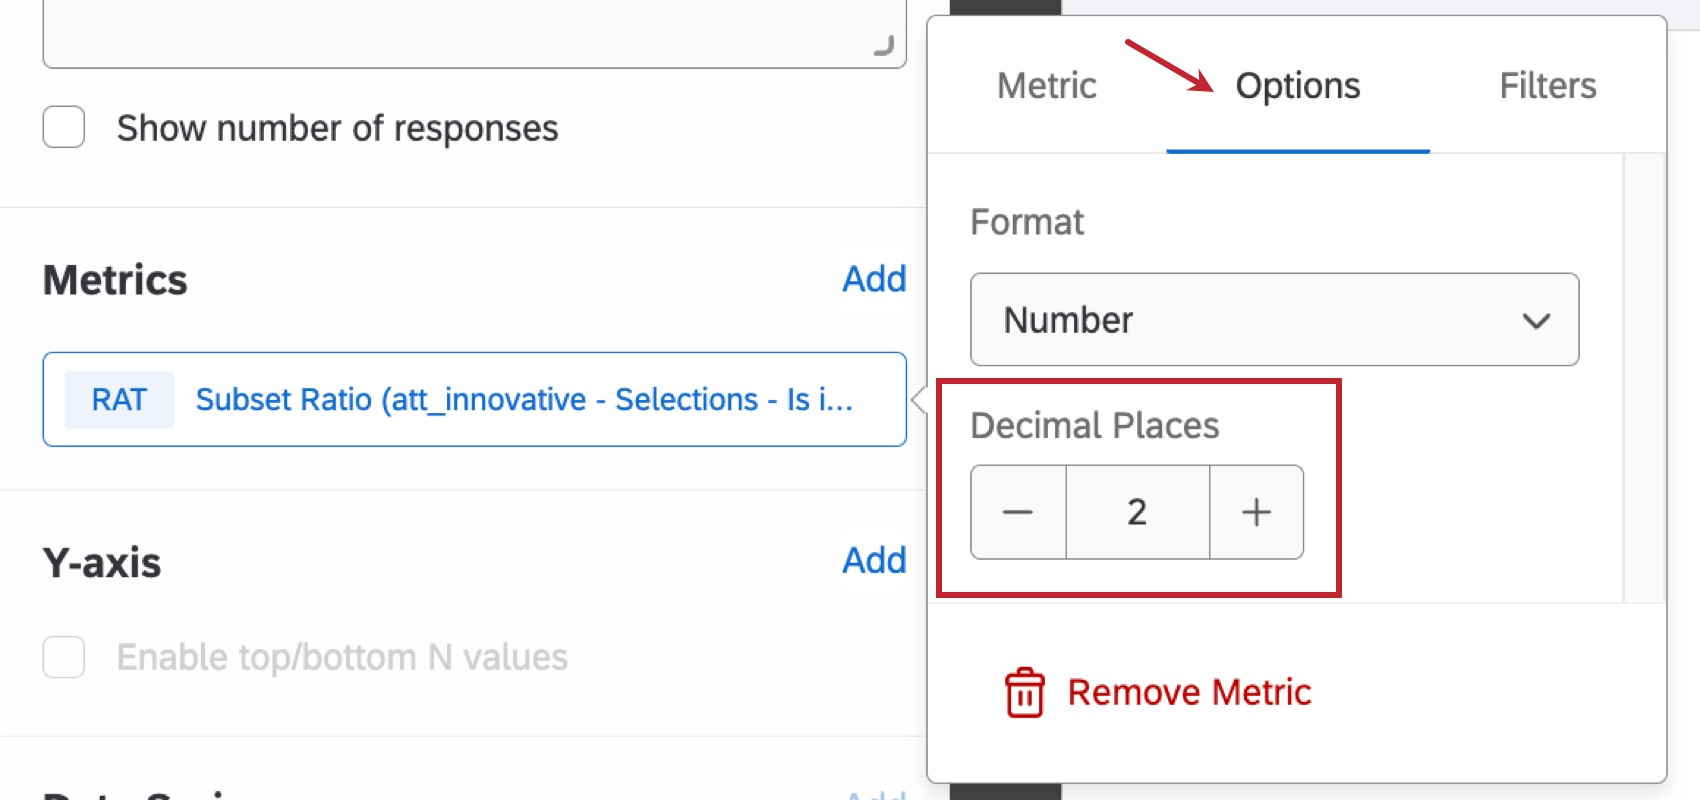
Attention: If you are applying the subset ratio metric to a table widget, make sure to adjust the Decimal Places in the Options menu when configuring your metric. This will ensure that you can properly view the subset ratio in your widget.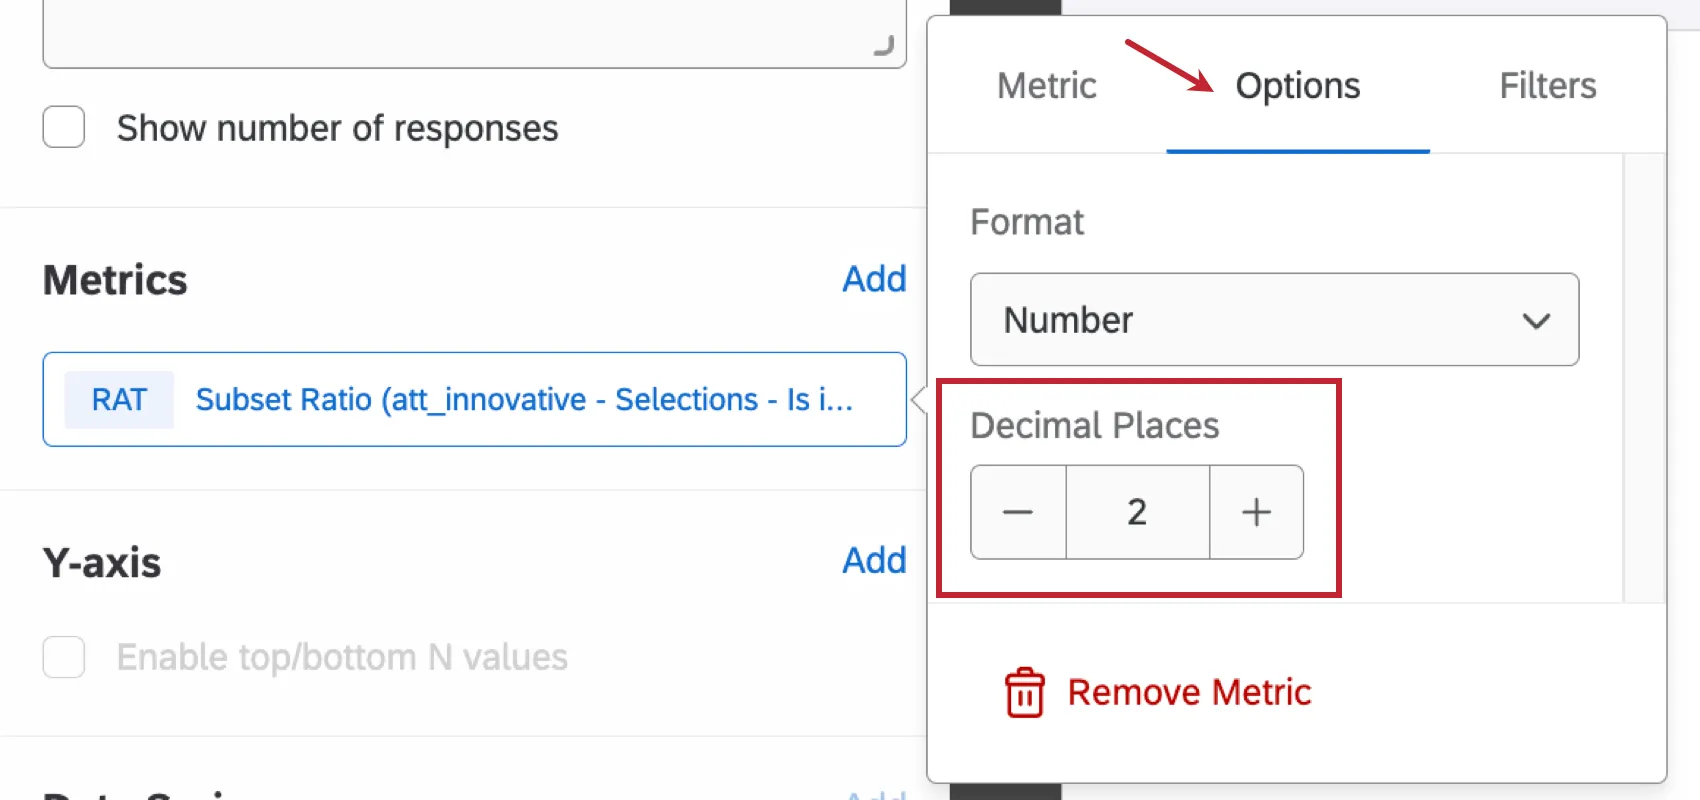
Compatible Widgets
Below is a list of widgets that have a metrics field. If a widget has a metrics field, you can add your custom metric to it.
Qtip: Even though they allow you to select a metric, neither breakdown tables nor multiple source tables are compatible with custom metrics. Key drivers are also incompatible, as “Outcome Metrics” are not the same as the metrics included in other widgets.
Editing a Custom Metric on a Widget
Qtip: Please note that custom metric filters, much like regular metric filters, will override both page level filters and widget filters.

FAQs
How do custom metric filters interact with page filters in BX dashboards?
How do custom metric filters interact with page filters in BX dashboards?
That's great! Thank you for your feedback!
Thank you for your feedback!