
Testing Unpublished Intercept Changes
What's on this page
About the Test Intercept Section
You can test your unfinished, unpublished intercept on any website you want. This can be a great way to make sure your intercepts work the way you want before publishing changes to the live code on your website, where visitors can see.
Attention: When running a test, bookmarklets only consider targeting logic. If the bookmarklet fails for another reason (for example, repeated display prevention), it will still show that it passed. The bookmarklet also doesn’t consider custom trigger options or custom display options. When testing, the intercept will only appear and be marked as passed if the Intercept Display is On Load. Otherwise, the bookmarklet will say it has passed, but not actually show the intercept unless these trigger and display options have been met.
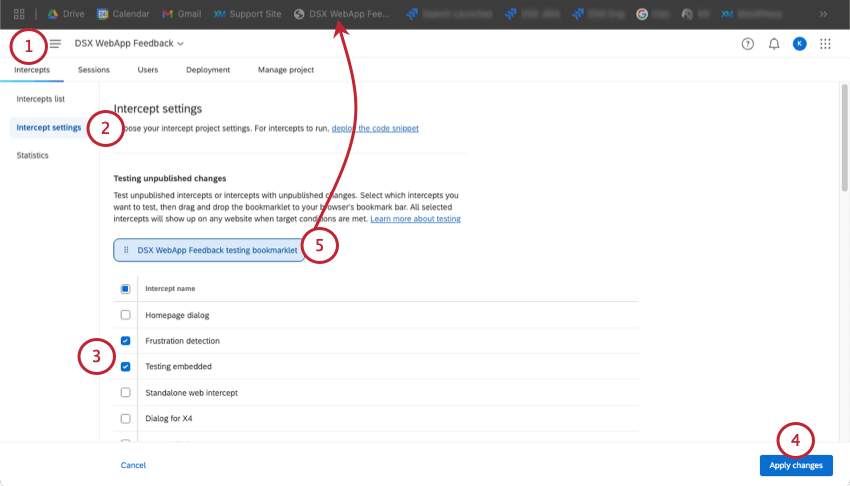
Running Tests from Intercepts Settings
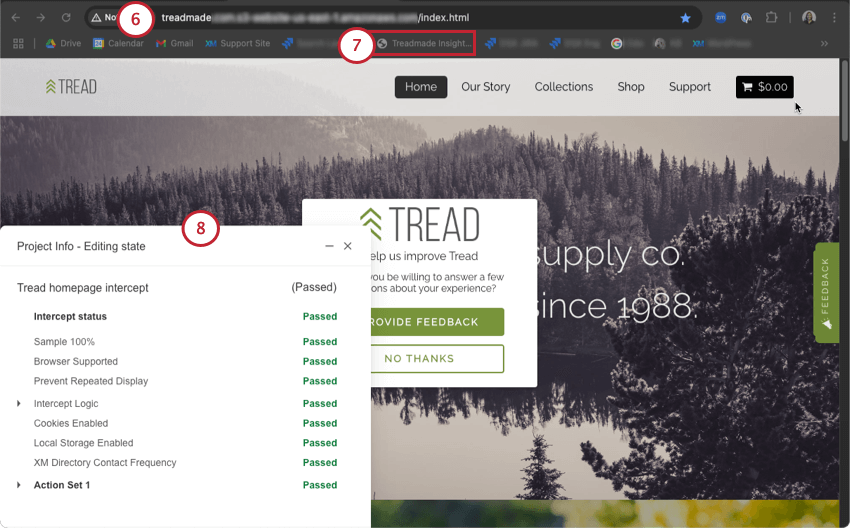
On the Intercepts settings page, you can run tests on multiple intercepts at once. You can test both standalone intercepts and guided setups this way.
Qtip: For more detailed instructions, refer to the section on Displaying the Bookmark Bar below.
Qtip: When you run the bookmarklet on the individual intercept level, the “Any Intercept in this Zone” logic doesn’t function the same because you are loading a given intercept rather than a zone or project.
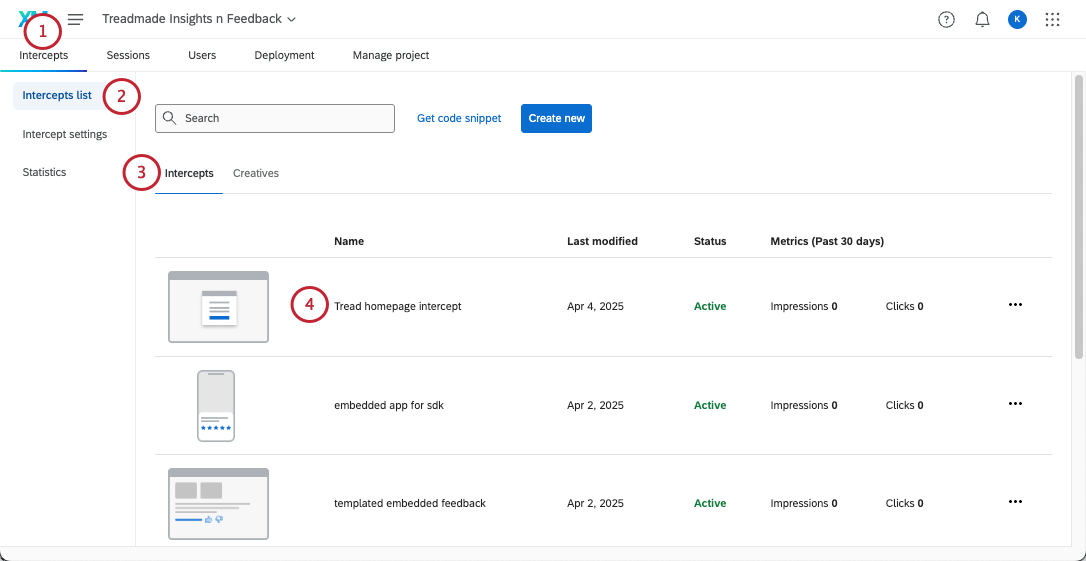
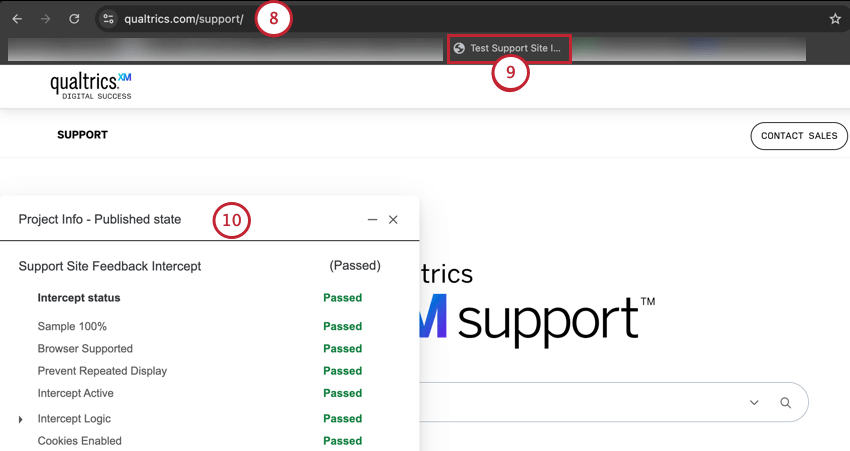
Testing Individual Intercepts
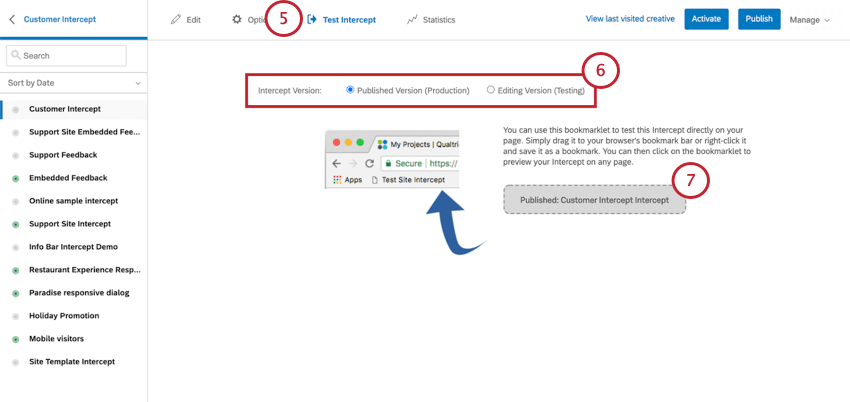
Qtip: Though the published version can also be previewed, we recommend using the Editing Version for testing as it allows you to preview changes without having to publish them. That way you can test settings on a live intercept without changing what visitors see on your site.
Qtip: When you run the bookmarklet on the individual intercept level, the “Any Intercept in this Zone” logic doesn’t function the same because you are loading a given intercept rather than a zone or project.
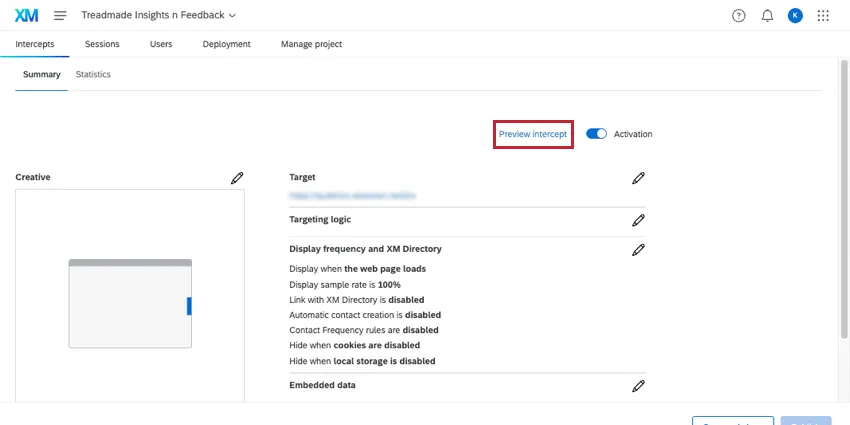
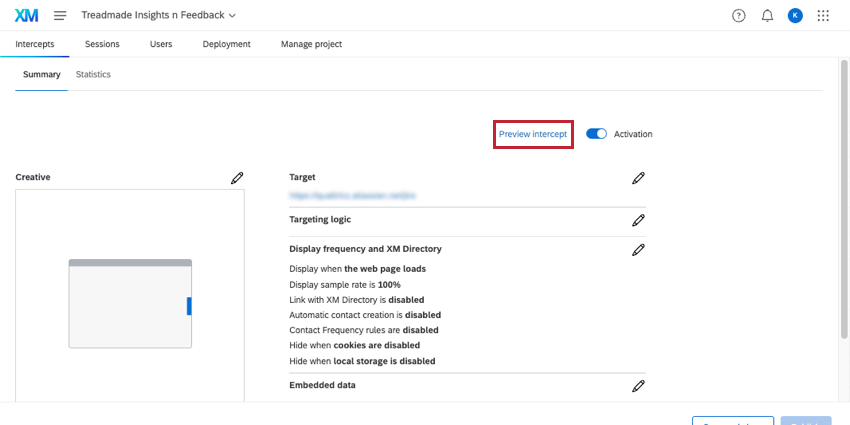
Qtip: These steps are written for standalone intercepts. Guided intercepts tend to have testing included in the guided setup, or if you click Preview intercept on the page shown below.
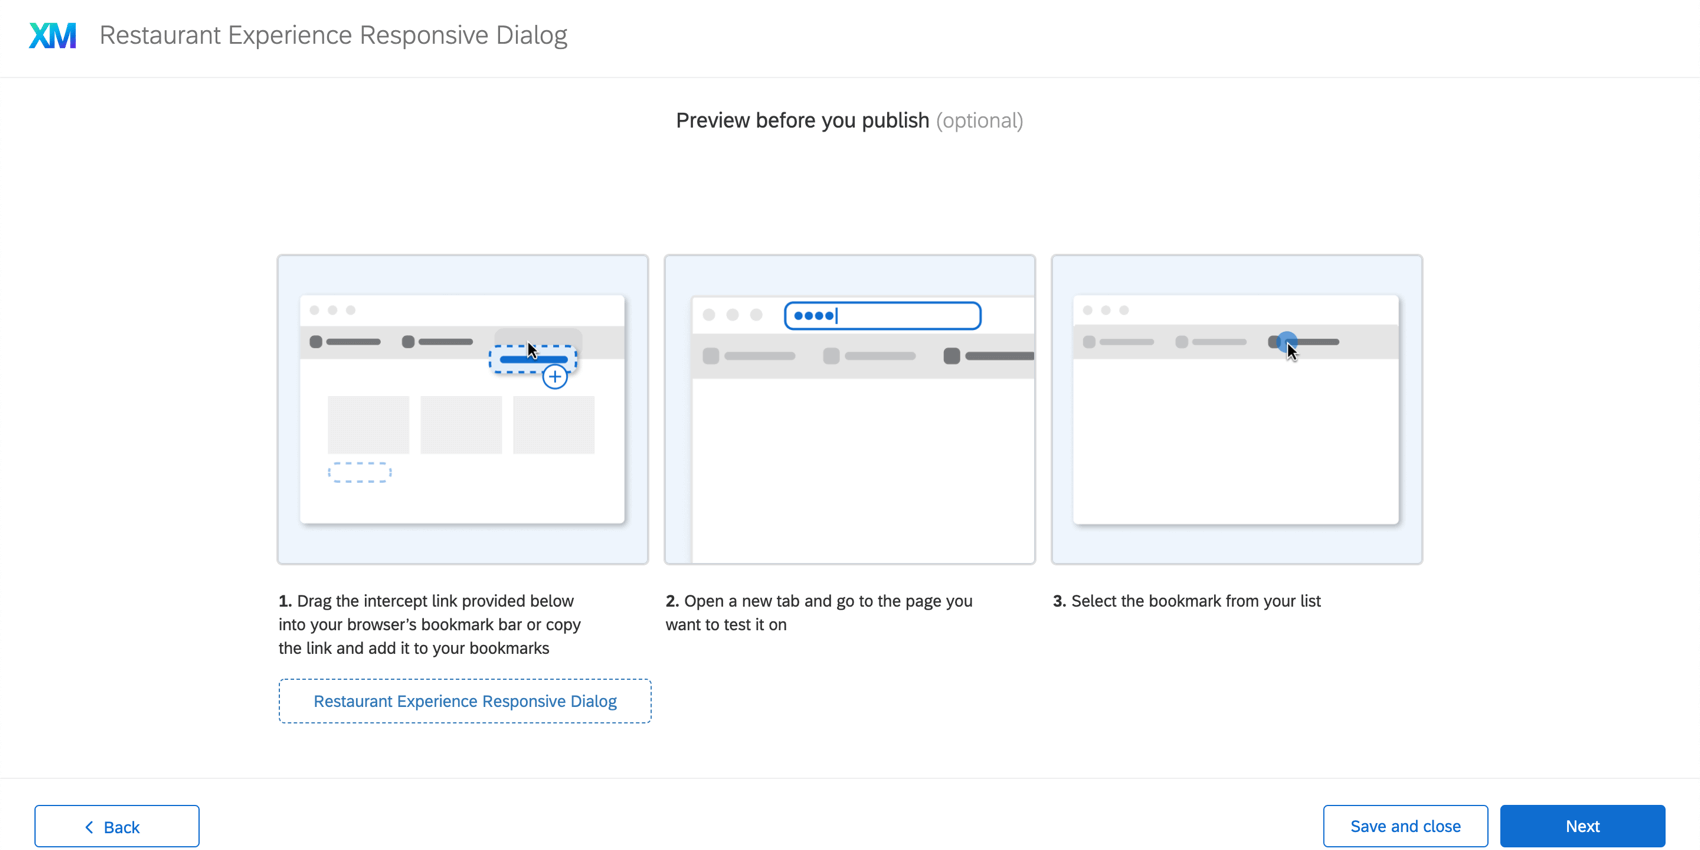
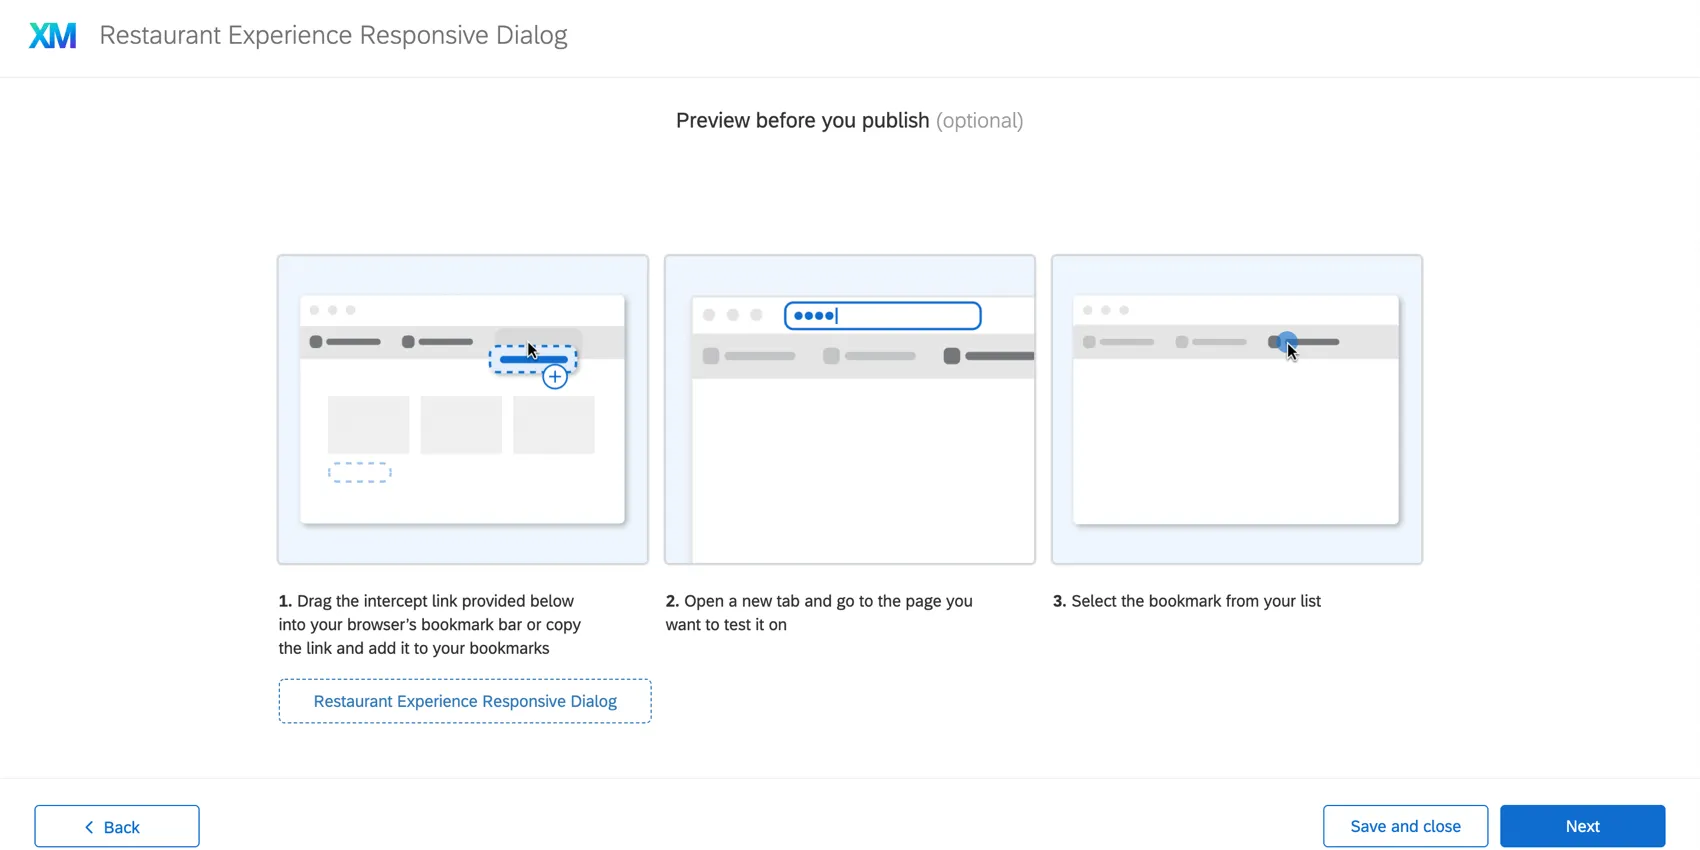
Displaying the Bookmark Bar
If your web browser has a bookmarks (or favorites) toolbar, saving the bookmarklet needed to preview your intercept is as simple as dragging it onto that toolbar. If you don’t have a bookmarks toolbar, the following steps will describe how to display it on your browser.
Qtip: In every browser, you can right-click to delete a bookmark once you’re finished using it.
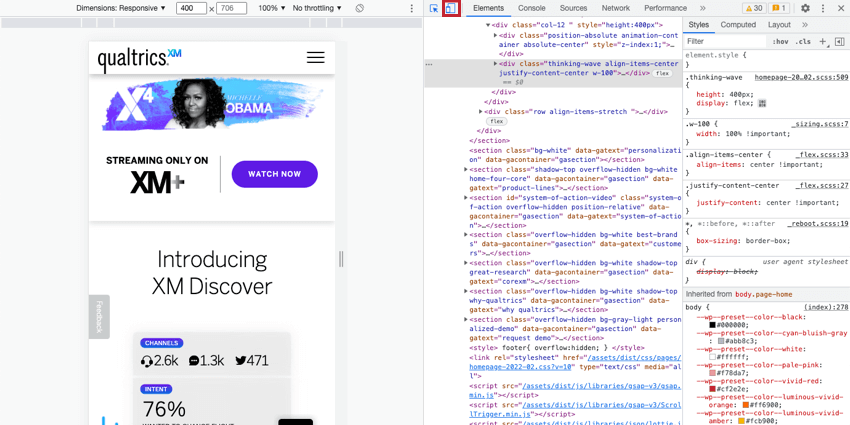
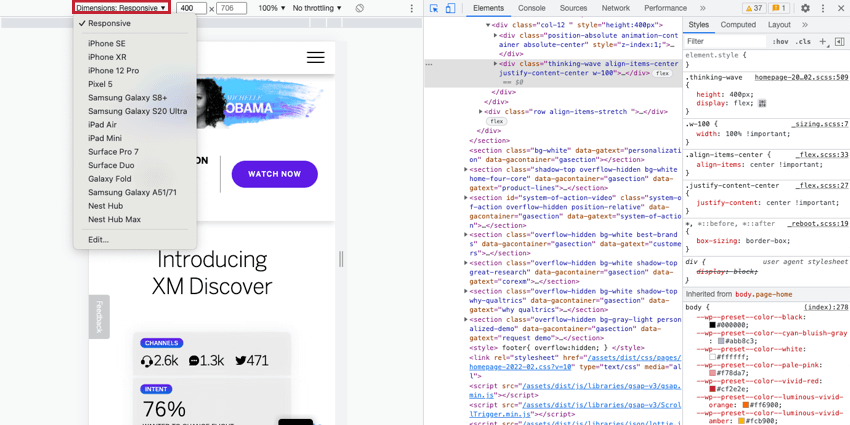
Testing on a Mobile Browser
Saving the bookmarklet to a mobile browser is certainly possible, but a bit tricky given how mobile browsers don’t typically let you drag and drop. The best way to test how your intercept will appear and behave on mobile devices is to access the developer tools in your web browser.
Troubleshooting Tips
Intercept Logic
- Make sure the values are correct.
- Examine your use of “Is” vs. “Contains.”
- Examine your use of And/Or logic.
- Watch out for spaces in the values.
Revision History
Make sure the published version is the most recent (or the version that you would expect).
Watch For the Website Feedback Network Request
Look For Other Hanging Script Requests That Might Be Interfering With Our Script
Qtip: You will also want to right-click and select View Page Source to verify that your project code is actually on the page.
That's great! Thank you for your feedback!
Thank you for your feedback!