
Return to Work Pulse 2.0 (EX)
What's on this page
About the Return to Work Pulse 2.0 for EX
The Return to Work Pulse helps you quickly understand how and when your employees can confidently return to the workplace. Whether teams have been working from home, staying off site due to temporary business closures, or staying home due to health concerns, the Return to Work Pulse helps HR, Operations, IT and Leadership teams address each employee’s unique needs to make a safe and positive transition back.
This solution comes with a pre-configured survey and dashboard.
Qtip: Only existing customers with EX licenses that have access to Ad Hoc Employee Research projects have access to this version of the Return to Work Pulse 2.0 for EX. These two solutions have identical setup: the major difference is that version 1.0 has premade reports, whereas the EX version has a premade dashboard and unique EX functionality.
Qtip: Responses collected with the Return to Work Pulse 2.0 will count towards your account’s response limit.
Methodology
Pre-built assessment questions and an automated point-in-time dashboard cover the following Return to Work topics: Health and safety needs, company and manager communication requirements, and readiness to re-integrate.
This solution can be used for reopening planning as well as readying the organization, teams, and managers for a variety of situations, including:
We recommend starting with the Return to Work Pulse for a simple, lightweight way to quickly inform decisions on the timing and actions needed to successfully reopen your workplace. Then, utilize additional Qualtrics XM Solutions to help with new workplace protocols, technology and facilities decisions, improving leadership agility, and designing effective employee experiences for the new realities of how we work.
Use real-time employee sentiment data to make the best plans for your organization – and your employees – as you transition back to the workplace.
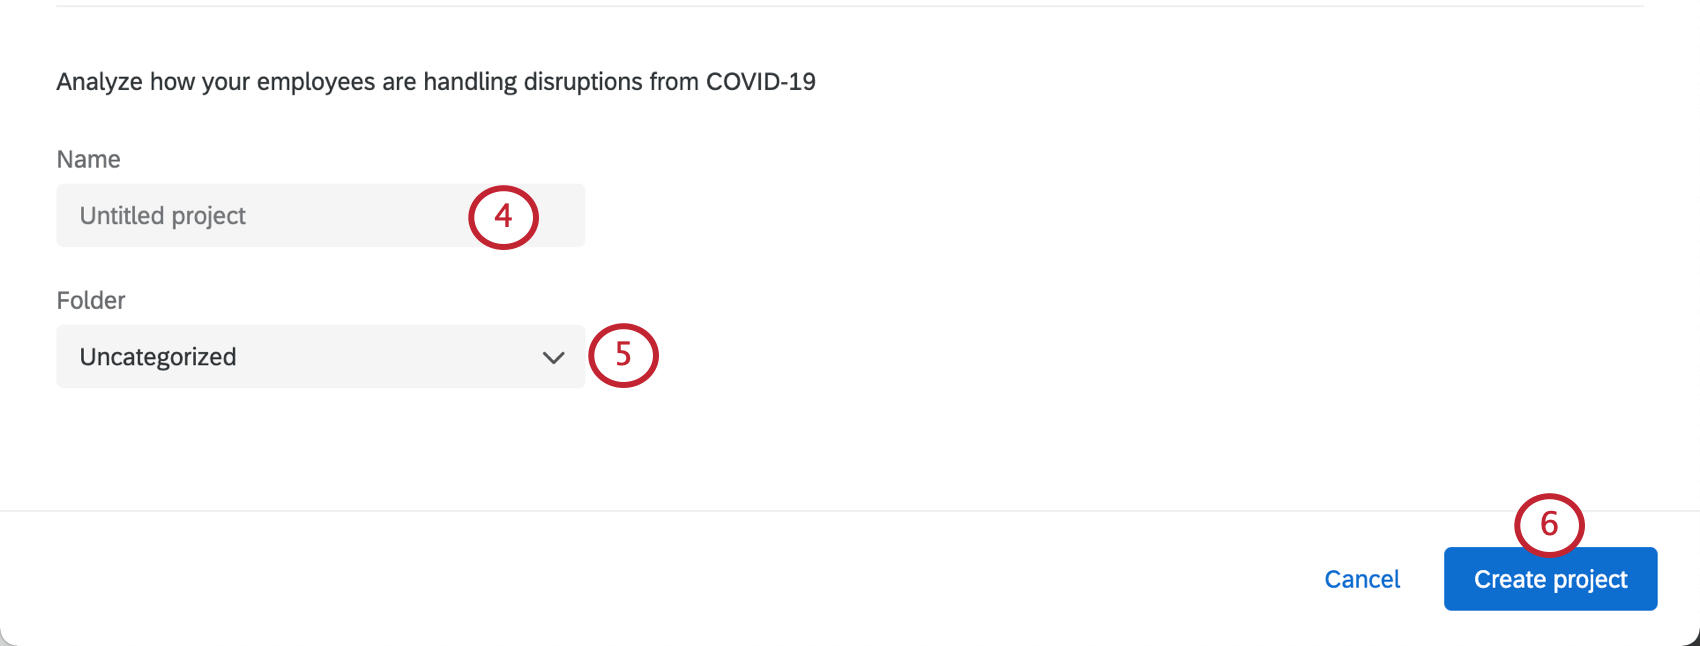
Creating a Return to Work Pulse
Only existing customers with EX licenses that have access to Ad Hoc Employee Research projects have access to this version of the Return to Work Pulse 2.0 for EX. However, users without an EX license should consider the Return to Work Pulse 1.0. See the linked page for more details.
Qtip: This XM Solution is only available if your account language is set to English. However, you can upload survey translations or auto-translate using Google Translate, and upload translations for your dashboard.
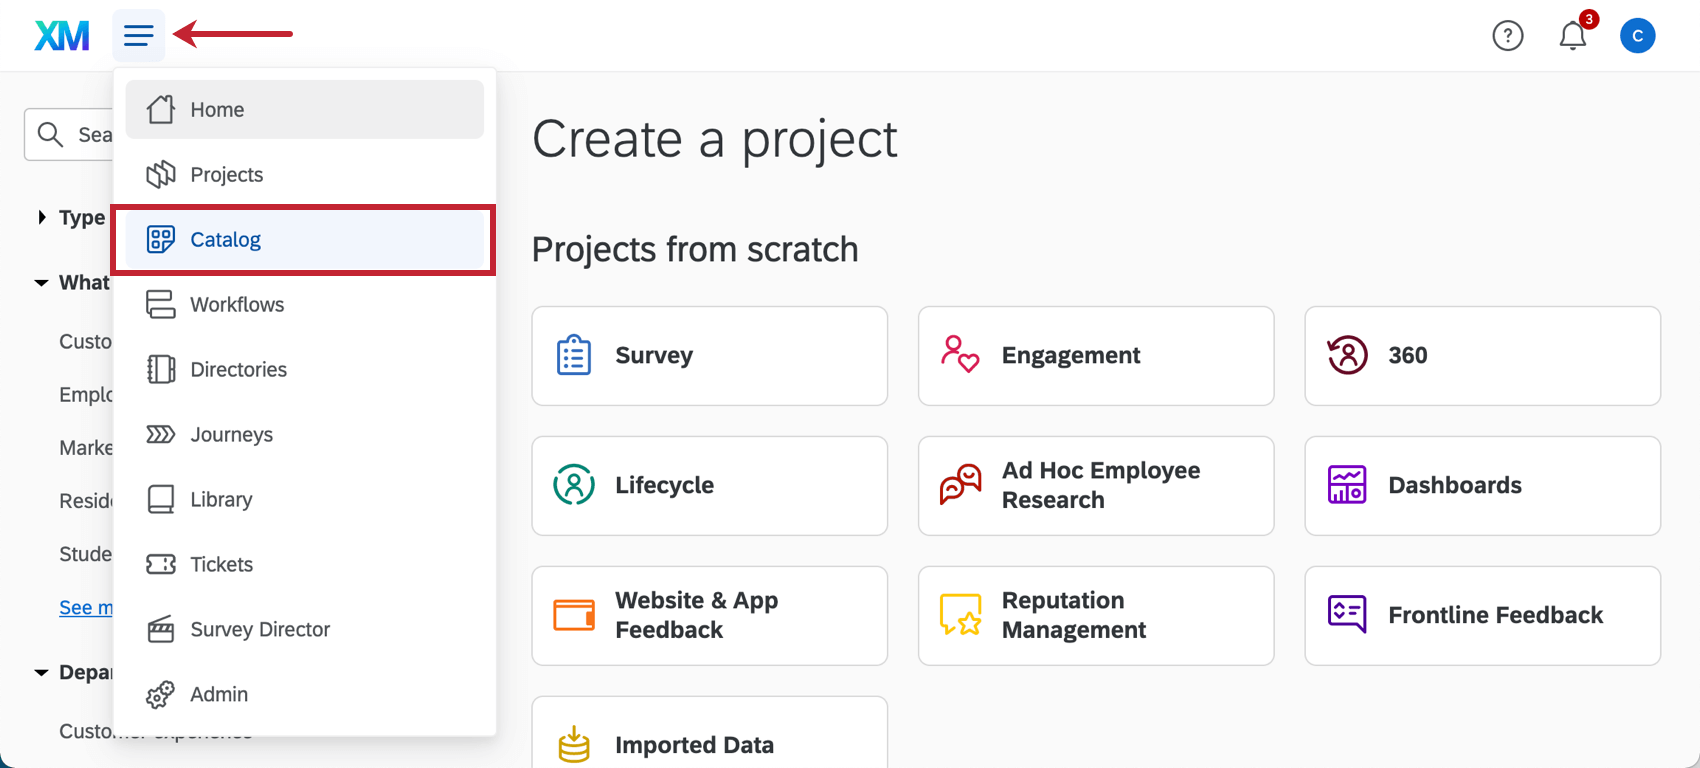
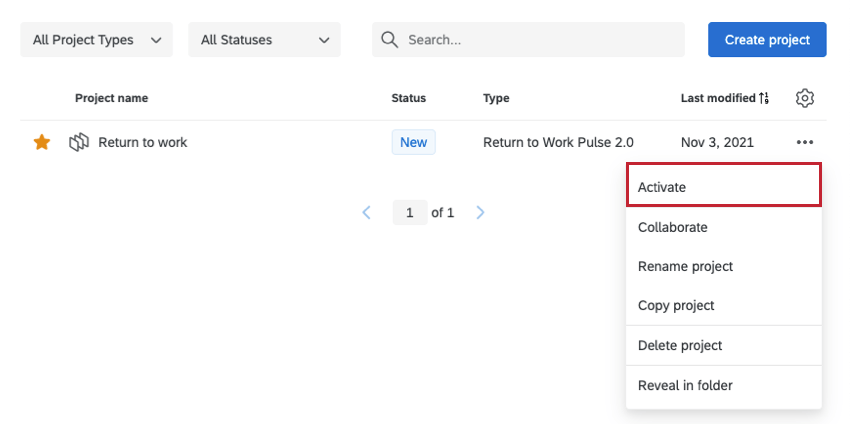
Qtip: A project can also be created from the Projects or Homepage.
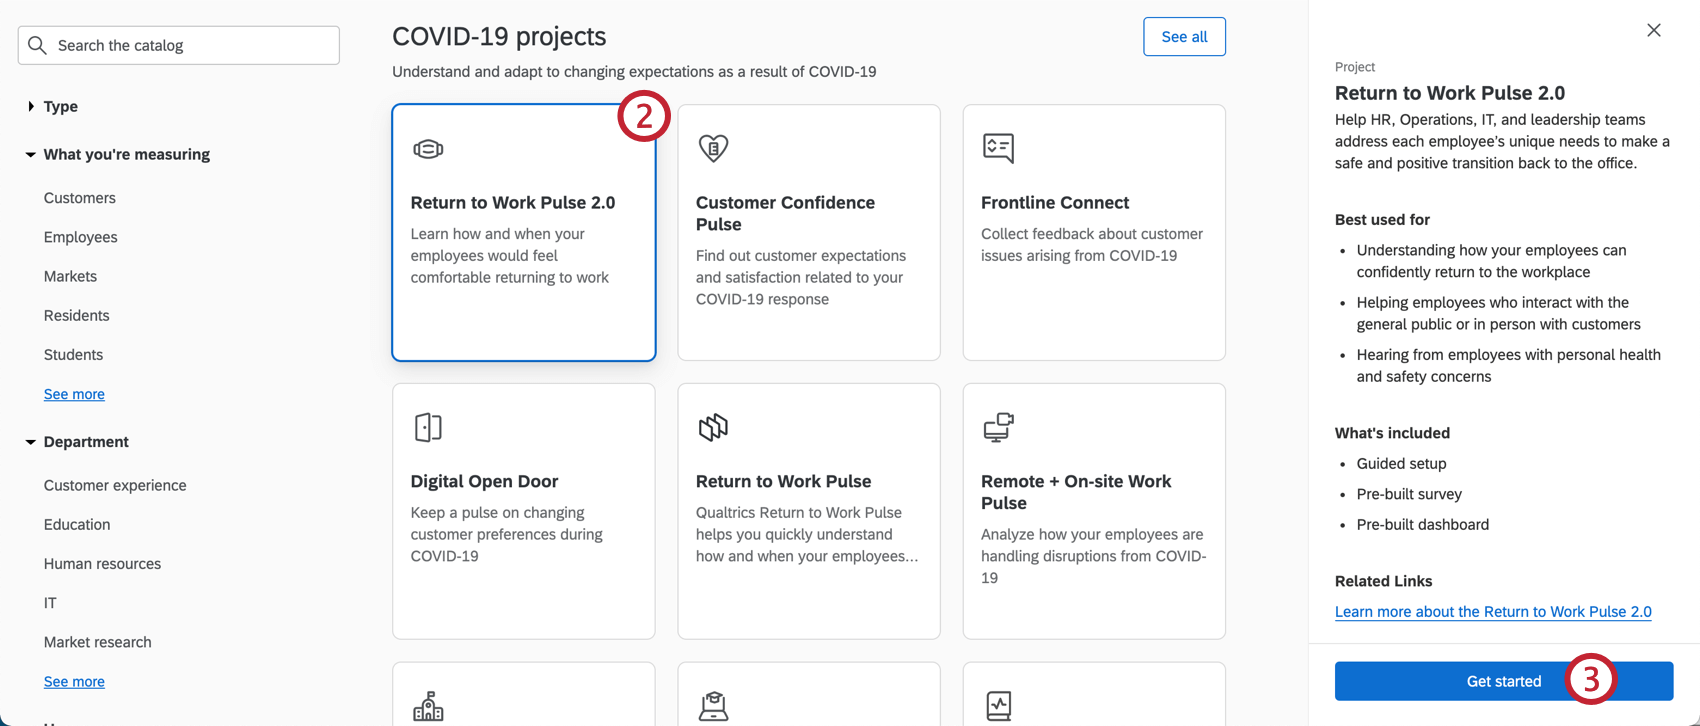
Qtip: You can also use the search in the catalog to find this project.
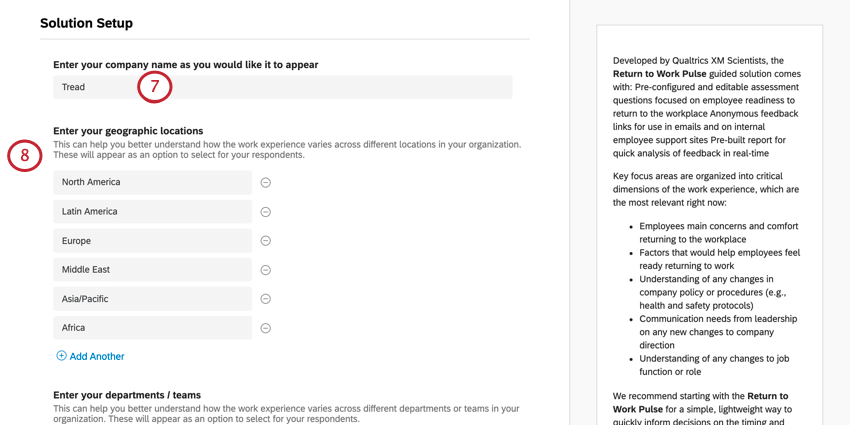
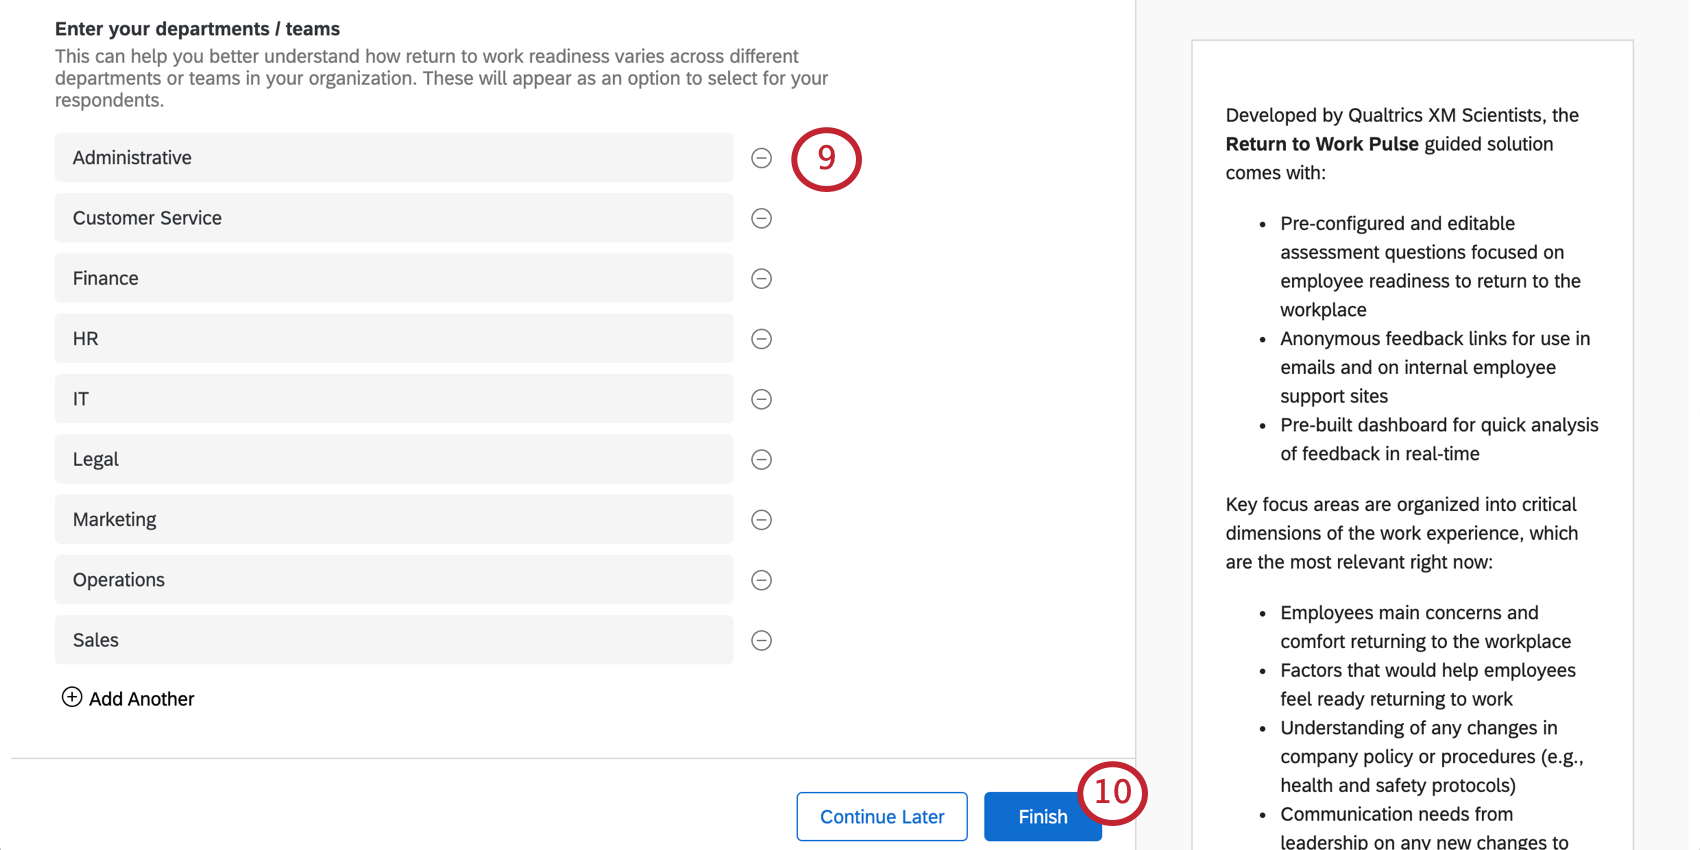
Qtip: These can be as general or as specific as you want (i.e., specific stores vs. regions of the world).
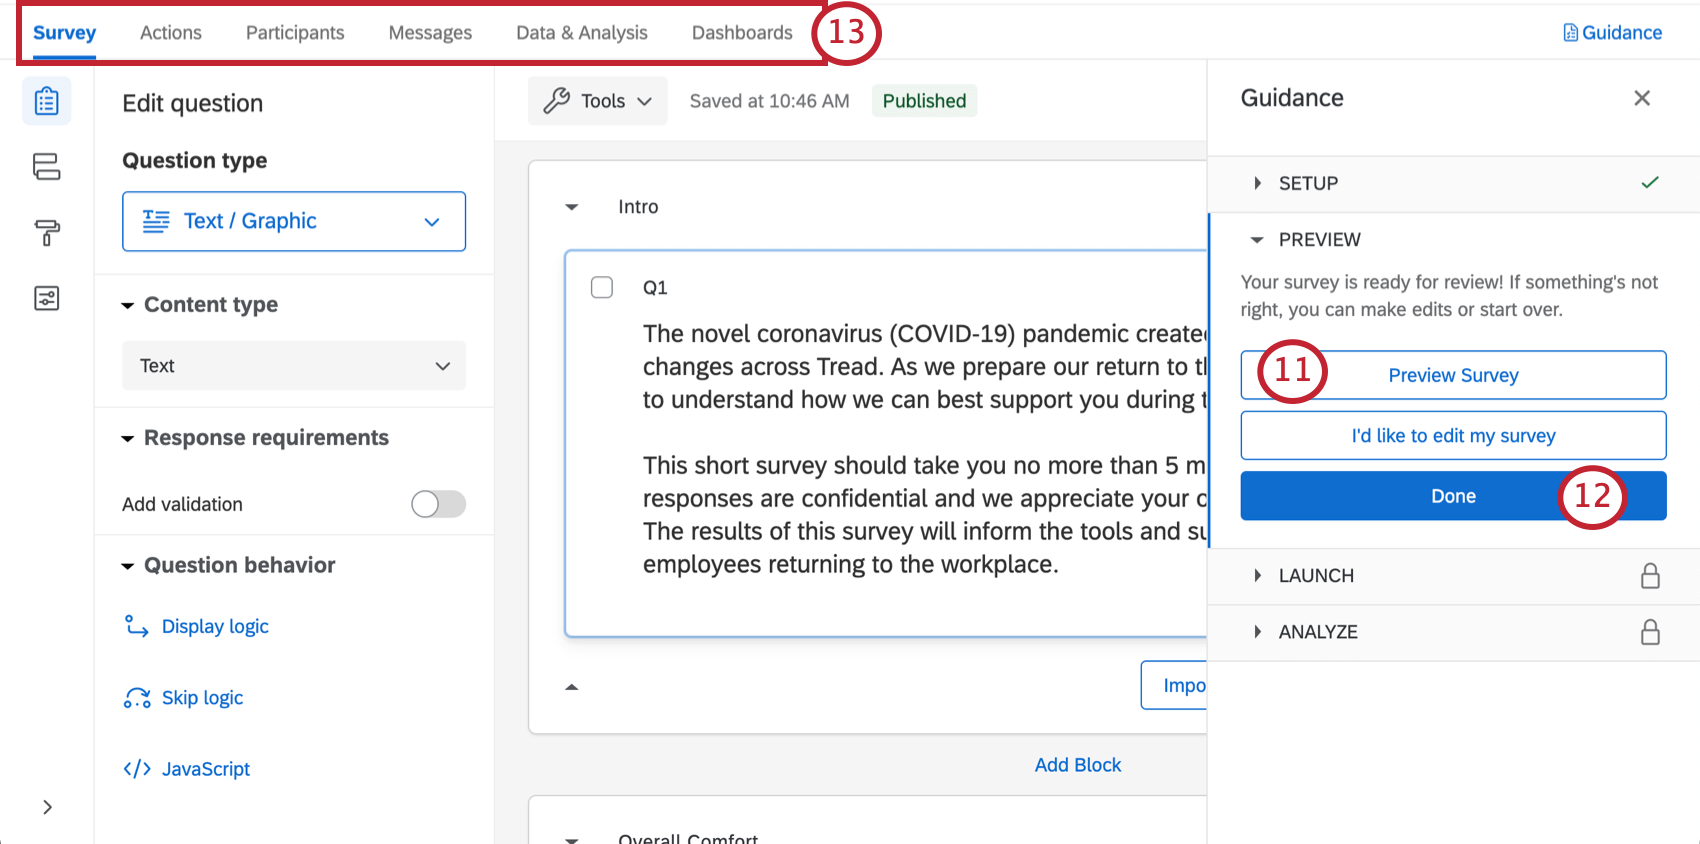
Qtip: Did your survey preview not appear? Make sure your browser doesn’t block pop-ups on Qualtrics.
Return to Work Pulse Survey Customization
If you want to see the questions in your survey or edit them, click the Survey tab. Once inside the survey builder, you can add new questions, tweak the wording on existing ones, edit the survey theme, and much more.
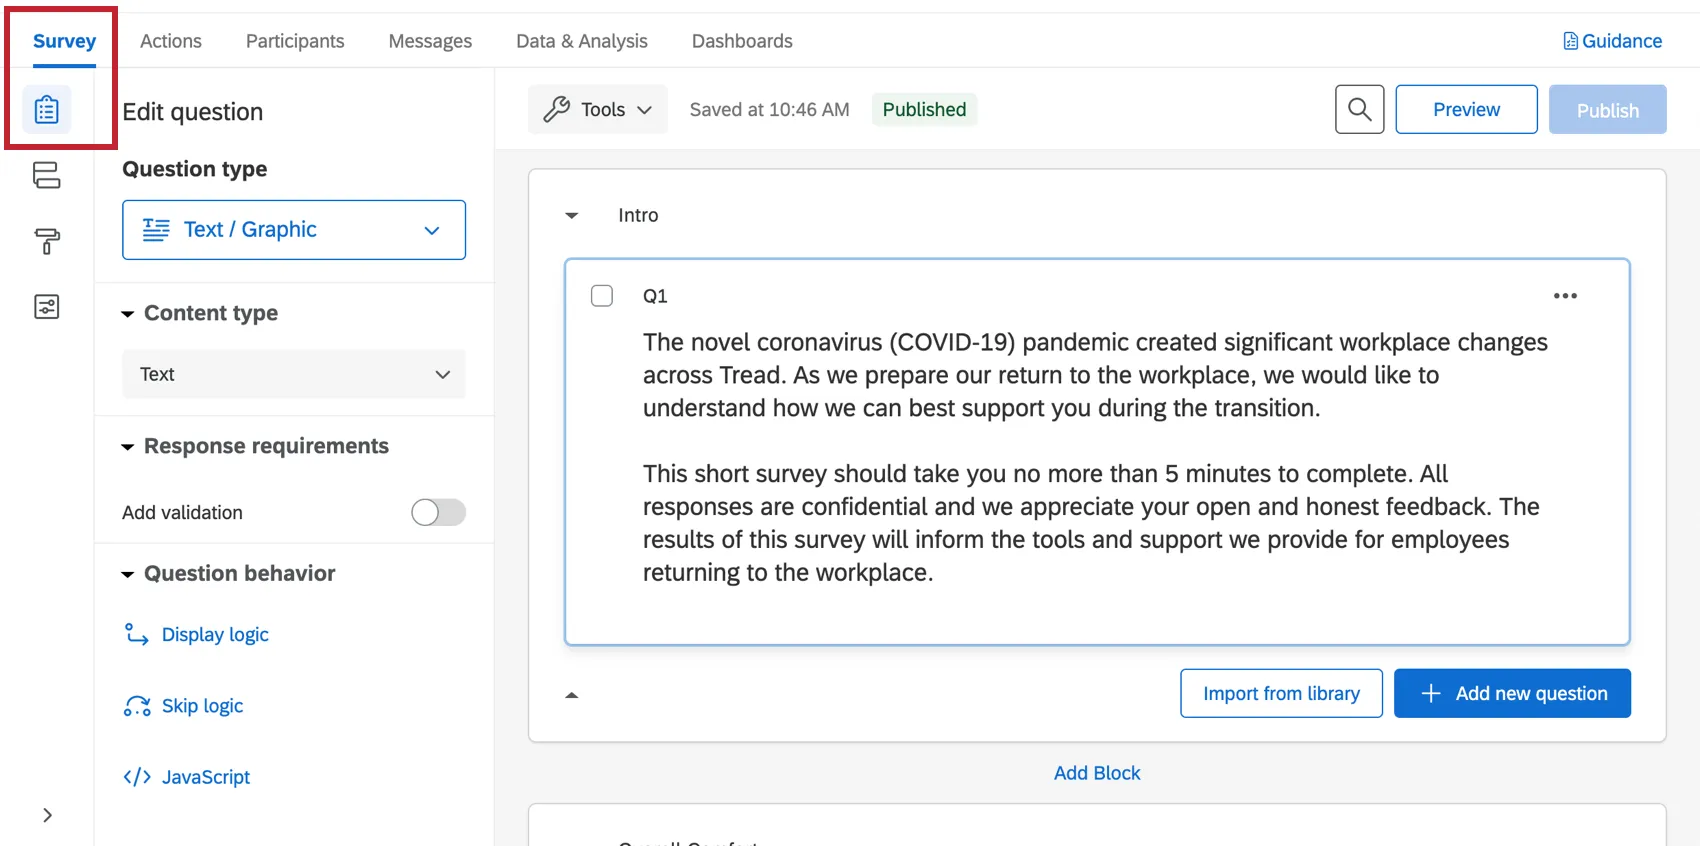
If there’s particular functionality you’d like to add, try searching the Support Site, or use the Support Site’s menu to the left to pick a page. In this section, we’ll cover some of the fundamentals of survey editing.
Qtip: The questions included in this survey were developed by our top subject matter experts. We advise trying to keep your survey as similar to the original template as possible, and not making too many large-scale changes.
Adding and Editing Questions
Warning: It’s important to make edits to the survey before you distribute it to recipients. If possible, avoid making edits to a survey actively collecting data, or you may risk invalidating your data and changing the premade reports that come with this solution. See Testing / Editing an Active Survey.
You can add as many additional questions as you want. However, keep in mind that the shorter the survey, the more likely recipients are to fill it out.
For guides to adding and editing questions, see:
Qtip: For surveys like these, we generally advise sticking to multiple choice and text entry questions.
Deleting and Restoring Questions
Warning: If you delete a question, it’ll affect the premade dashboard and the display logic included with this solution! Be prepared to fix all the display logic in your survey, and to either make edits to the dashboard’s data and widgets, or create a new dashboard from scratch. We generally advise you not to delete any questions!
If you have sent a question to the trash, it is possible to restore it. To roll back many changes at once, see also how to revert a survey back to a previous version.
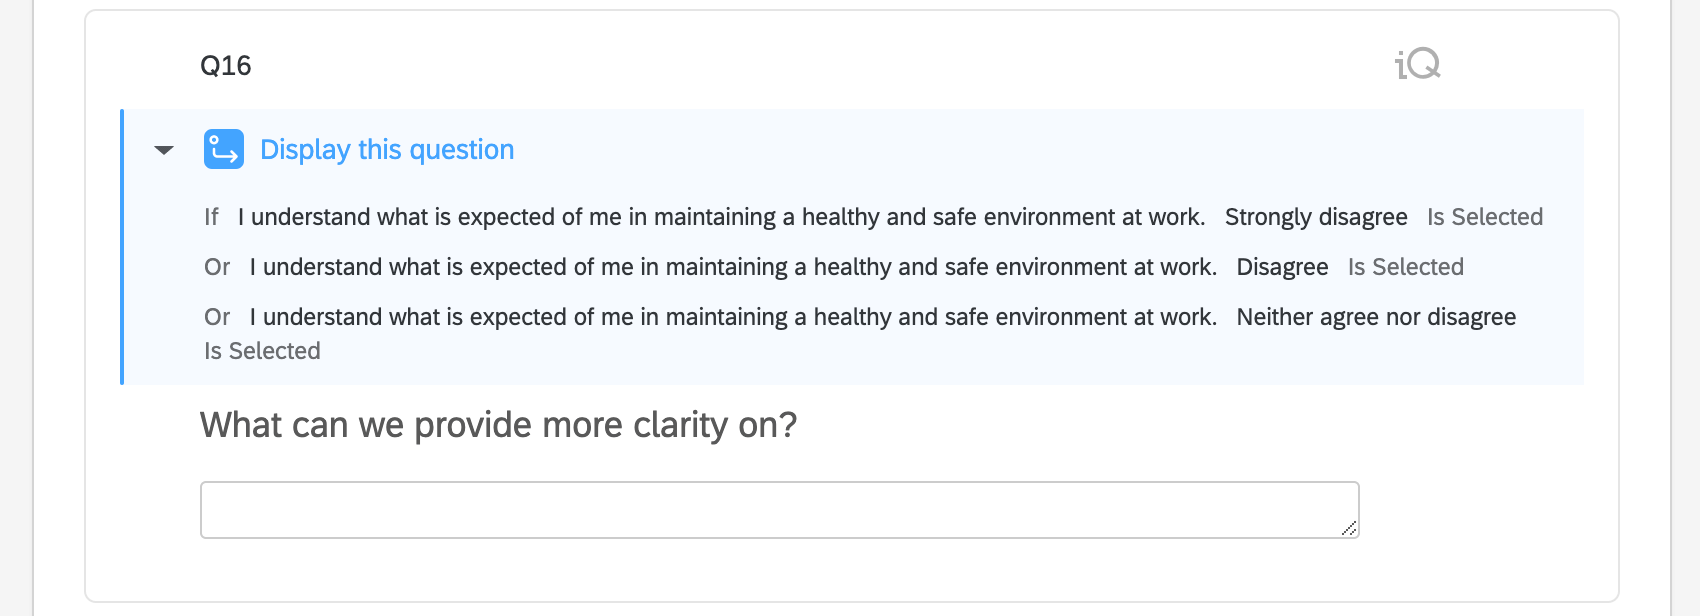
Display Logic
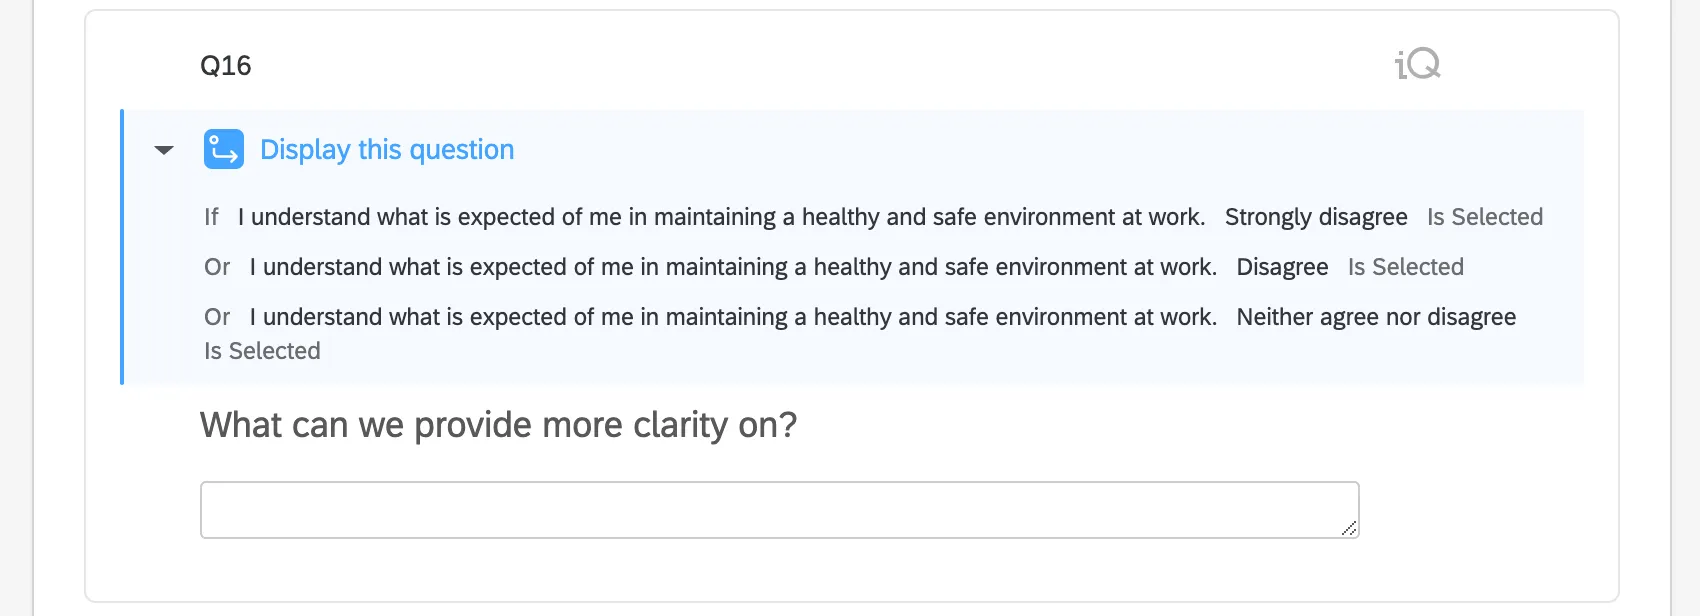
This solution comes with custom display logic. Display logic affects what questions respondents see, based on previous answers they provided. For example, if an employee indicates that they don’t understand what is expected in maintaining a healthy, safe environment at work, we can ask them to specify which instructions need clarification.
Warning: When you remove or edit a question, it can affect display logic on another question. Be sure to double-check your survey before making these edits!
Saving and Publishing
All edits you make are saved automatically; however, they won’t necessarily be pushed to the live version of the survey. When you are finished with all of your edits and are ready to generate a link and share the survey with your recipients, remember to click Publish in the upper-right.
For more on how this works, see Survey Publishing & Versions.
Distributing a Return to Work Pulse
Qtip: These projects do not have employee hierarchies.
Survey Link Distribution
We recommend distributing a single link, because it can be one of the fastest distribution methods. While it is anonymous by default, it can be modified to associate participant information with a response, which we’ll describe later in this section.
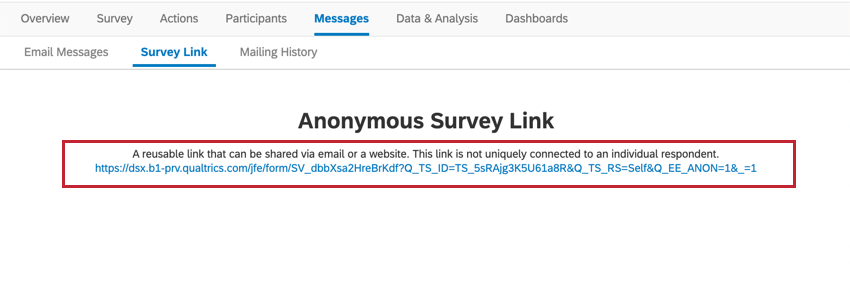
Qtip: Respondents can respond more than once using anonymous links, unless you add an authenticator.
Associating Anonymous Link Responses with Employees
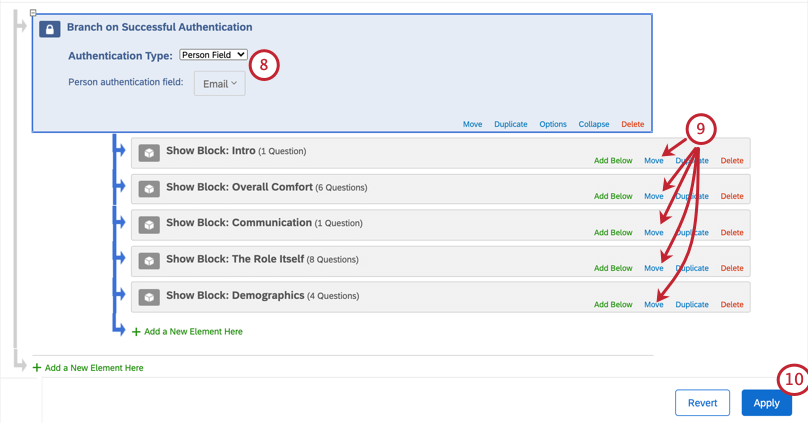
Just because you are distributing with the “anonymous link” doesn’t mean your data has to be anonymous. If you use an authenticator, you can link each response to a specific employee.
Authenticators require end-users to confirm their identity before they can take the survey. With this, you can capture employee information that is associated with their participant record within the ad hoc employee research project.
Qtip: When a survey has an authenticator, employees can only respond once.
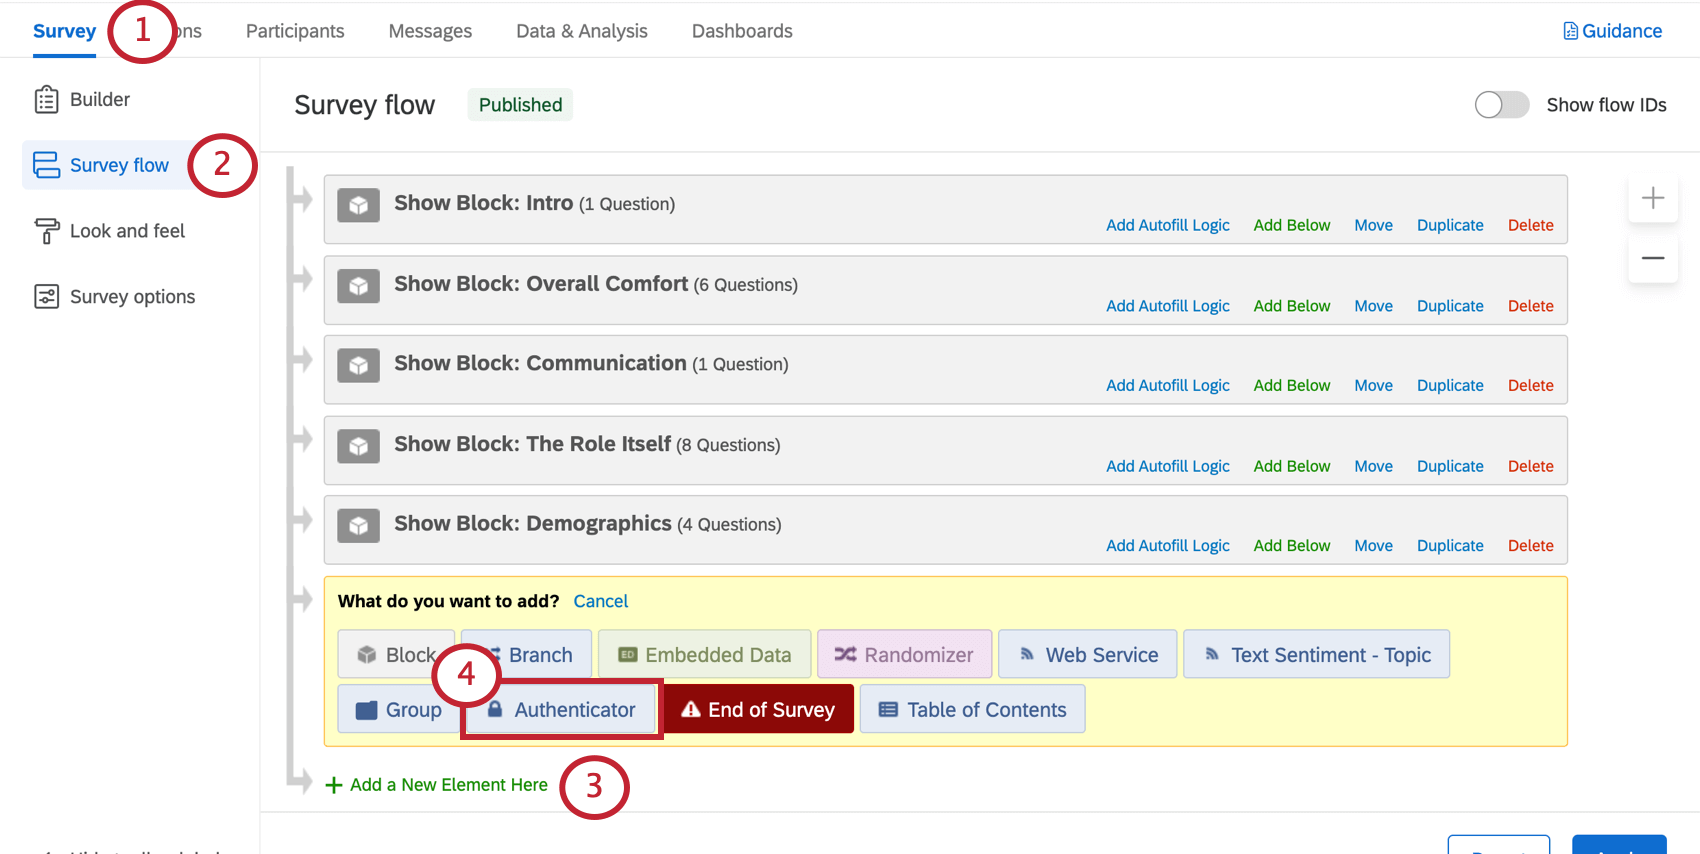
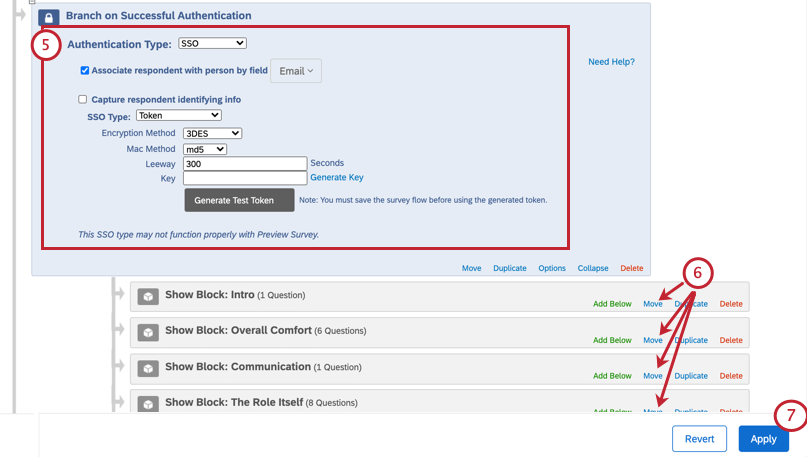
Authenticators for Brands with SSO
If your brand has SSO, all you need to do is add an authenticator to your ad hoc employee research project’s survey flow, and make sure it’s configured for SSO.
Authenticators for Brands without SSO
If you are using an authenticator in a brand without SSO enabled, you’ll need to upload participants before configuring your authenticator.
Qtip: Only pay attention to the fields described in the first section of this page, and any additional employee information (metadata) that would benefit you in this research. Do not worry about hierarchy fields, such as Manager ID or Level, unless this information would benefit this research.

Other Methods of Distribution
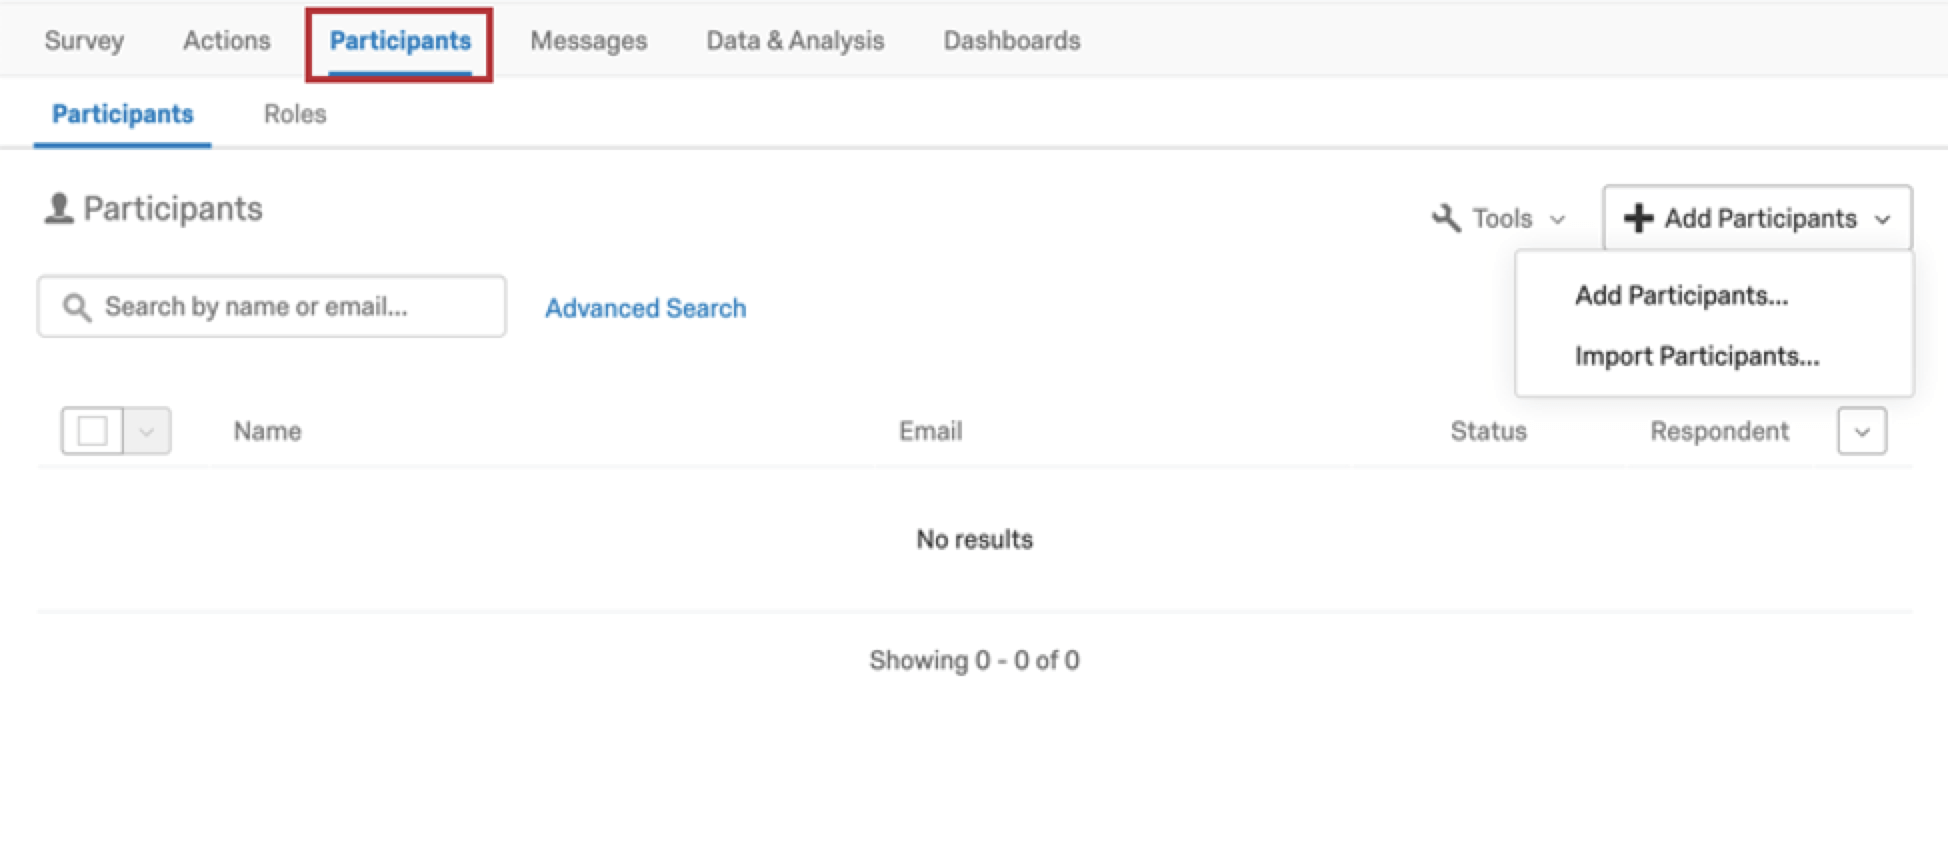
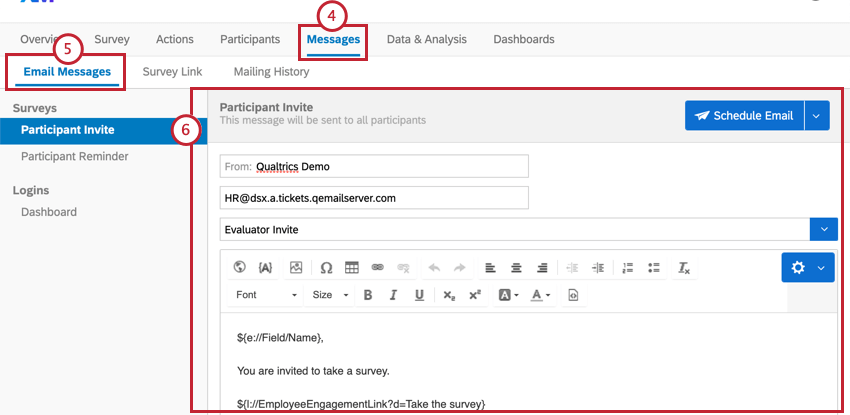
If you don’t want to use the anonymous link (with or without an authenticator), you can also upload a list of participants and send an email invitation to them.
Qtip: Only pay attention to the fields described in the first section of this page, and any additional employee information (metadata) that would benefit you in this research. Do not worry about hierarchy fields, such as Manager ID or Level, unless this information would benefit this research.
Dashboards
Premade Dashboards
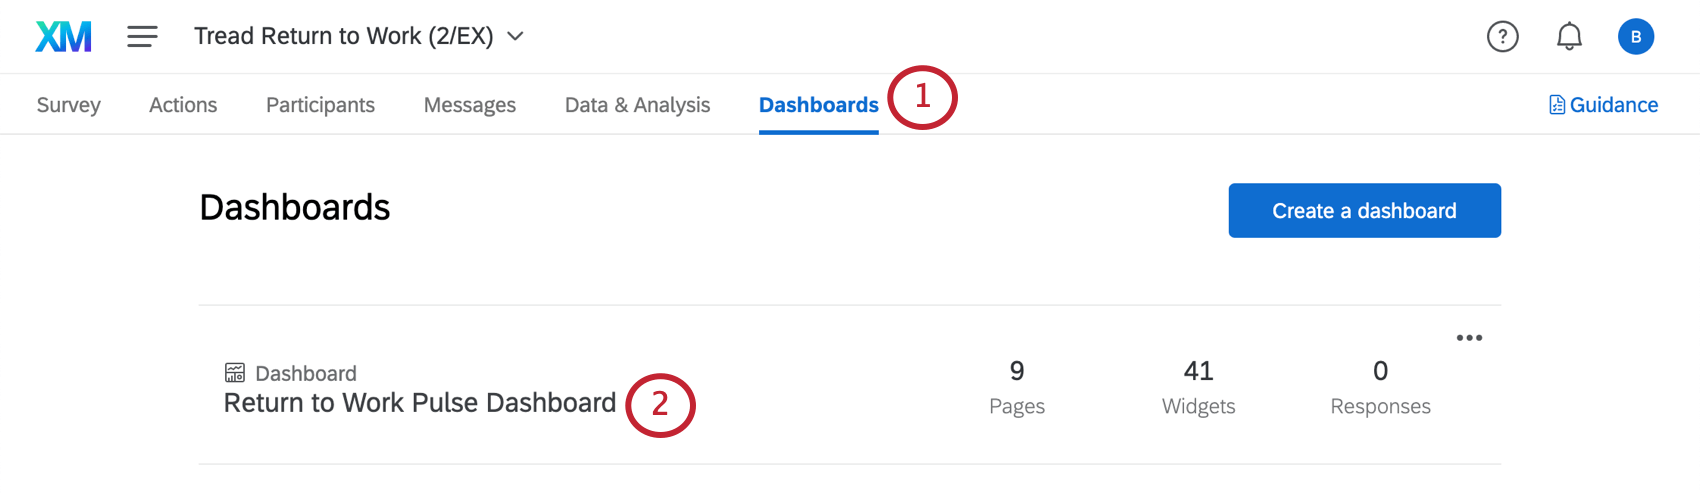
Our XM Scientists have developed a special dashboard for this XM Solution. This dashboard has multiple pages of insightful information, and is ready to share as soon as you have collected data.
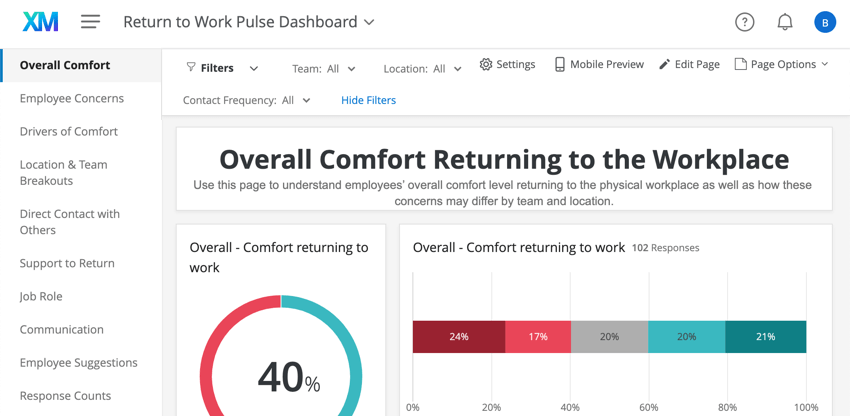
Qtip: This dashboard will not generate charts and tables until you collect data.
Qtip: Line charts may appear as a single point until you collect multiple weeks worth of data. This is because they are displaying trends over time, and don’t have enough data to display a trend yet.
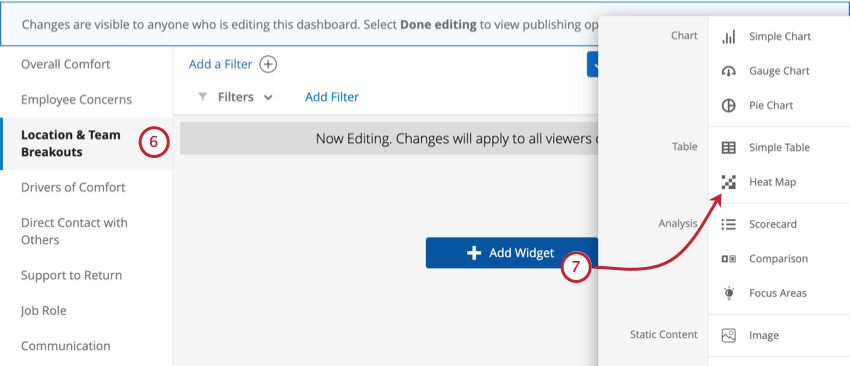
Adding Item Favorability by Location and Team to Your Dashboard
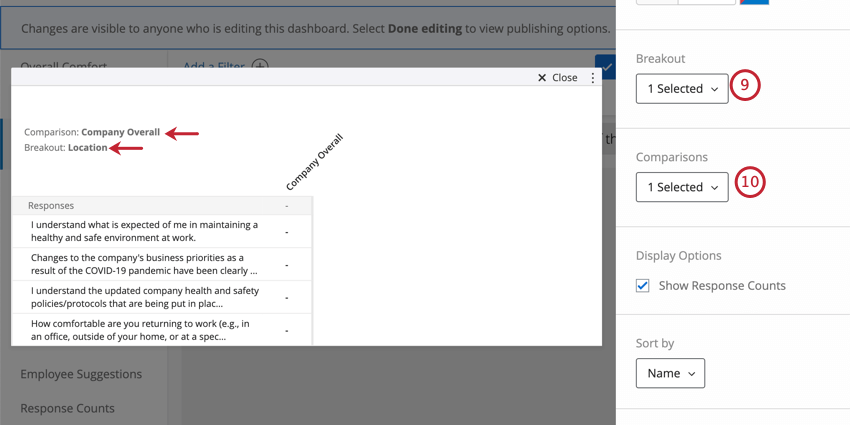
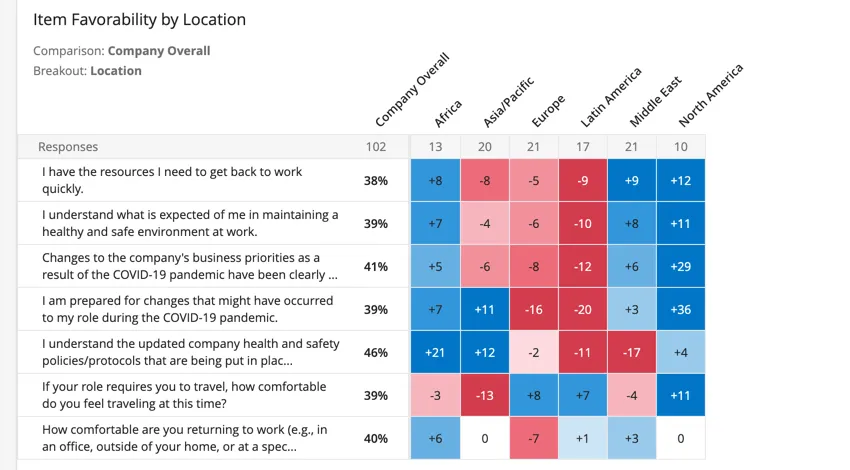
Heat map widgets provide an efficient way to quickly identify high points and low points across your organization or various demographic groups. These widgets are ideal for visualizing comparisons, such as the way your employees rated different items by location or team.
Qtip: You can compare responses across other demographics, not just location or team – however, we recommend adding the breakout we describe here to your dashboard.
Qtip: For more customization options related to the heat map, such as highlighting statistical significance, see the Heat Map Widget support page.
Dashboard Editing
Qtip: The pre-made dashboard was developed by our top subject matter experts. We advise trying to keep your dashboard as similar to the original template as possible, and not making too many large-scale changes.
Check out these introductory pages to get started.
- Reporting on your Employee Engagement Project Results
- Adding & Removing a Dashboard
- Dashboards Basic Overview
- Widgets Basic Overview Qtip: This page is a general introduction as well as some common settings. For customization options available to a specific widget, there is a support page for each kind of widget.

- Filtering Dashboards
- Dashboard Data
Warning: Do not delete the premade dashboard! If you do, this dashboard will not be retrievable, and you will have to make a new one from scratch.
Qtip: You cannot use action planning, hierarchies, or certain hierarchy-based role restrictions in these dashboards. Everything else functions the exact same way as they do in other EX projects.
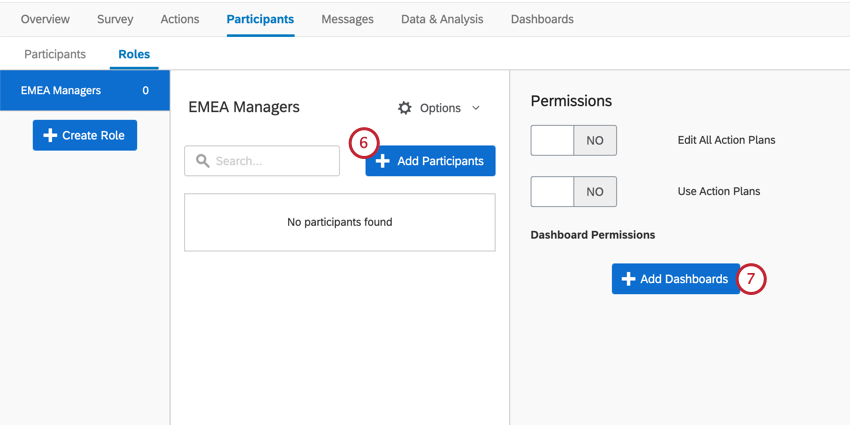
Dashboard Sharing
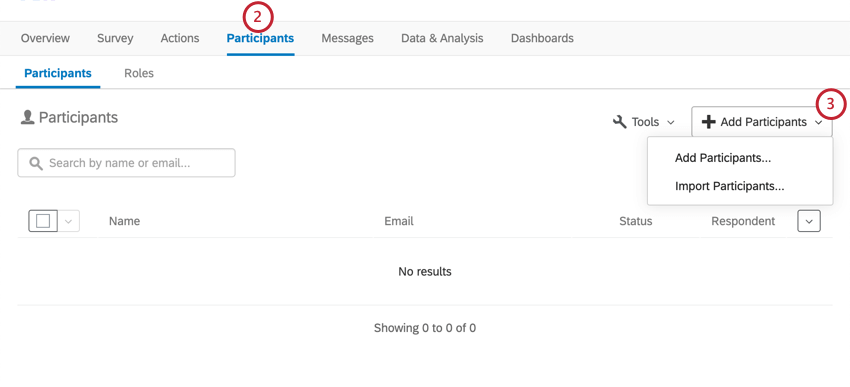
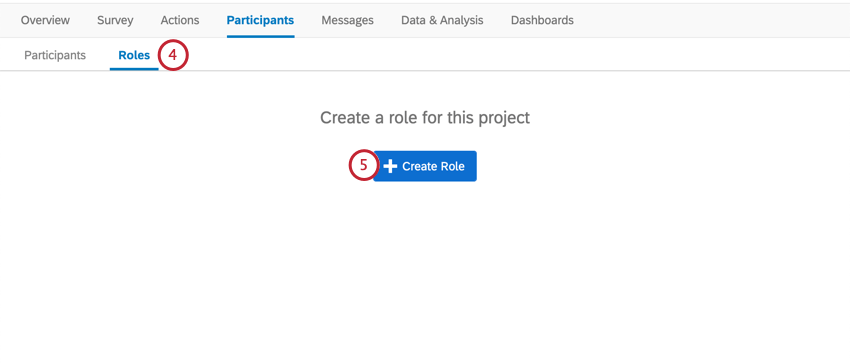
When you’re ready to share your dashboards, you’ll need to make sure anyone you want to share the dashboard with is added as a participant in the project. From there, you may want to create a role you can add dashboard users to. Although you cannot restrict data access by hierarchy in these roles, you can still make a role for everyone who should have editing or viewing access to the dashboard.
Qtip: Only pay attention to the fields described in the first section of this page, and any additional employee information (metadata) that would benefit you in this research. Do not worry about hierarchy fields, such as Manager ID or Level, unless this information would benefit this research.
Qtip: If you would like to restrict data access by Team or Location, make sure you include columns with this information for each participant. Ensure that the spelling of the teams and locations match what you entered when you first set up the survey.
Example: You may create roles for dashboard viewers vs. dashboard editors, one for each team’s managers, or one for each location’s managers’.
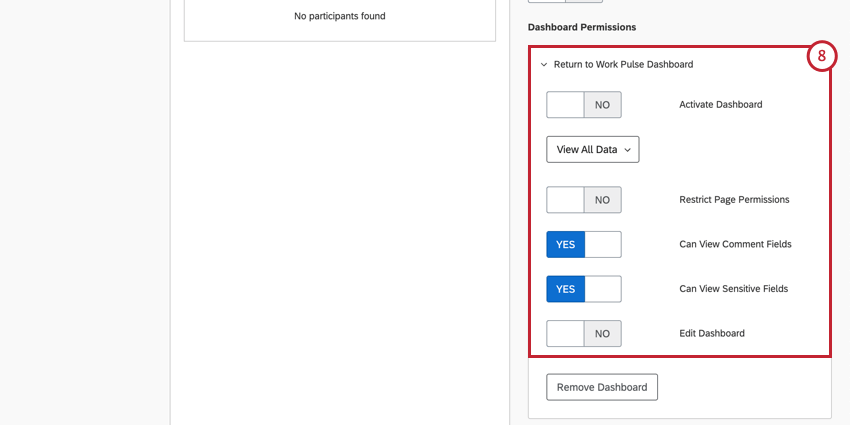
Qtip: Remember, you can also make participant-specific edits to dashboard permissions – roles are just much faster if you are working with large groups of participants who should have similar access.
Qtip: Ignore action planning permissions – these do not affect Return to Work Pulses.
- Org hierarchy settings will not be present.
- Action planning settings will not be present. Qtip: If you’re adding the same users to multiple roles, see how that can affect someone’s permissions.
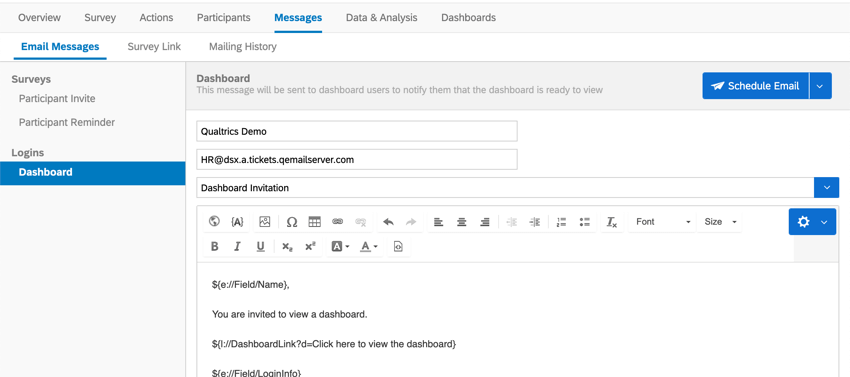
If your dashboard users need guidance on exporting, filtering, and navigating the dashboard, we have a page for Dashboard Viewers.
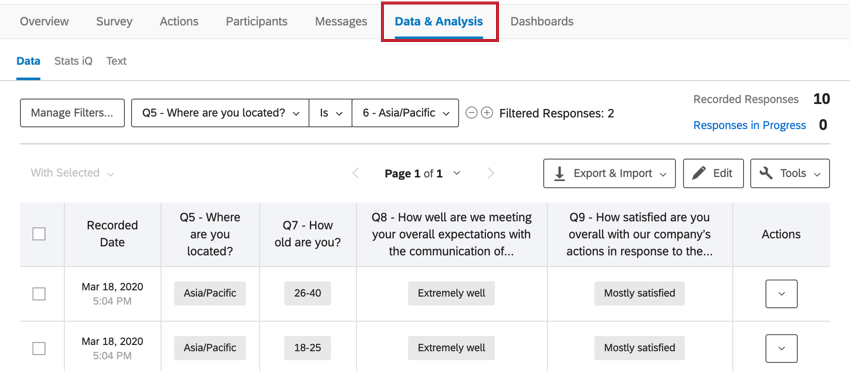
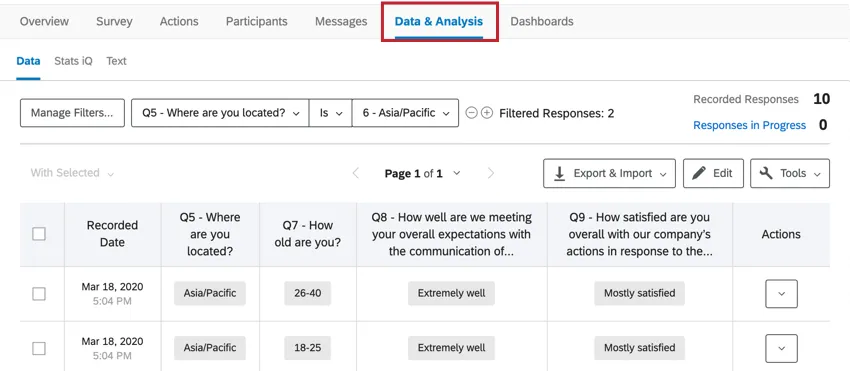
Other Ways to View Data
The Data & Analysis tab of your project allows you to edit data, export a spreadsheet of all responses, filter your responses, and much more.
Qtip: To preview a particular column of data, choose columns to display on Data & Analysis. You can export this data at any time.
Terms of Use: EX COVID-19 Solutions
Expiry Dates
These expiry dates only apply to customers who sign up from the “Here to Help” or “Return to Work” landing pages or via Qualtrics Surveys. Post expiration, these customers will need to export their data within 6 months or upgrade to a paid EX product.
Qtip: Existing customers will have access to the content for the life of their license with Qualtrics.
- Return to Work Pulse: The ability to launch new projects expires 30 days after the first Return to Work Pulse project has been launched AND has received a response.
- Remote + Onsite Work Pulse, Remote Educator Pulse, & Healthcare Workforce Pulse: The ability to launch new projects expires 90 days after the first project has been launched.
Response Limits
- Existing Qualtrics customers have 500k free responses associated with each Return to Work Pulse (for the first 30 days), Remote + Onsite Work Pulse(for the first 30 days), Remote Educator Pulse, and Healthcare Workforce Pulse COVID-19 solution (each for the first 90 days). After the 30 / 90 day periods are reached, responses will be counted against the total number of purchases response for the license.
- New customers who sign up from the “Here to Help” or “Return to Work” landing pages with a work email will get their own provisioned brand up to 500k responses total. This is only applicable to the Return to Work Pulse, Remote + Onsite Work Pulse, Remote Educator Pulse, and Healthcare Workforce Pulse solutions.
New customers who sign up from the “Here to Help” or “Return to Work” page with a personal email or indicate the account is for personal use will be provisioned a free account with up to 500 responses for each Return to Work Pulse, Remote + Onsite Work Pulse, Remote Educator Pulse, and Healthcare Workforce Pulse solution. This is also the case for new customers who sign up via Qualtrics Surveys.
FAQs
Is this COVID-19 XM Solution localized?
Is this COVID-19 XM Solution localized?
Although the guided setup cannot be translated at this time, you can upload translations to your survey or auto-translate using Google Translate as needed.
See the specific support page for each COVID-19 XM Solution for questions related to each solution's localization.
What will happen if I redo the setup assistant on my XM Solution?
What will happen if I redo the setup assistant on my XM Solution?
If you want to start the setup assistant over, do the following: Please note that if you want to start over from scratch, you can also create a new XM Solution instead.
Are there any premade text topics for analyzing my text responses about COVID-19?
Are there any premade text topics for analyzing my text responses about COVID-19?
Is this solution HIPAA compliant?
Is this solution HIPAA compliant?
If you have specific questions or concerns, we encourage you to seek your own legal advice about what additional steps, if any, you need to take to comply with applicable privacy laws or company policies. We have included suggested consent statements in these materials but you will need to confirm whether these statements are adequate or need to be modified to meet your specific needs.
That's great! Thank you for your feedback!
Thank you for your feedback!