
Record Grid Widget (CX)
What's on this page
About Record Grid Widgets
Warning: This widget is being deprecated and is no longer supported. For the same functionality with a more flexible setup, use the record table.
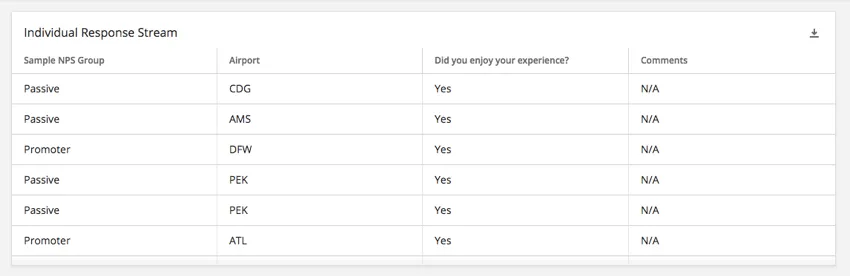
The record grid widget displays data from individual responses in a table where the data that is displayed for each response is set as columns and each row is an individual response. This widget can be used to quickly compare how individuals responded to different parts of the survey, including information not easily displayed in other widgets, such as individual comments.
Field Type Compatibility
The record grid widget is compatible with the following field types:
- Numeric Value
- Number Set
- Date
- Text Value
- Text Set
- Multi-Answer Text Set
- Open Text
- Drill Down
Only fields with the above type will be available when selecting the columns for the record grid widget.
Qtip: When exporting your record grid widget to CSV or TSV, the column headers will export as the field names in the Dashboard Data, not as the column names appear in the widget.
Widget Customization
For basic widget instructions and customization, visit the Building Widgets support page. Continue reading for record grid-specific customization.
Basic Setup
Add columns to your record grid widget to start displaying data. You can add as many columns as you want.
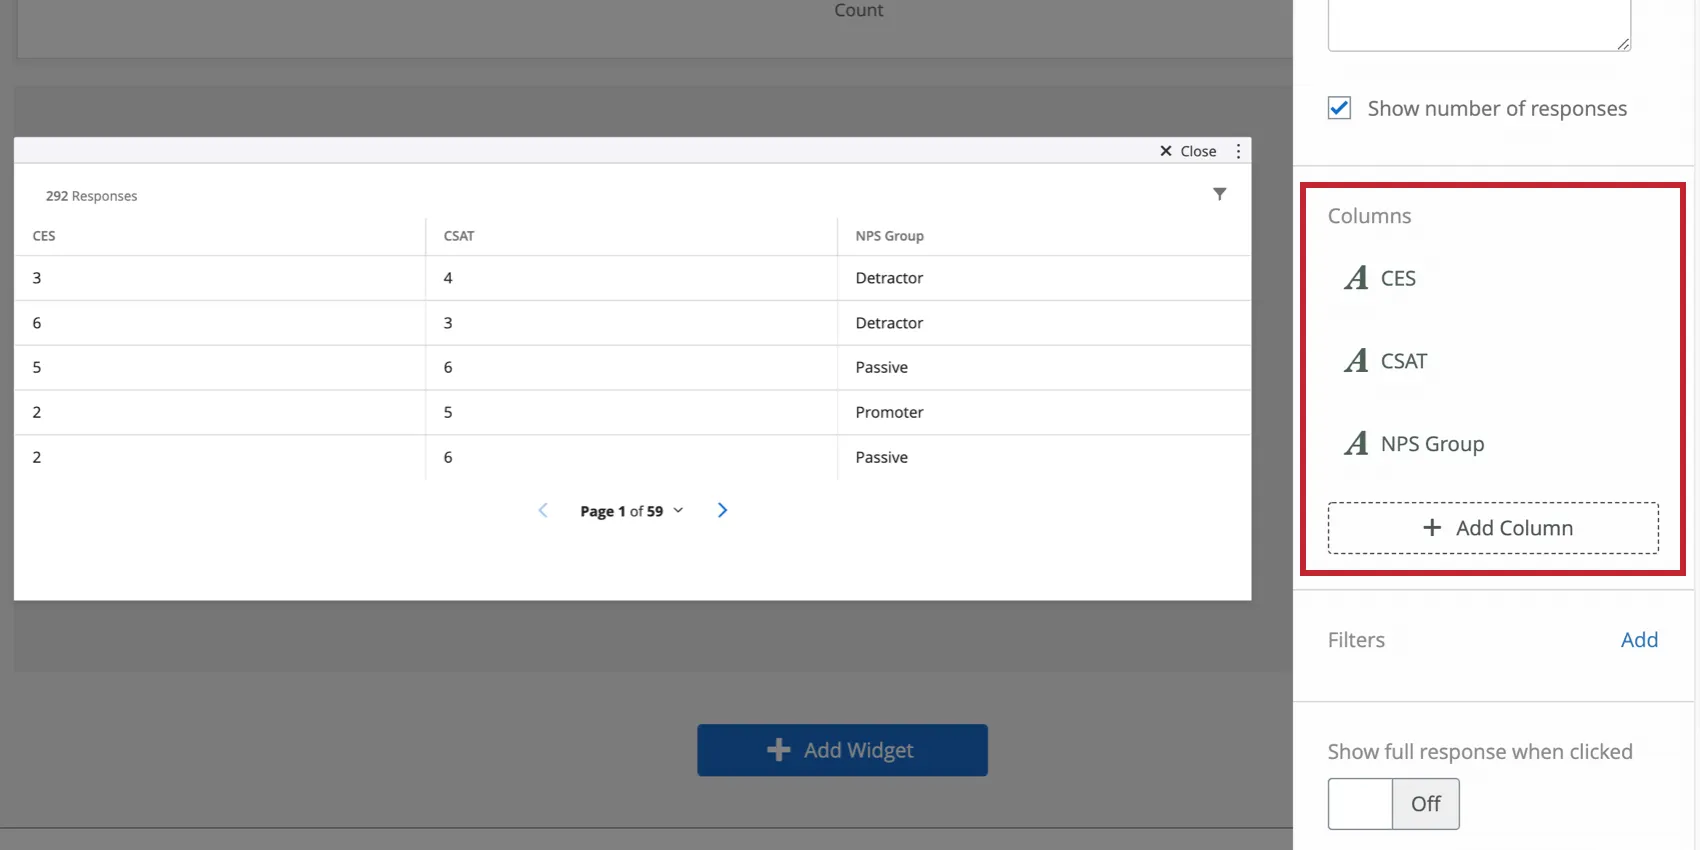
Qtip: Make sure you don’t add too many columns – this widget doesn’t scroll sideways, so columns get thinner as they are added, which can break up text.
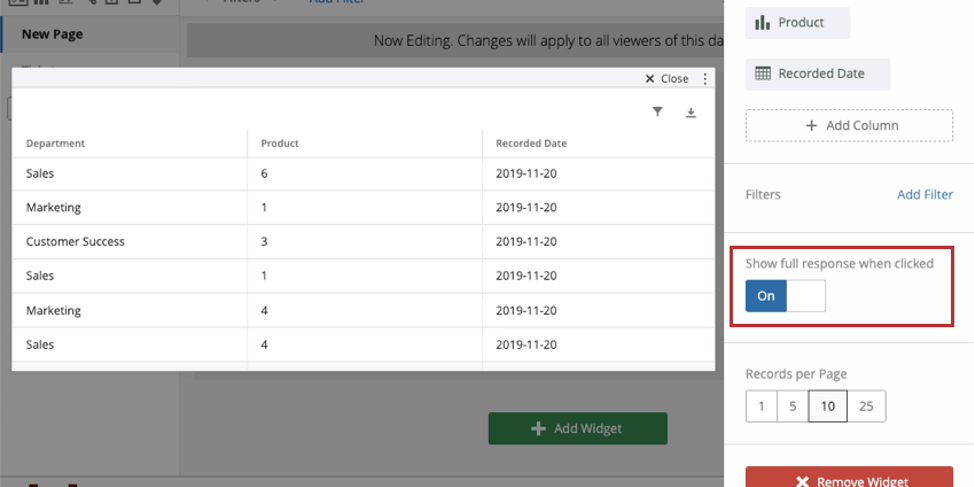
Show full response when clicked
See Enabling the Full Response Records.
Records per Page
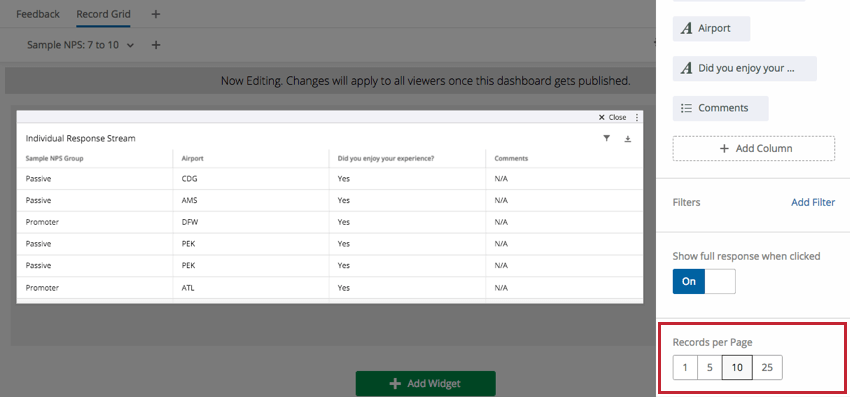
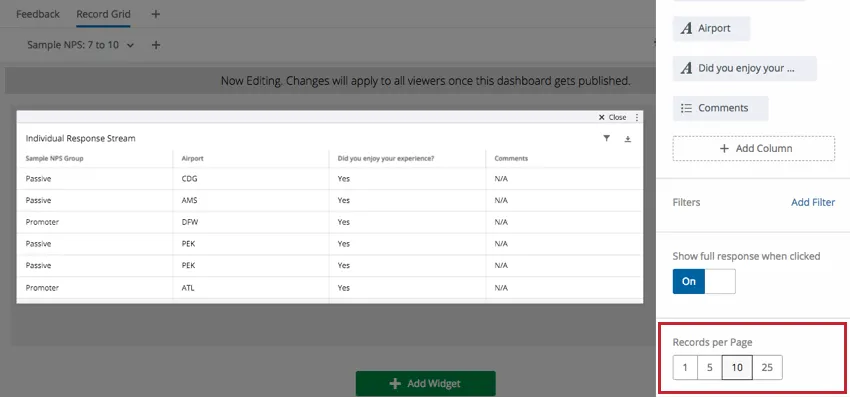
By default, 10 records (responses) will display per page on the record grid widget. This can be changed to 1, 5, or 25 in this section.
Enabling the Full Response Records
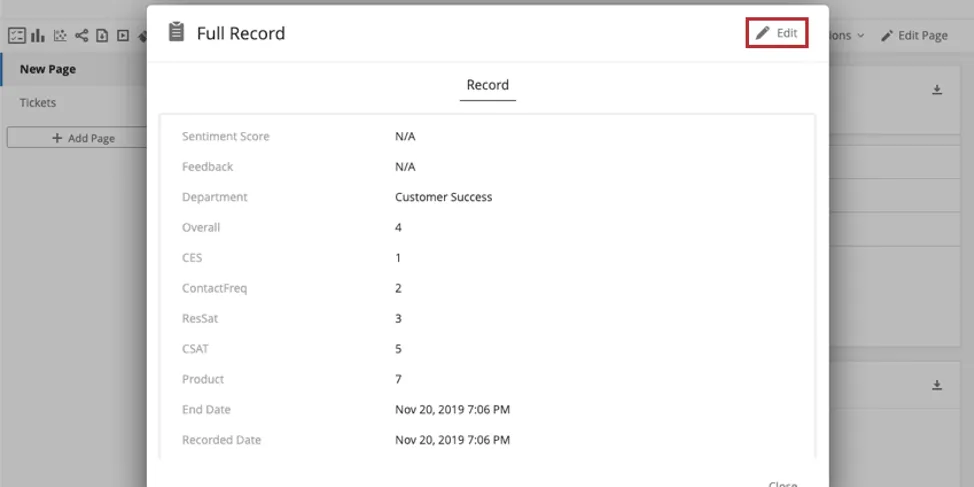
You can make it so that when someone in your dashboard clicks a widget, they can view a detailed record of the response, related tickets, action those tickets, and then email the client from the ticket. This seamless integration prevents your dashboard users from having to navigate between their tickets and the dashboard.
To enable this feature, select Show full response when clicked.

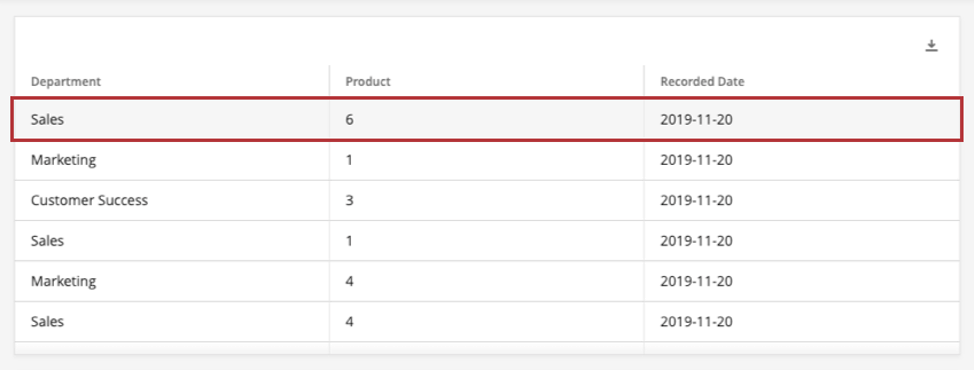
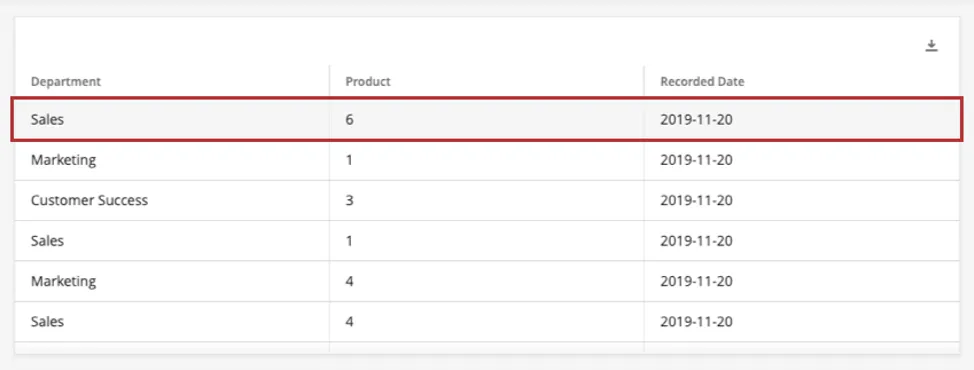
After this setting is enabled, all your dashboard users have to do is click anywhere on a row of the widget to expand that row’s response record. Make sure the dashboard is not in editing mode when you try this.
Qtip: If a dashboard user does not have access to all the fields within the record, they will see an error when trying to expand a row’s response record.
Qtip: When using ticket reporting, this option will not be available.
Making Edits to the Record
Qtip: Only dashboard administrators can edit the record.
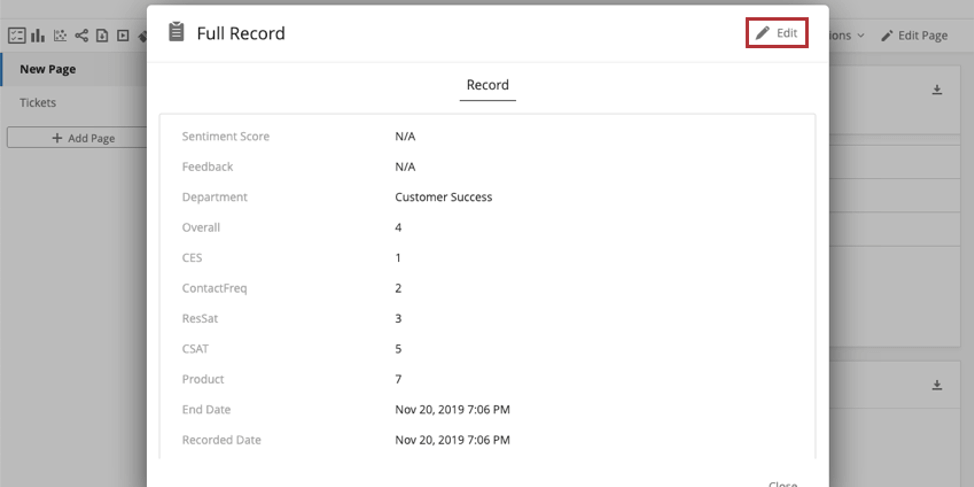
Customize how the response record appears when your users view it. Open any response record and then click Edit in the upper-right.
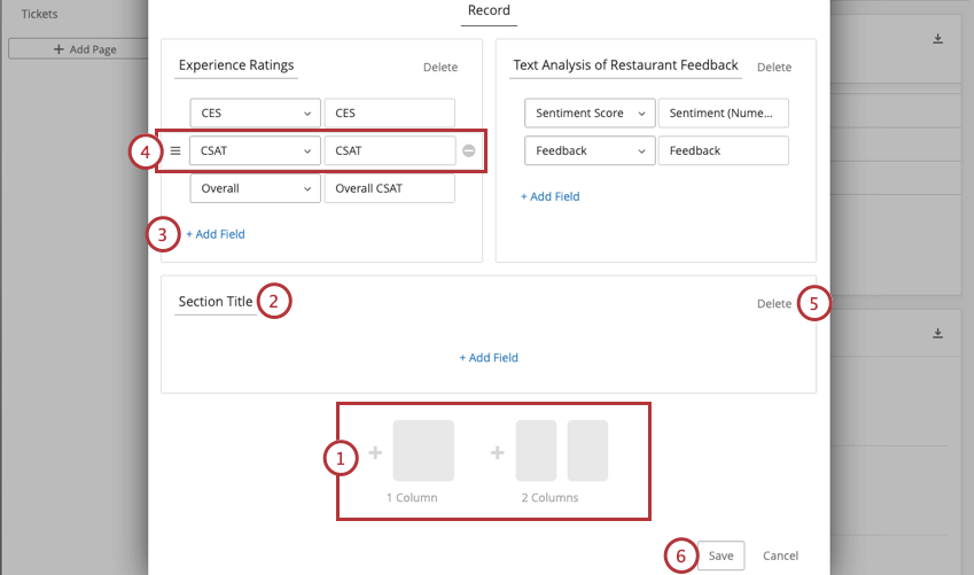
Qtip: The fields available in records are pulled from the Dashboard Data. When selecting fields, you will see every field mapped in your dashboard, not just a list of specific survey fields. If you want to report on a particular field, make sure it is mapped to the dashboard.
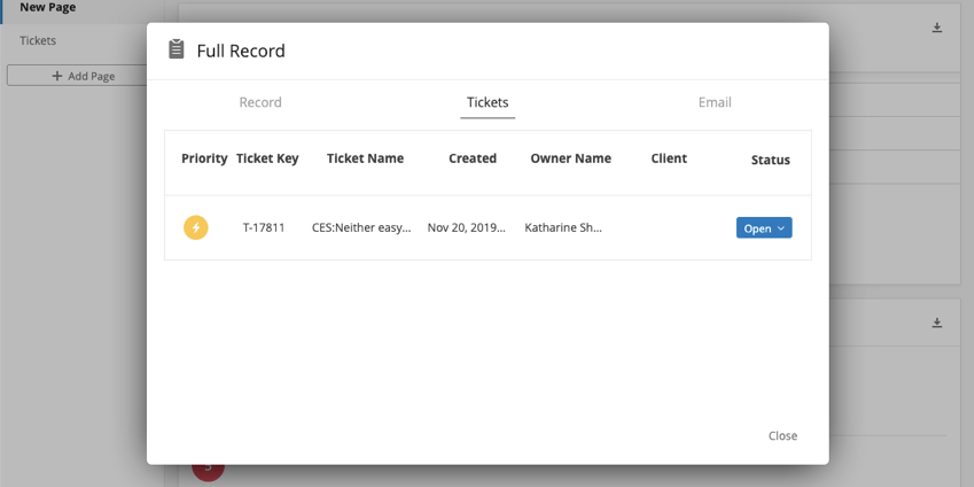
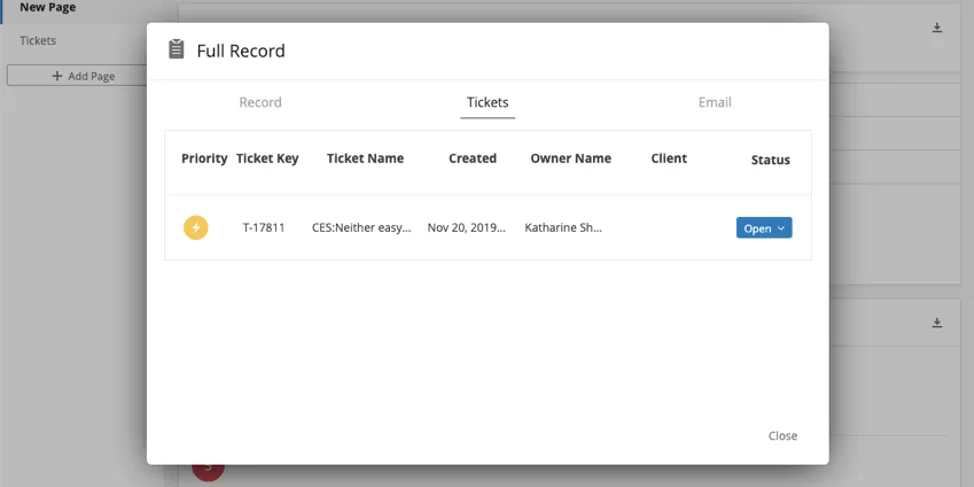
Tickets Tab
In the Tickets tab, dashboard users can perform all the same functions they do on the tickets page. The only difference is that this tab is filtered to only show tickets assigned to the user that were generated by this survey response.
Functions include:
- Expanding and Collapsing Tickets
- Changing the Ticket Status
- Assigning Tickets to Users or Teams
- Assigning Priority
- Root Cause
- Ticket Summaries
- Ticket Data
- Activity
- Deleting Tickets (Brand Admins only)
Email Tab
In the emails tab, you can perform the same email functions you normally would on the ticket.
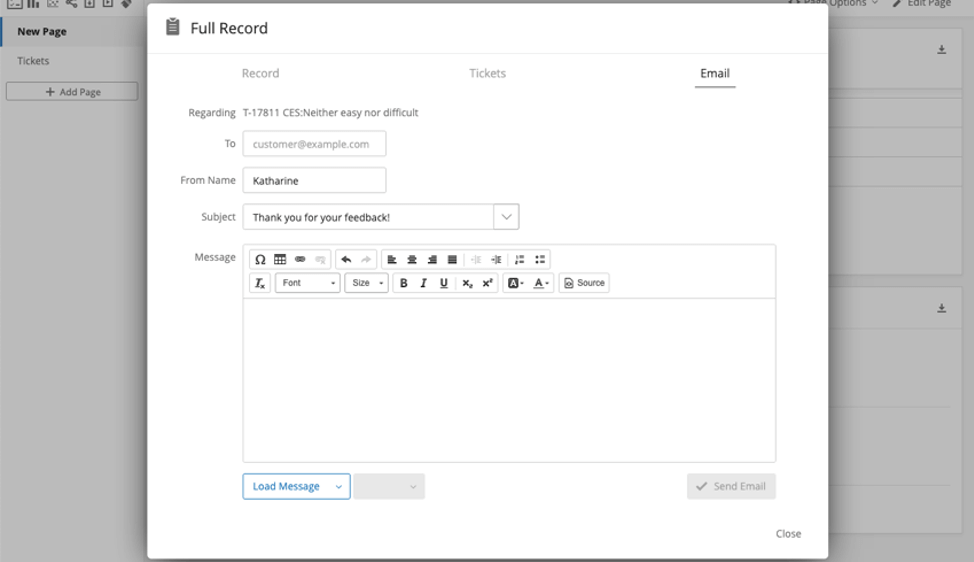
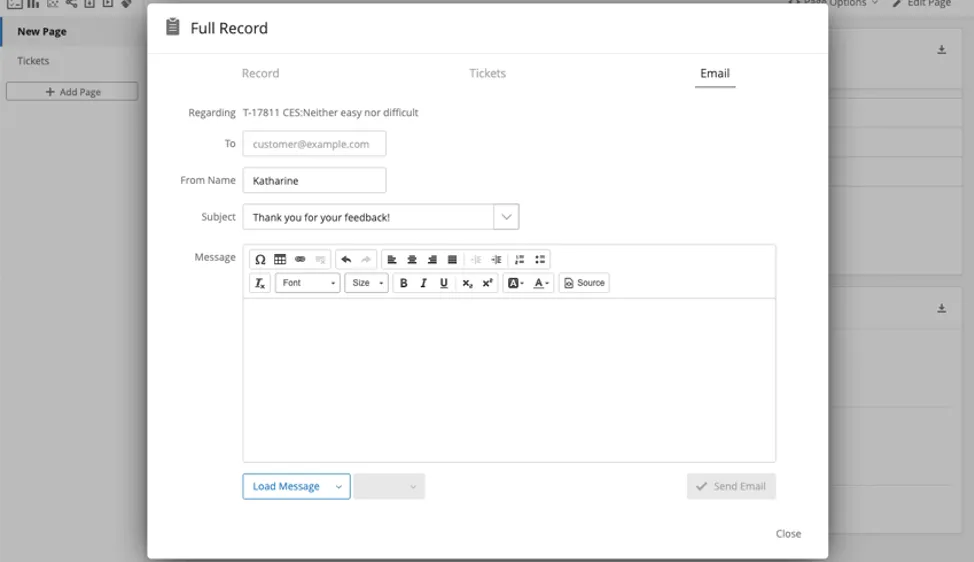
See Follow Up Emails on the ticket support page for more information.
Qtip: If your brand has a custom from address, then this email will be sent from that address. If your brand does not have a custom from address, then this email will be sent from noreply@qemailserver.com.
That's great! Thank you for your feedback!
Thank you for your feedback!