-

Qualtrics Platform -

Customer Journey Optimizer -

XM Discover -

Qualtrics Social Connect
Advanced-Reports Basic Overview
About Advanced-Reports
The end goal of Advanced-Reports is to create informative online and printed reports to share with your stakeholders.
Advanced-Reports provide the layout tools you’ll need to design:
- Page Layouts: Collections of visualizations with accompanying headers, themes, color schemes, margins, and fonts.
- Visualizations: Individual charts, images, graphs, text areas, or tables pulled from your dataset.
- Filters: Logic to include or exclude data from your visualizations and reports.
Creating an Advanced-Report
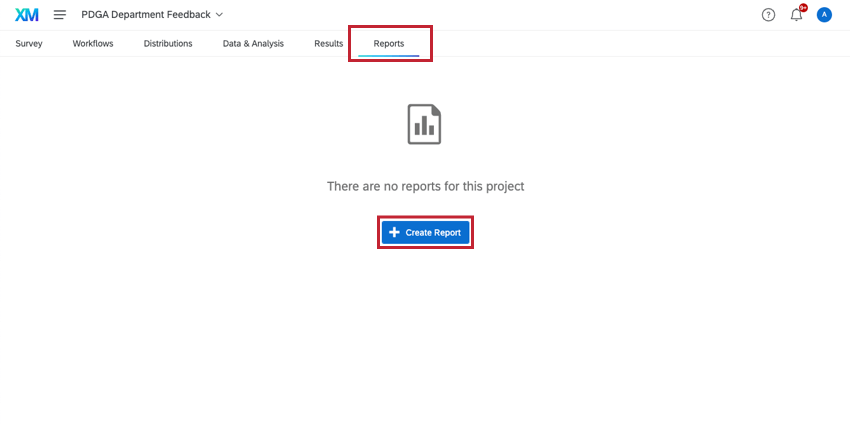
To start an initial advanced-report:
- Select the Reports tab.
- Choose Create a report.
You must select between three options (New Report, From Results Report, or From QRF):
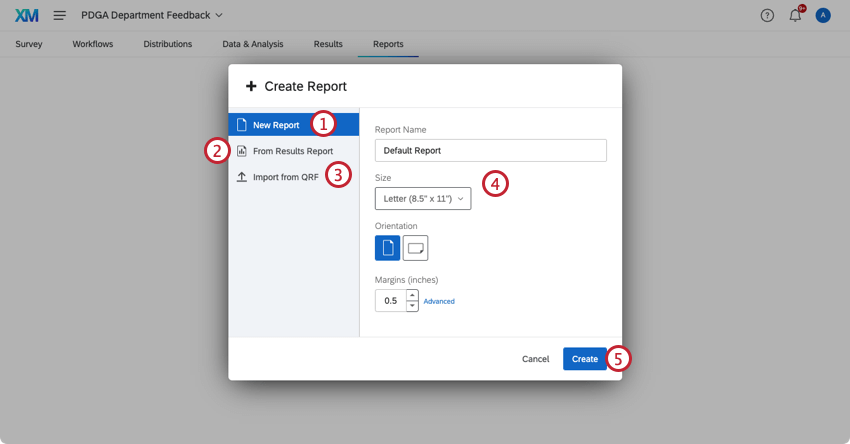
- New Report: Start a blank, new report from scratch.
- From Results Report: Begin with a previously saved Results-Report.
Qtip: This is an option for users with the old version of Reports. Read the Results-Reports Basic Overview for details. This option is not compatible with the new version of Results. Read the Results Dashboard for more information.
- Import from QRF: Import a Qualtrics Report File (QRF) from a previously made report to carry over all settings and visualizations. See Creating an Advanced-Report from QRF for more information.
- Name the report and verify its initial page layout settings (e.g., Page Size, Orientation, and Margins).
- Click Create to continue.
Qtip: Don’t stress over your initial settings. You can easily change them later in the Page section of your Global Settings.
The Page Layout Toolbar
After the initial set up, your layout tools will be accessible from the Advanced-Reports toolbar. From this toolbar you can:
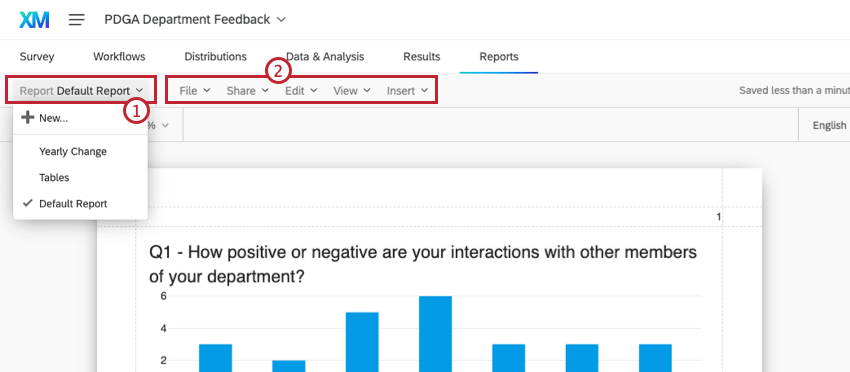
- Switch between multiple reports or begin a New one from the Report dropdown menu. (The active report is indicated by a checkmark.)
- Use the File, Edit, View, and Insert menus to make increasingly granular changes to your layouts.
Qtip: Review all the features in each menu option in the Advanced-Reports Toolbar page.
Creating an Advanced-Report from QRF
- In a report that you’ve already built, click File.
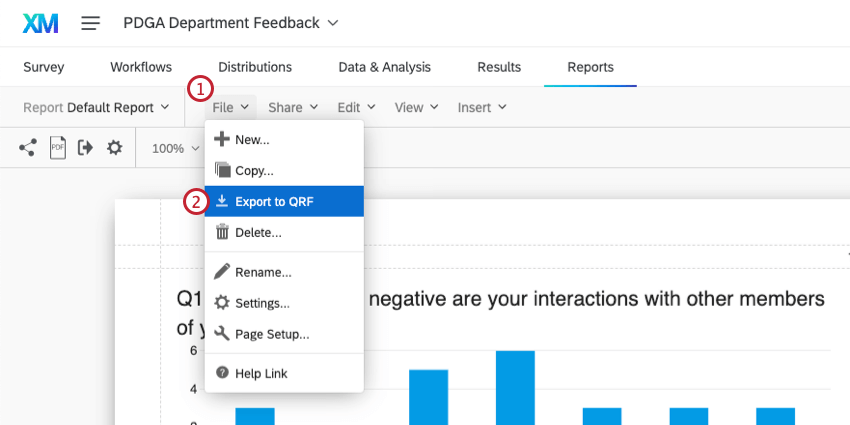
- Choose Export to QRF.
- Create a new report. This doesn’t have to be in the same project as the original report.
- Select Import from QRF.
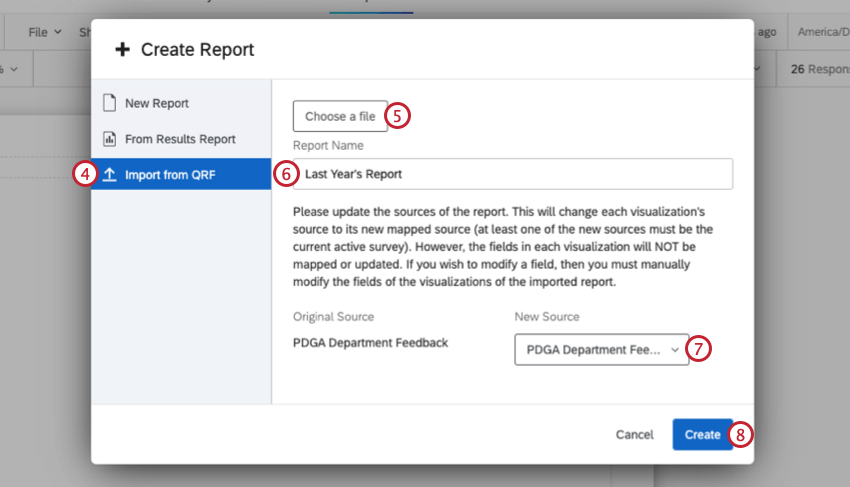
- Click Choose a file and select the downloaded QRF on your computer.
- Give your file a name.
- Select the data source of the report. This is the survey that the report will pull the data from. You must select a survey that’s part of the project you’re importing the QRF into.
- Click Create.
About Page Layouts
In your page layouts you can:
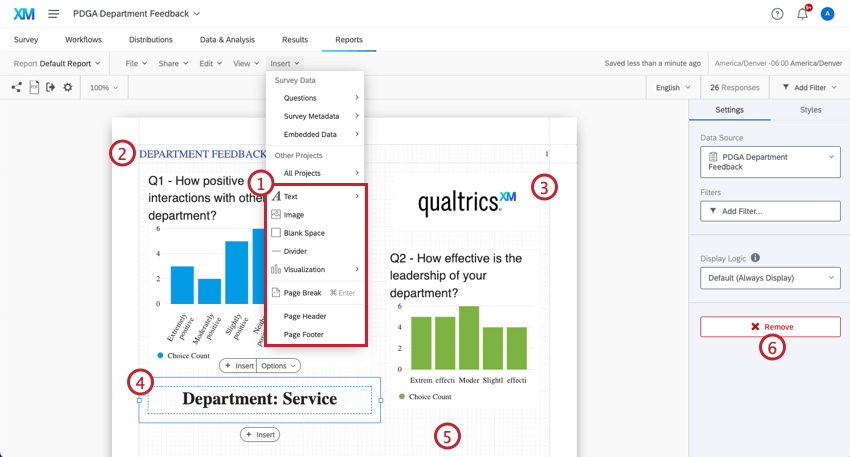
- Insert Text Areas, Images, Visualizations, Page Breaks, Headers, and Footers.
- Edit headers.
- Position graphics.
- Format text areas.
- Display gridlines to guide the positioning of elements.
- Remove elements.
Qtip: Jump to the Inserting Advanced-Reports Content page to learn how to add and adjust report content.
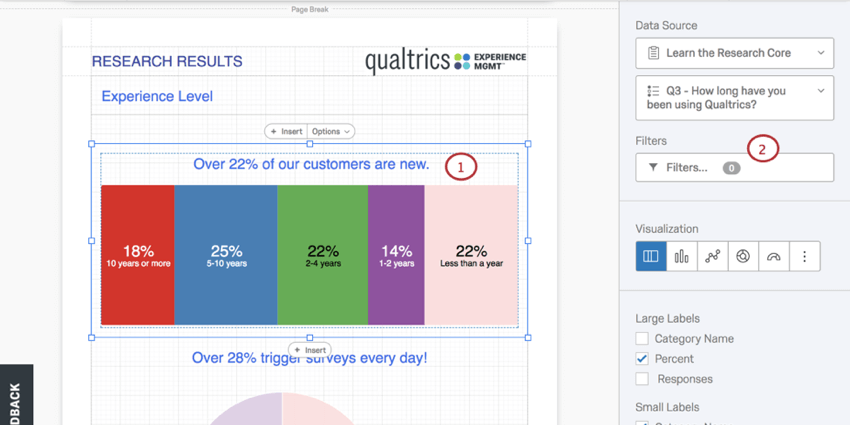
About Visualizations
If you need a single, custom visualization, style it in a page layout and export it as a JPEG image or Microsoft Word document.
To design a visualization:
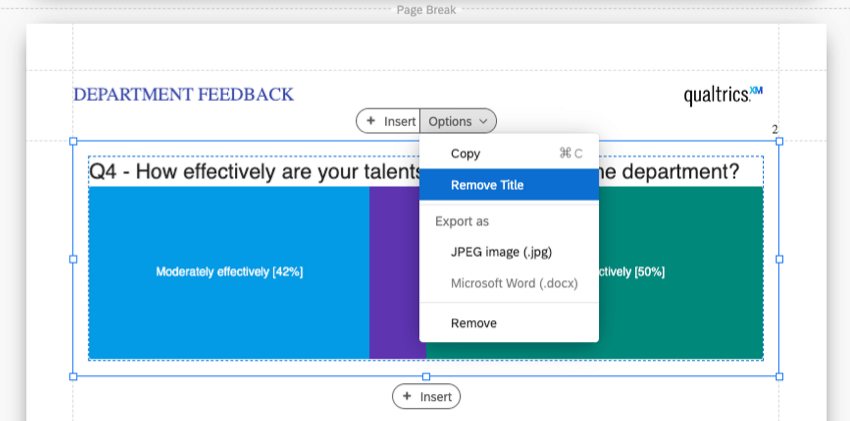
- Click the visualization you wish to style.
- To remove the default title, select Options > Remove Title.
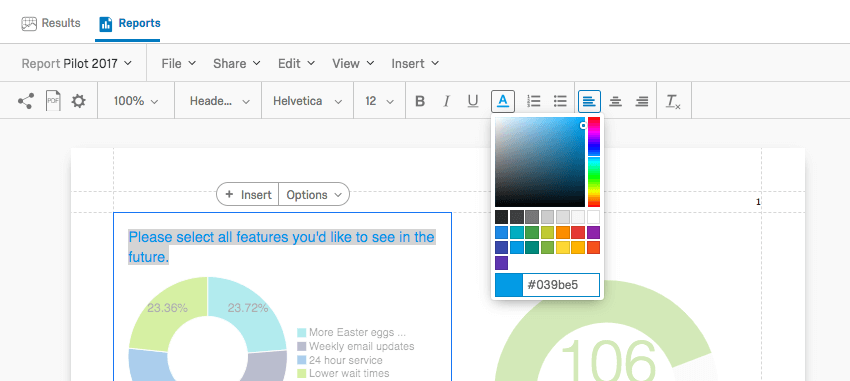
- Use the Rich Content Editor, found under the Advanced-Reports toolbar, to style your text (e.g., choose the font color tool and use hexadecimal codes or the color selector to select your colors).
- Under Visualization, choose the visualization type that best represents your data.
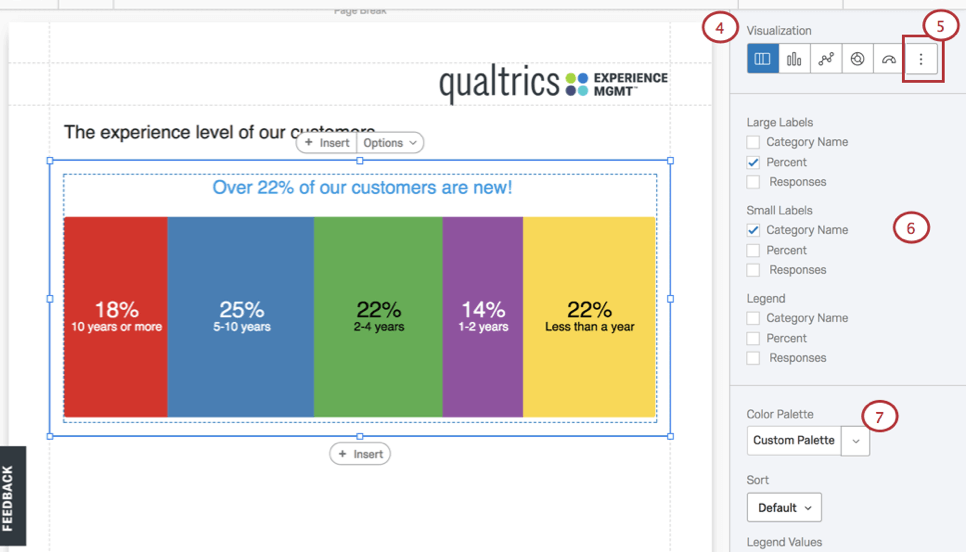
- Click the more options icon at the end of the list to display additional visualization types.
- Sort through the options in the editing pane, picking elements that fit your needs, such as adjusting your Large Labels, Small Labels, and Legend.
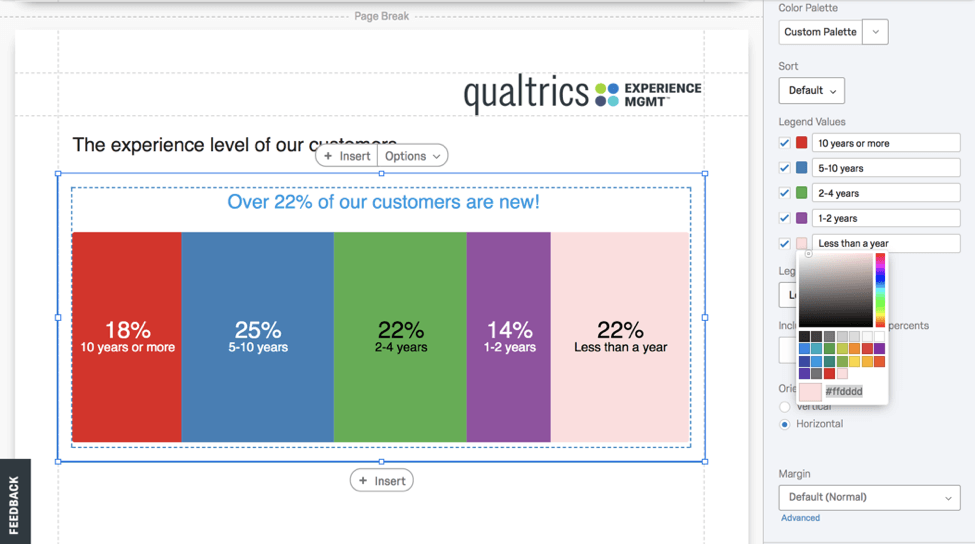
- Play with color schemes by clicking the Color Palette dropdown.
- If you need to apply a branded color scheme, enter the colors based on approved company/institution hexadecimal color codes.
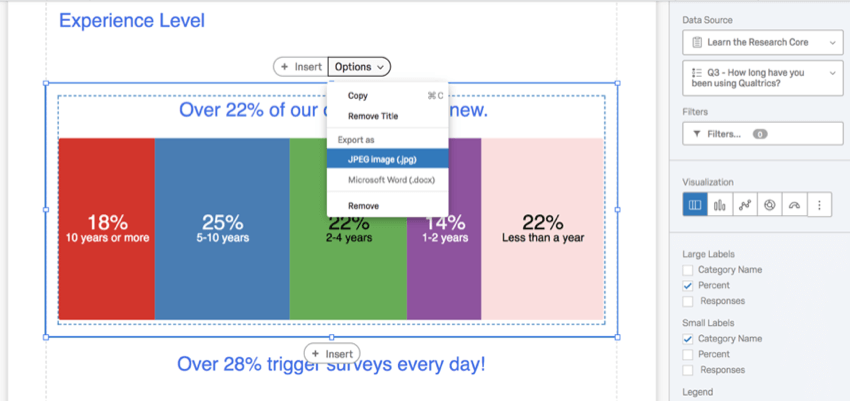
Sharing a Single Visualization
Create and share individual visualizations by re-styling visualizations and exporting them as a JPEG image (.jpg) or Microsoft Word (.docx) from the visualization Options.
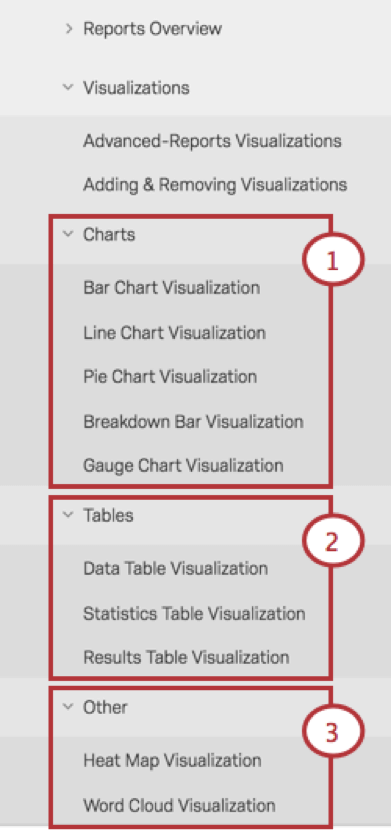
Customizing Visualizations
Qualtrics offers a dozen question types each with its own unique visualization styling options. Refer to the visualization-specific explanations (e.g., Gauge Chart Visualization or Word Cloud Visualization) as grouped under these three headings on the Support Site:
- Charts
- Tables
- Other
About Filtering
Filtering excludes information from visualizations and reports. Several data sources can be used to define the condition necessary to create a filter, specifically:
- Question Answers: When filtering by question answers, you’ll interact with field names and values. Field names act as variables (e.g., Gender, State, Status). Fields can have multiple values. For example, the field “Canadian Provinces” may have Ontario, Newfoundland, and British Columbia as values. See Fields You Can Filter By for more information.
- Survey Metadata: Includes information automatically collected when a respondent takes a survey, such as Start Date, End Date, Response Type, IP Address, Duration, Finished, and Recorded Date. See Fields You Can Filter By for more information.
- Embedded Data: Includes extra information recorded in your project beyond question responses and metadata, consisting of fields and values that can be effectively filtered. See Embedded Data for more information.
Apply your filters at two different levels:
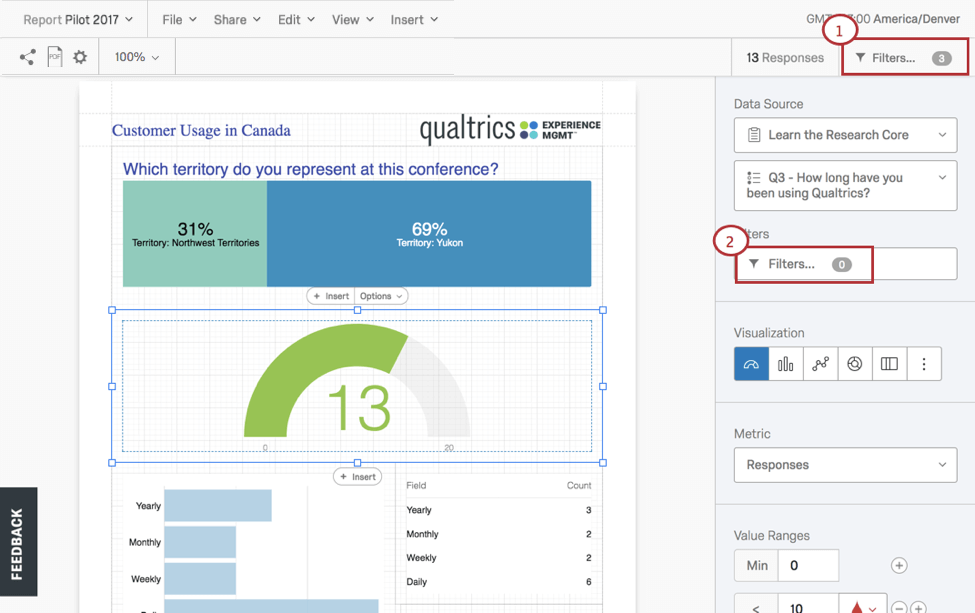
- Global Filters: Click the Filters option in the Advanced-Reports toolbar to filter an entire report.
- Visualization-Level Filters: Pre-select the specific visualization you want to filter and choose the Filters option from that visualization’s editing pane.
Applying Global Filters
If you choose to apply global filters, all of the individual visualizations in a report will assume these filters as their presets. For example, if you exclude all participants under the age of 21, you will not be able to include this demographic in any of your visualizations.
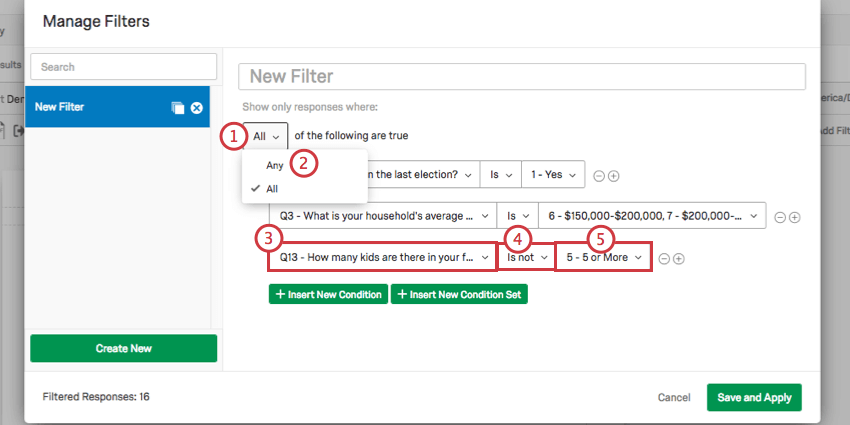
Filters are set by creating conditional statements which use ALL or ANY to drive your filtering criteria, operators, and operands (i.e., values).
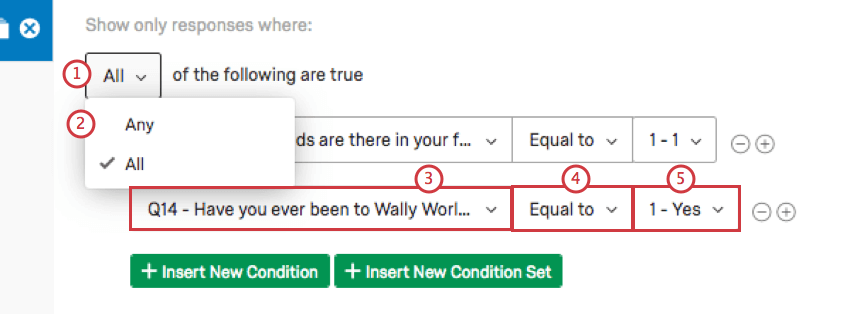
- All: All conditions must be met. Similar to “And.”
- Any: At least one condition must be met. Similar to “Or.”
- Filter Criteria: Choose between Question Answers, Survey Metadata, or Embedded Data.
- Operator: Apply a logic operator to launch your decision criteria (e.g., is / is not, equal to / not equal to, and / or, and more).
- Operand (i.e., value): Apply numeric values or character strings to evaluate your conditional statements.
Conditions are managed in the Filters popup window opened by selecting Filters from the Advanced-Reports toolbar. In this window click:
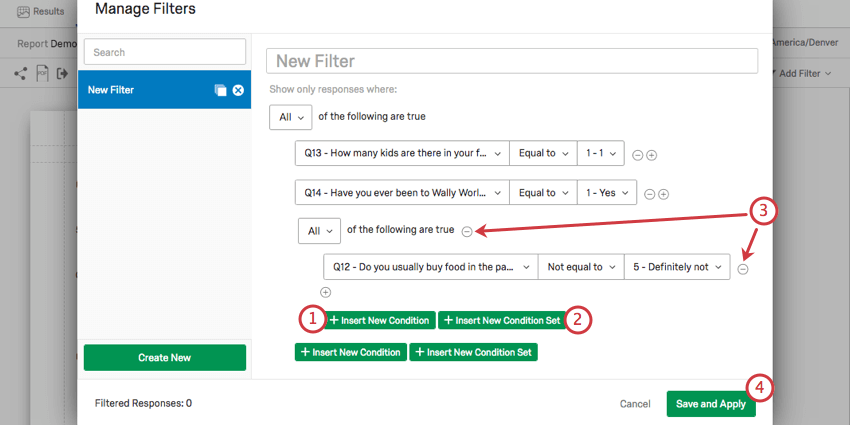
- Insert New Condition: Add as many filters as you need.
- Insert New Condition Set: Organize related filters into subcategories.
- Minus Sign ( – ): Remove or delete filters by clicking a the minus sign ( – ) next to each one.
- Save and Apply: Save your filters and exit the Filters popup window.
Applying a Filter to a Visualization
Visualization-level filters can dramatically change a single visualization without impacting the rest of the Advanced-Report. To apply a visualization filter:
- Select the visualization you wish to filter.
- Click Filters from the visualization editing pane.
- The Filters popup window will appear.
Then, set the filter:
- Decide between the “Any” and “All” variables.
- Select a Data Source (such as a question).
- Select an Operator.
- Select an Operand (i.e., value).
- Click Add Filter to add additional conditions to your filter.
- Select Save and Apply.
About Sharing Reports (in Print or Online)
After you finish your page layouts, there are two ways to share your Advanced-Reports. See Sharing Your Advanced-Reports to learn more.
- Exporting a PDF: Create a hard copy of your report by navigating to Share > Download PDF. This will generate a PDF file that can be shared (i.e., as an attachment to an email) or printed for hard copy distribution.
- Sharing a Public Report:. The easiest way to share an Advanced-Report with non-Qualtrics users is with a public report link that is generated by navigating to Share > Manage Public Report.
Where You Can Find Advanced-Reports
Advanced-reports can be found in a few different project types across the XM platform:
The following projects also contain features similar to advanced-reports. However, the way you navigate to them and the exact functionality included varies. See more details linked below:
Advanced-reports are not available in any form in Conjoints, MaxDiff, Pulse projects, or any other project types not listed above.