
Statistics Table (Results)
What's on this page
Qtip: There is a new version of Results available. To opt in to the new Results Dashboards, navigate to the Results tab and click Try it now.

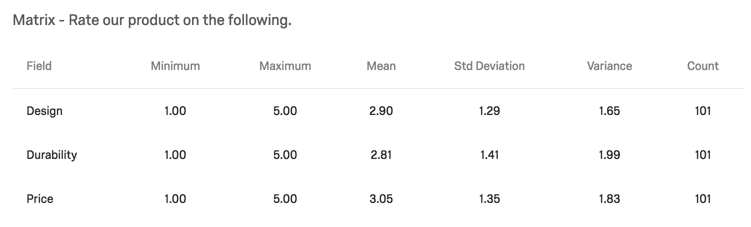
About Statistics Tables
Statistics Tables help you see multiple aggregate metrics for your chosen data source. This visualization evaluates all of the responses collected for your data source and displays calculated results such as mean and standard deviation.

Customization Options
For general settings, see the Visualizations Overview support page. Read on for settings specific to the Statistics Table.
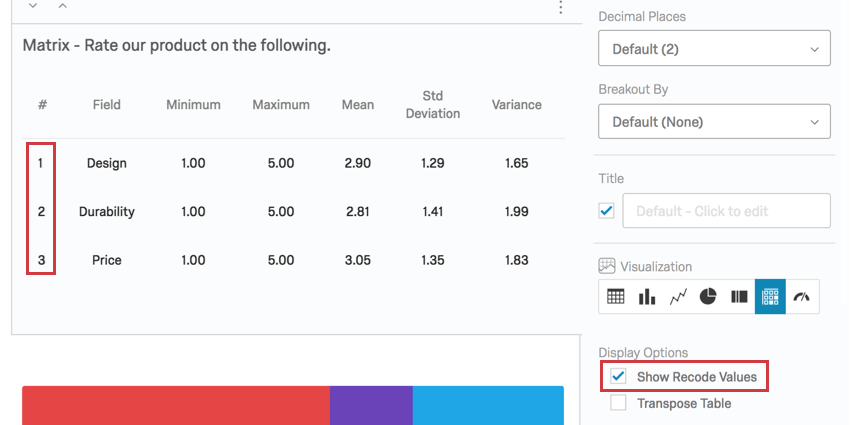
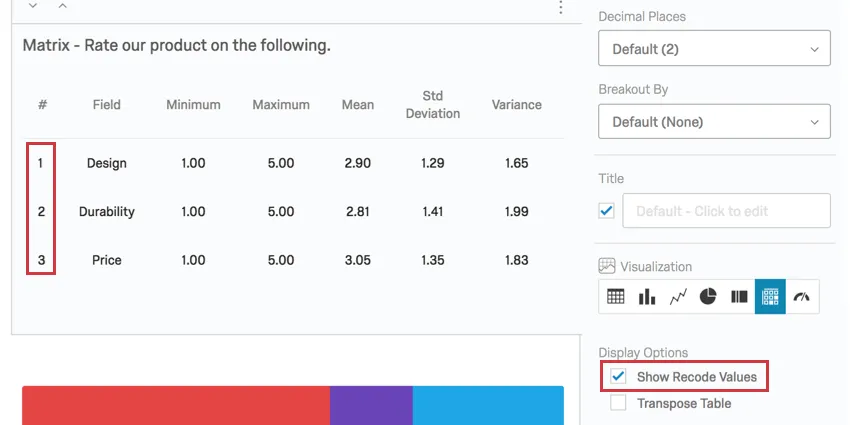
Show Recode Values
When you select Show Recode Values, the recode values will be displayed next to each answer choice.
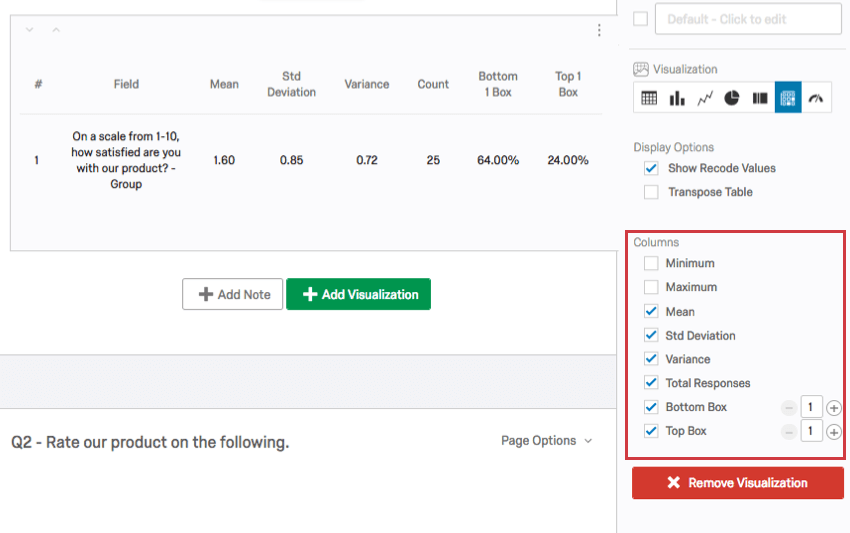
Columns
You can customize information included in your Statistics Table. Select the checkbox next to each item you want to include.
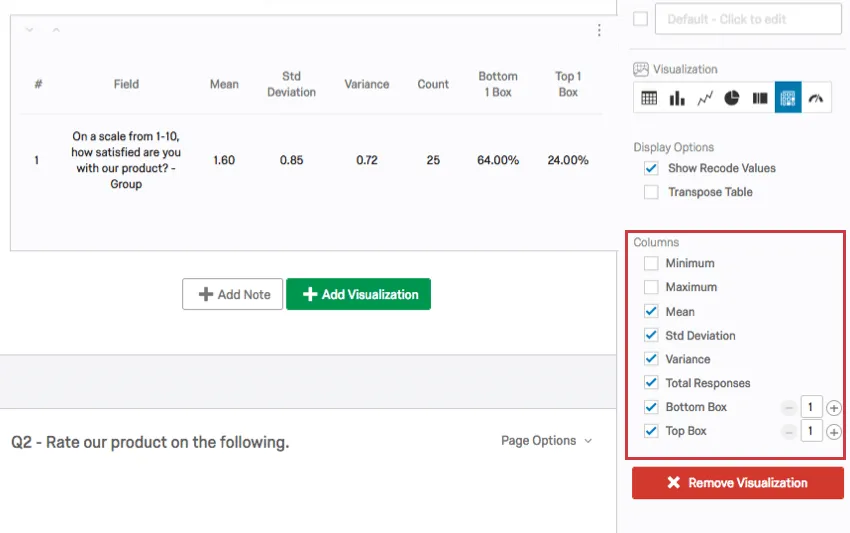
- Minimum: The lowest value collected.
- Maximum: The highest value collected.
- Mean: The average of all values collected.
- Std Deviation: The standard deviation across all values collected.
- Variance: The variance across all values collected.
- Total Responses: The total number of responses collected that contribute to the statistics.
- Top Box: Top box is the percentage of respondents who fit into the highest ends of the scale. You can specify how many scale points are included in this box by typing in the field. Example: There are three NPS® groups. Setting it as 3 would make the top box equal to 100% of respondents, since 100% of respondents answered the questions. But if you changed the top box to 1, it would only look at promoters, and the percentage would match the percentage of respondents who were promoters.

- Bottom Box: Bottom box is the percentage of respondents who fit into the lowest ends of the scale. You can specify how many scale points are included in this box by typing in the field. Qtip: Top and bottom box are only options for questions with scales, such as Multiple Choice. Continuous variables, such as Sliders and Text Entry, cannot display top and bottom box.

Qtip: At this point in time, Qualtrics reporting is unable to display the median.
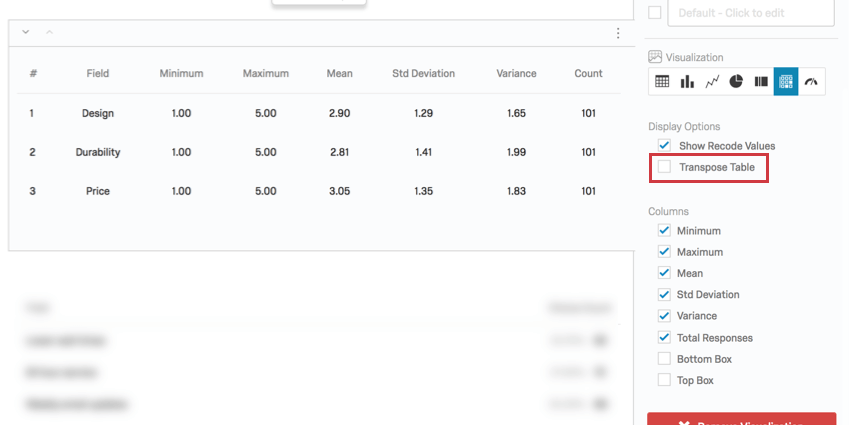
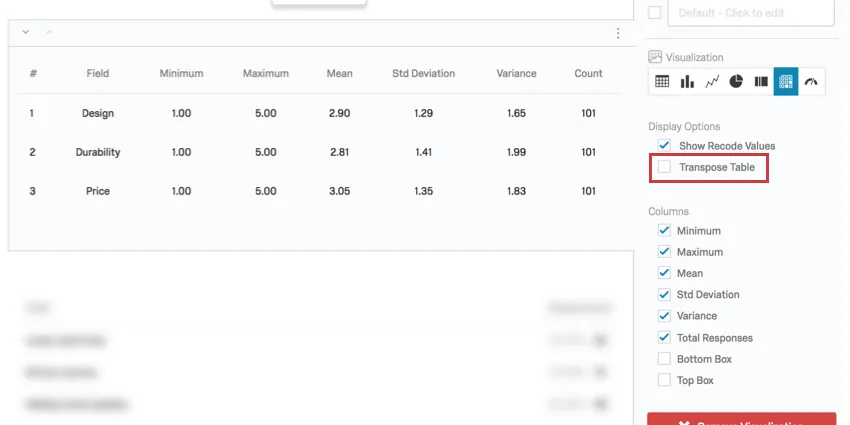
Transposing the Table
Sometimes, there will be multiple dimensions in your table. For example, let’s say you have a Matrix Table with statements. Or, you have a Multiple Choice satisfaction question and have applied a gender breakout to the visualization.
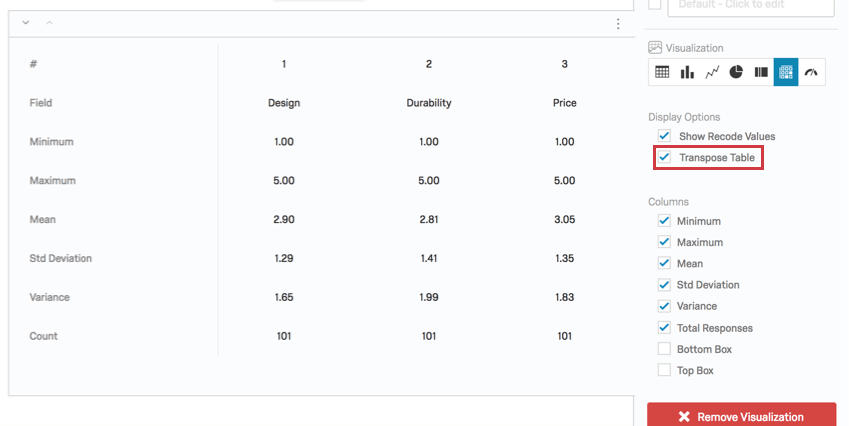
When this happens, the Transpose Table option appears. This lets you switch your rows (statements or breakouts) and columns (which statistics you have included).

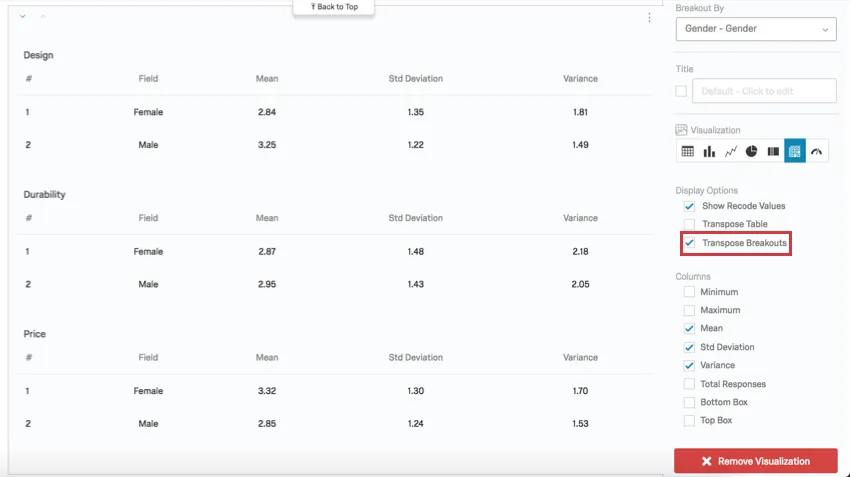
If you combine a two-dimensional question (for example, a Matrix Table) with a breakout, Transpose Breakouts allows you to switch the breakout with the content from the data source.
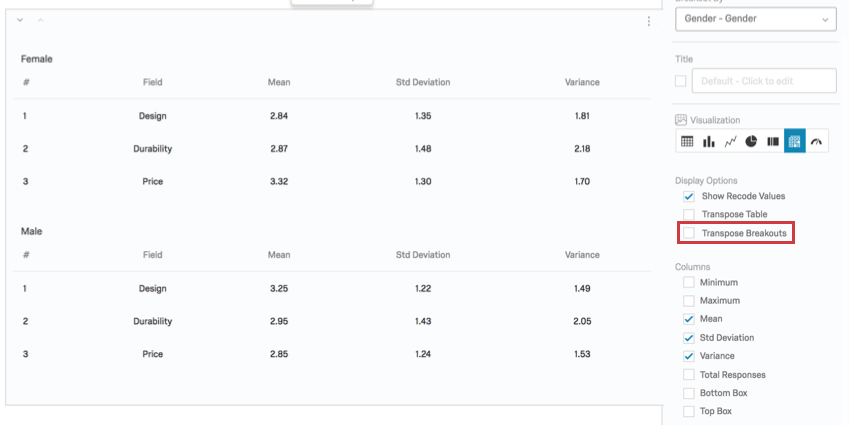
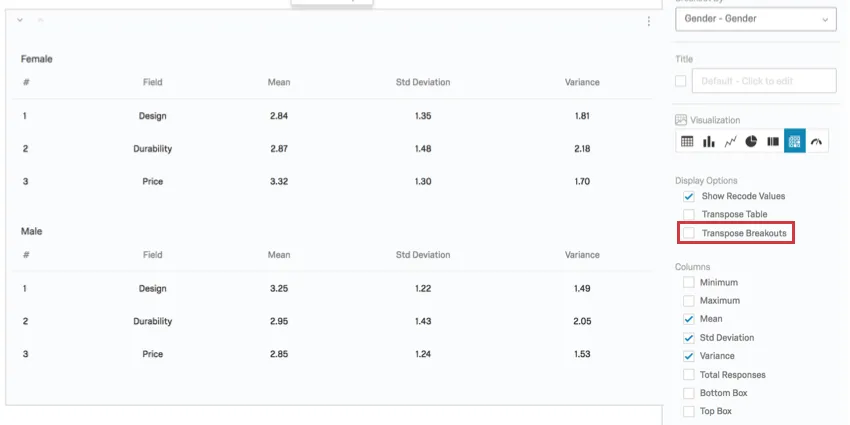
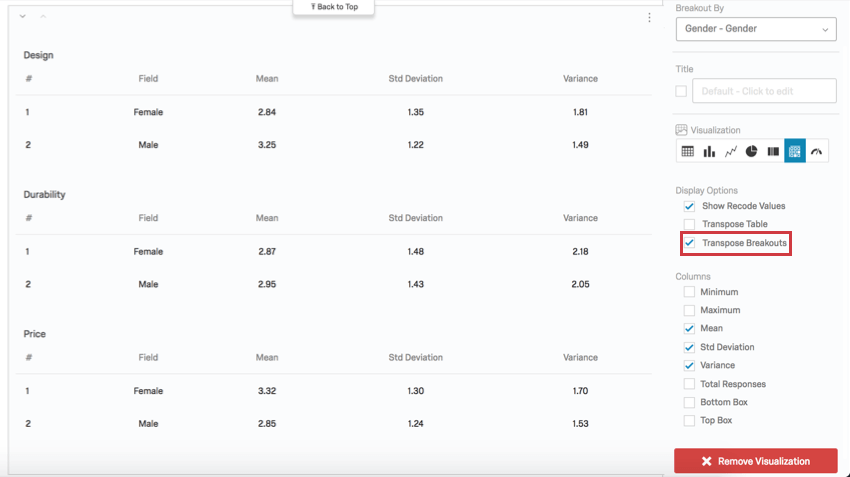
Compatibility
The Statistics Table is only compatible with variables that can come in numeric formats.
- Single-Answer Multiple Choice
- Net Promoter Score
- Single-Answer Matrix Table
- Bipolar, Rank Order, Profile, Constant Sum, and MaxDiff Matrix Tables
- Text Entry with Numeric Validation
- Form field with numeric validation
- Open text fields on other questions, such as Text Entry Matrix Tables, text entry columns on Side by Sides, and “Other” text boxes, that have numeric validation
- Side by Side Qtip: There should be multiple-choice single-answer fields, or a text entry field with numeric validation.
- Slider
- Rank Order
- Constant Sum
- Pick, Group, and Rank
- Graphic Slider
- Drill Down
- Timing
- Number and Number Set Embedded Data
- Formulas
- Numeric manual variables
That's great! Thank you for your feedback!
Thank you for your feedback!