
Response Weighting in CX Dashboards
What's on this page
About Response Weighting
Response weighting allows you to establish alternate weightings for your dashboard data so that your dashboards are based on a desired distribution, rather than the actual distribution. This can help you correct your data for under-surveyed populations that you want to represent appropriately. Qualtrics will automatically determine how to weight each response and correct your widgets as new data comes in. This means you only need to set up your weighting once per dashboard data mapping.
Qtip: This page is referring to response weighting in CX Dashboard projects and BX Dashboards only.
Setting Up Response Weighting
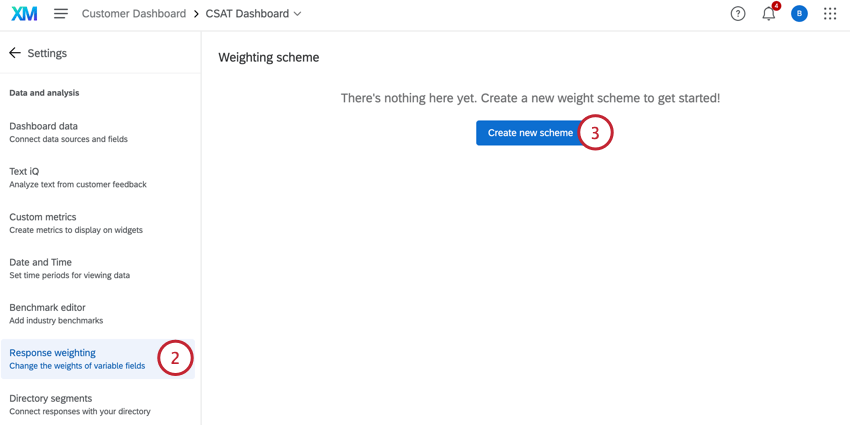
Attention: You can only weight data with finite values. That means weighting is only compatible with the following field types:
- Date
- Number Set
- Text Set
- Any field group
Qtip: When a new answer is added to a weighted variable, this answer is automatically assigned a weight of 0. This means it will be excluded from any weighted calculations until you designate a weight for it. Additionally, assigning a weight of 0 to any answer will remove it from calculations.
Currently, you cannot export your calculated weights for raked weighting.
Weighting Multiple Variables: Raked vs. Interlocked
For an explanation of how the different types of weighting work, see Weighting Multiple Variables: Raked vs. Interlocked. Although this content is on a survey support page, the functionality is the same in CX Dashboards.
Wave Based Weighting
Wave based weighting allows you to apply unique weights over various time periods or specific categories.
For more details, see Wave Based Weighting. Although this content is on a survey support page, the functionality is the same in CX Dashboards.
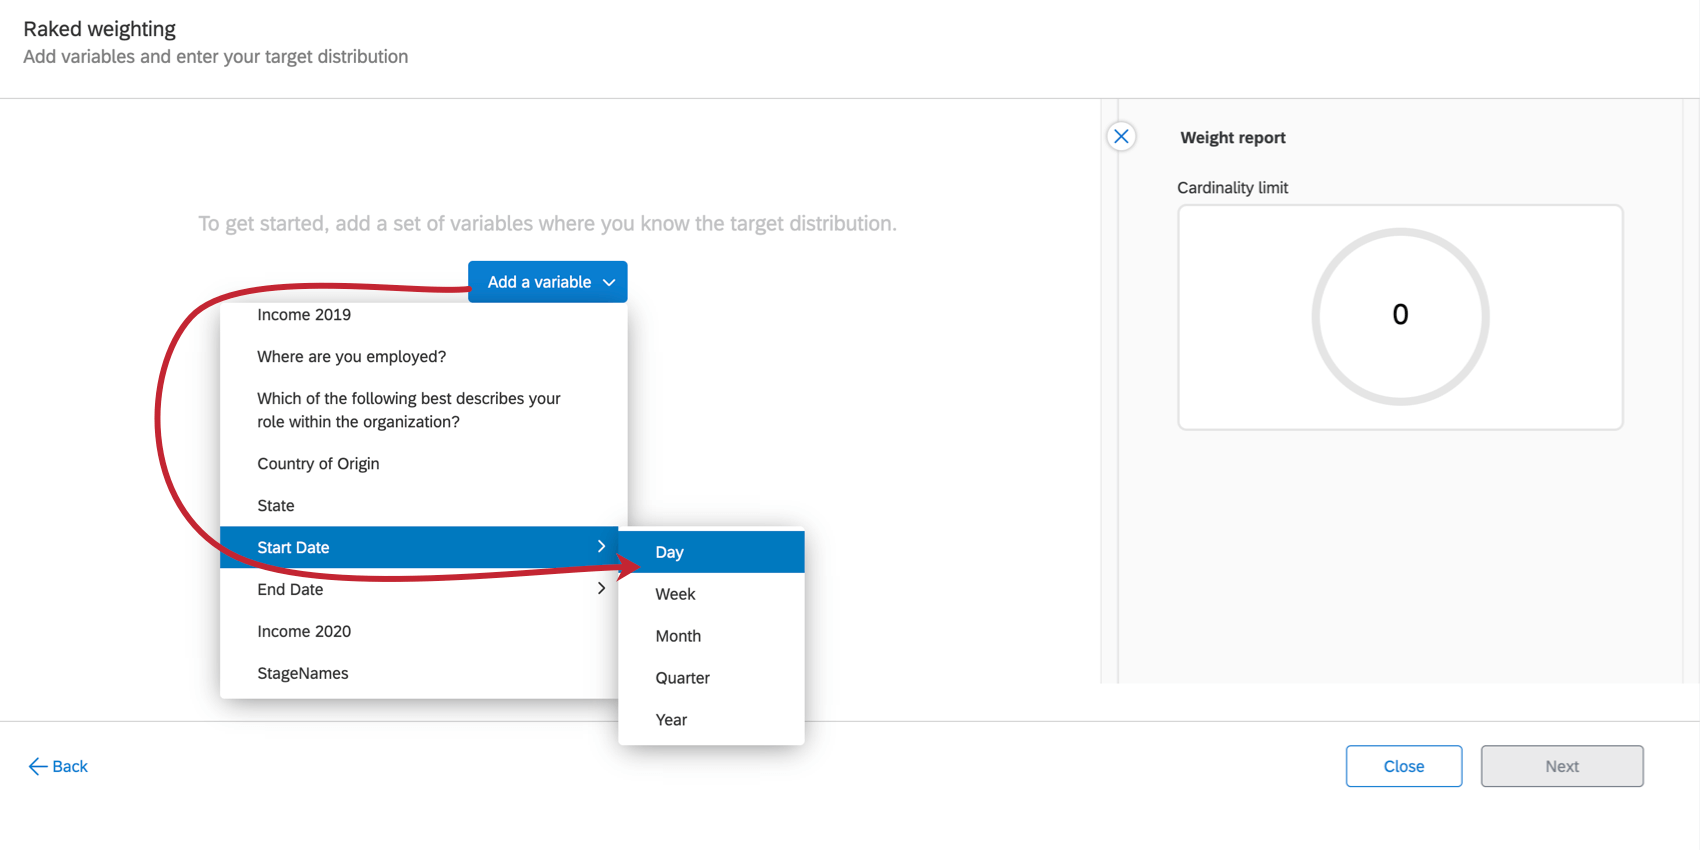
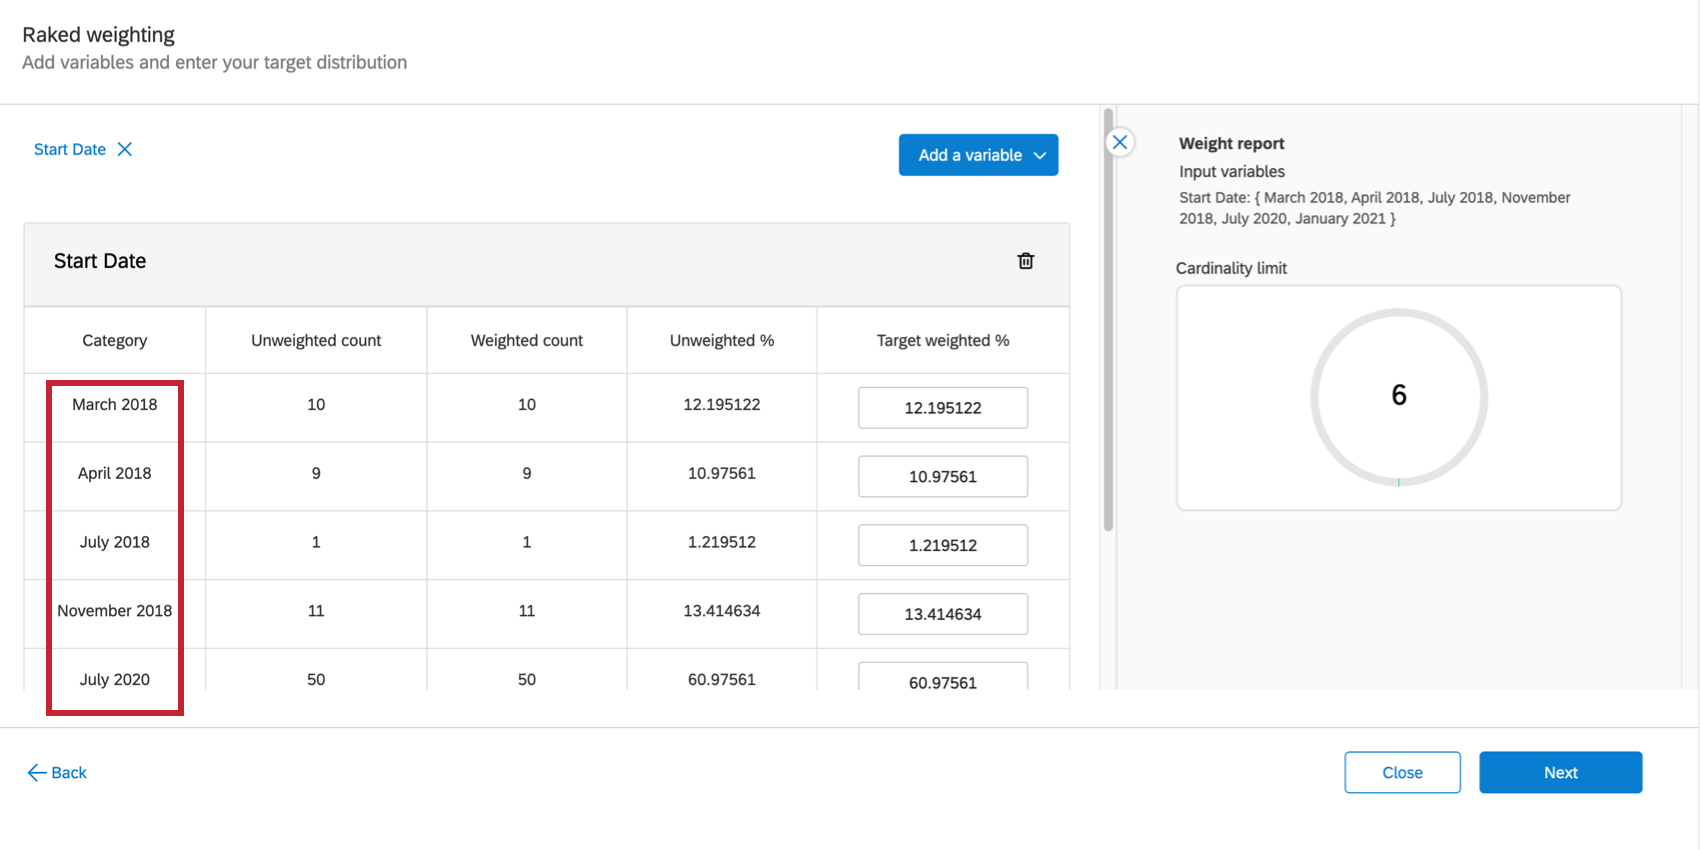
Using Time as a Dimension
If you end up using a date data field type as a dimension, you will be prompted to choose the time periods you want to group the weighting by. For example, in the screenshot below, we choose Start Date, and then can choose between day, week, month, quarter, or year.
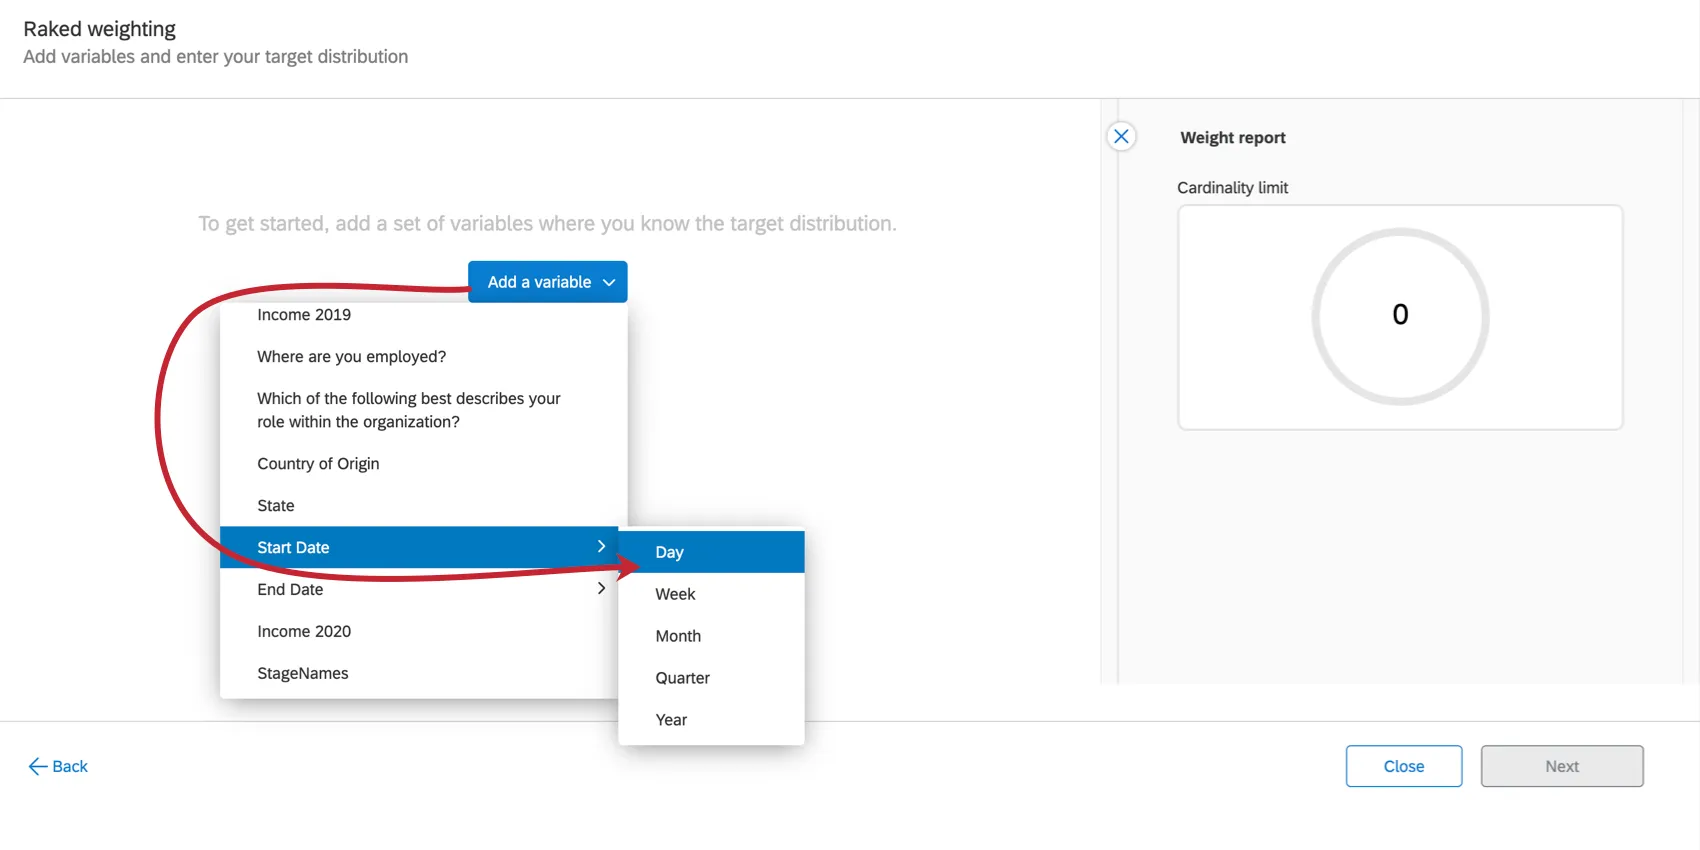
After saving your choices, CX Dashboards will automatically create groups for your time periods. You can then add weights to these periods just like you would for any other dimension.

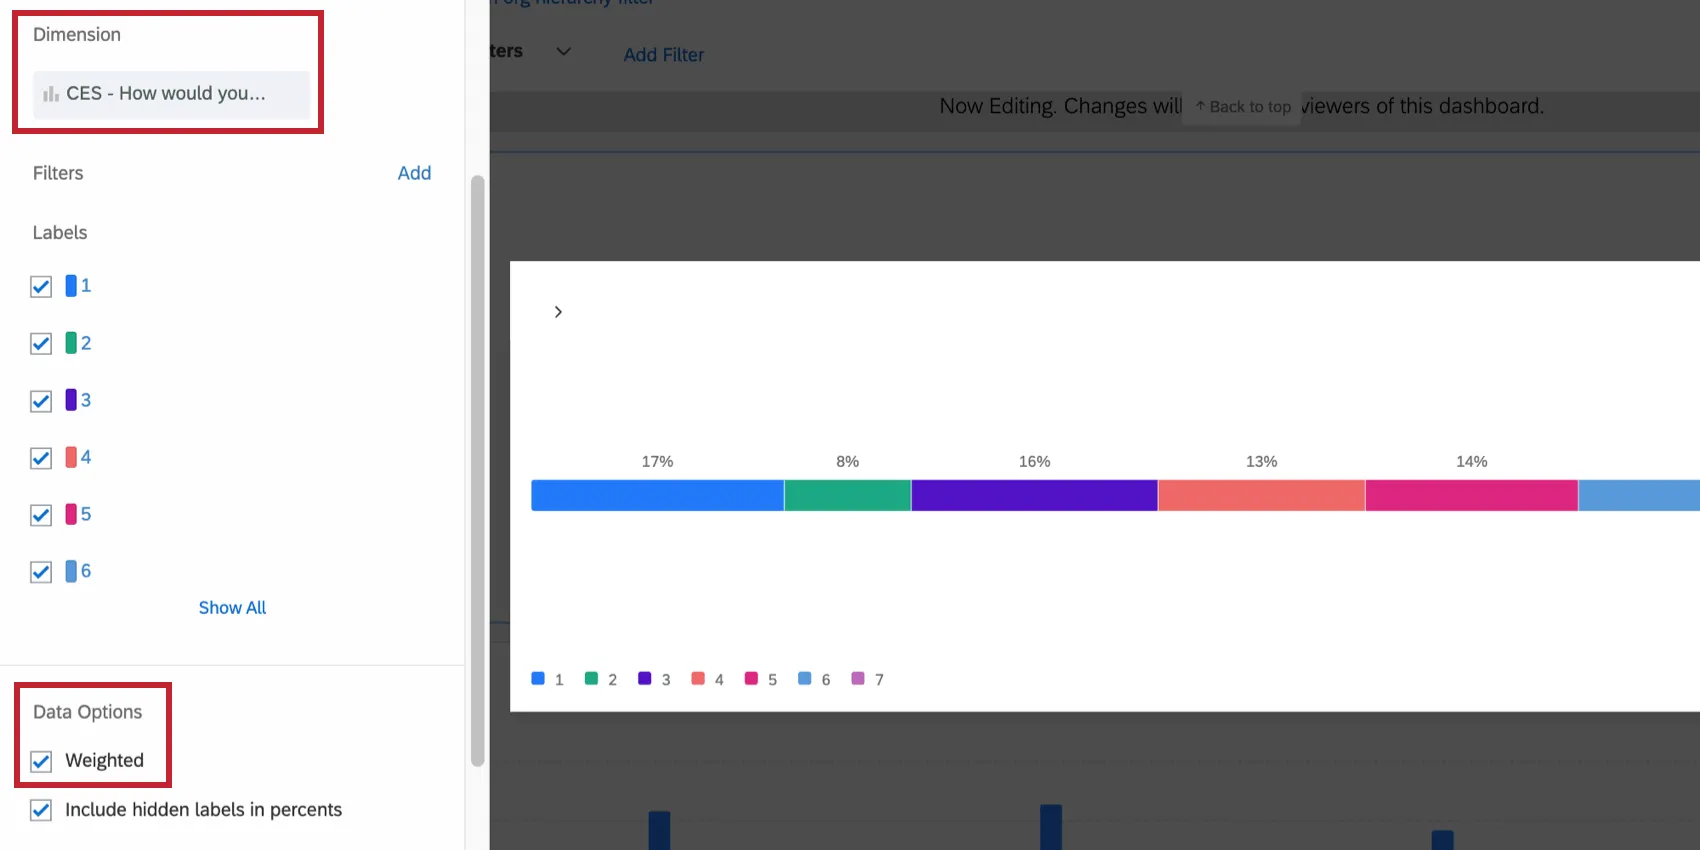
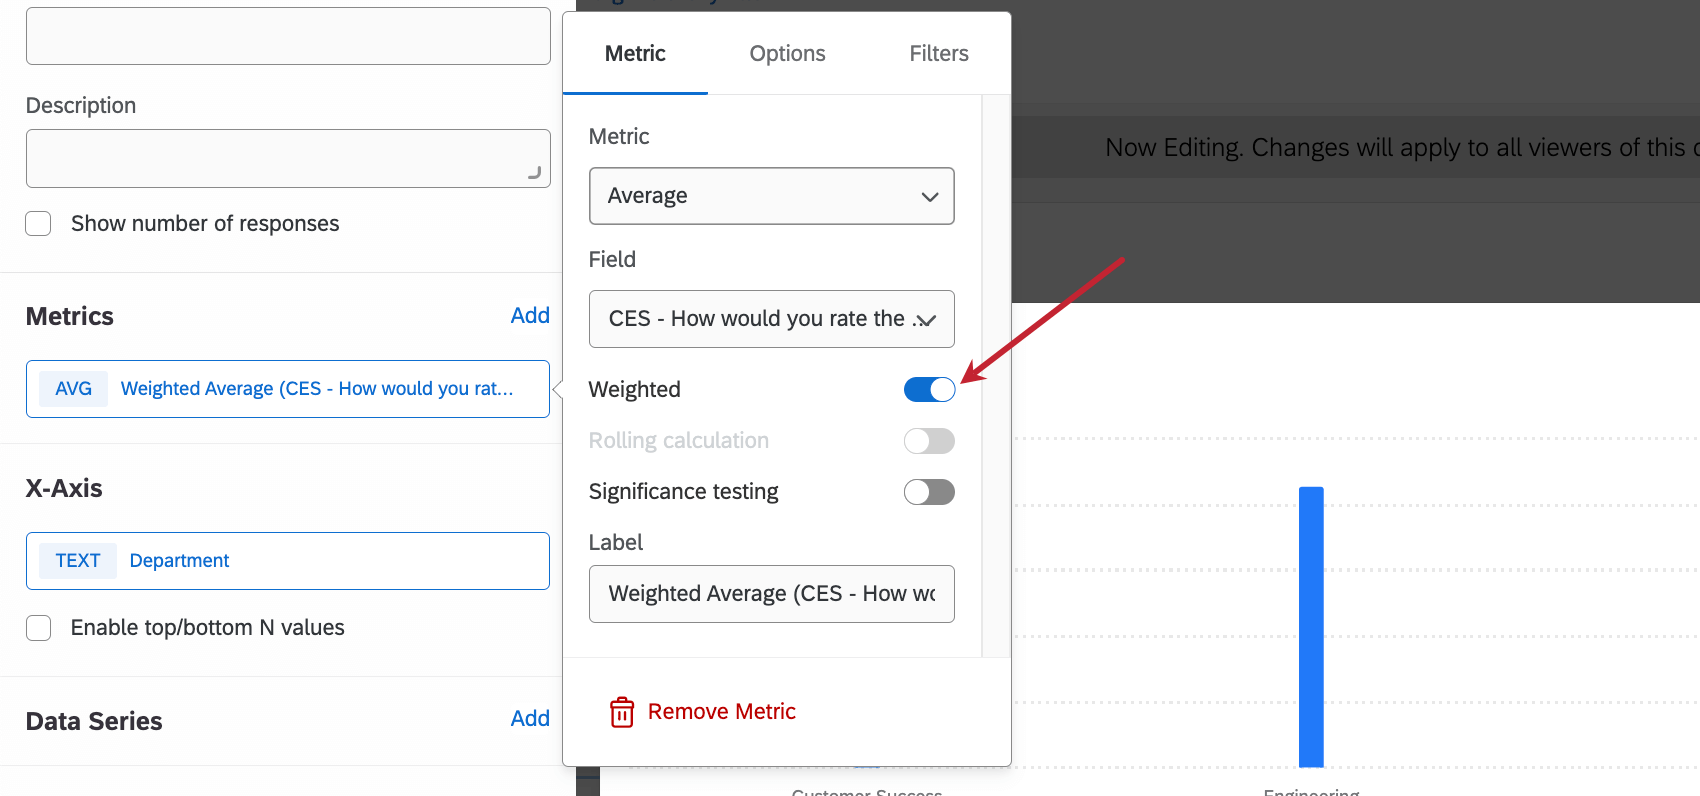
Using Weighting in Widgets
To use weighting in a widget, click its metric, then select Weighted.

Weighting is compatible with any widget that can support metrics, such as:
- Line
- Horizontal bar
- Vertical bar
- Donut / pie
- Table
- Gauge chart
- Number chart
- Breakdown bar Qtip: In breakdown bars, you first add the field you’ve weighted as a Dimension, then scroll down to Data Options enable weighting.


Attention: If your metric contains a measure group, you cannot use weighting. For example, if your metric is the average, minimum, or maximum of a measure group, the weighting option will not appear.
Exporting & Importing Weights
Attention: Currently, only interlocked weights can be imported and exported.
You can export your weights from Qualtrics and edit them outside of the platform. You can then re-import these weights for them to take affect in your CX Dashboard.
To learn more, see Exporting & Importing Weights. Although this content is on the survey support page, this functionality is the same as it is in CX Dashboards.
That's great! Thank you for your feedback!
Thank you for your feedback!