-

Qualtrics Platform -

Customer Journey Optimizer -

XM Discover -

Qualtrics Social Connect
Inserting Content into Report Templates (EX)
About Inserting Content into Report Templates
You will build your report template by inserting various types of content, such as data visualizations, images, page breaks, headers and footers.
Adding Content
To add content into your report template:
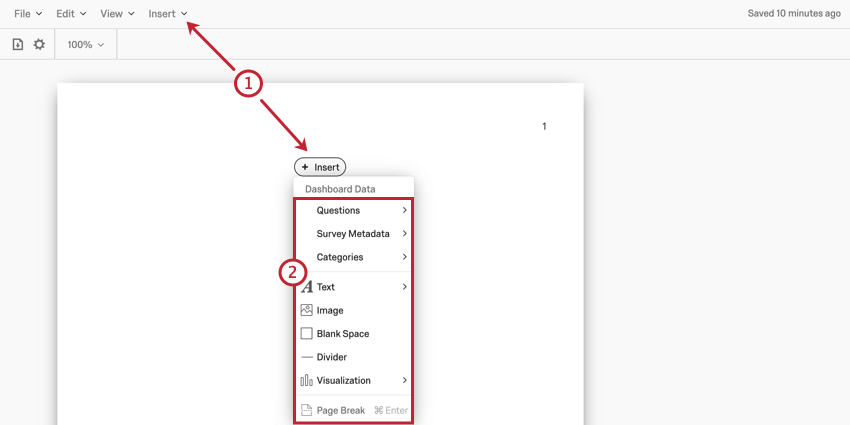
- Click Insert either in the report template toolbar or in the report template body itself.
 Qtip: The menus that open are mostly the same. The only difference is that you can add Page Headers and Footers from the toolbar menu only.
 - Choose the type of content you would like to insert. You may choose from the following:
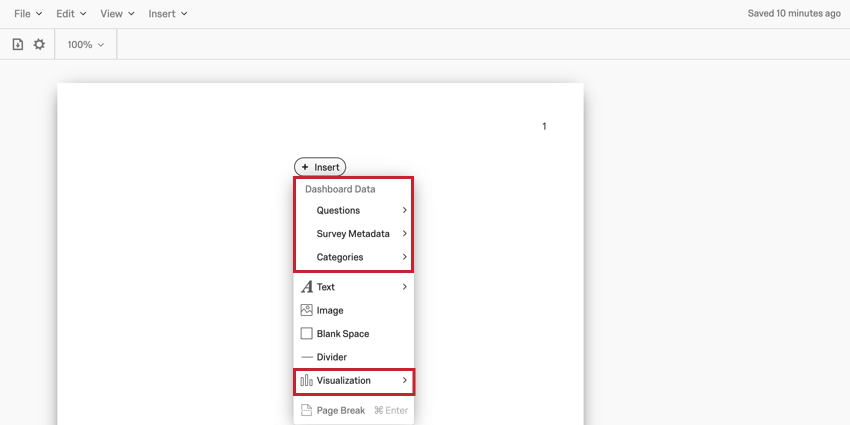
- Questions, Survey Metadata, Categories, and Visualizations: inserts a data visualization, such as a chart or table, for analyzing your response data.
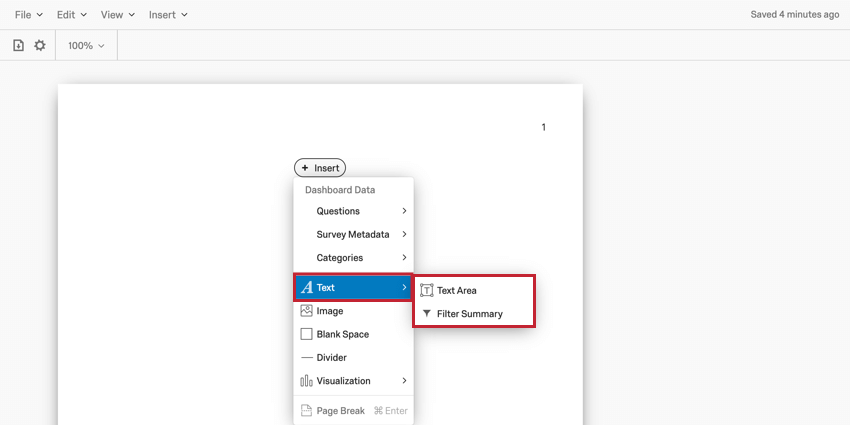
- Text: inserts either a Text Area where you can type text for your report viewers to read or add a Filter Summary which will show you the dashboard filters that are applied when you export your report.
- Image: Inserts an image into your report template. You can choose an image from your Library or provide the URL of an image hosted online.
- Blank Space: Inserts a blank space into your report template.
- Divider: Inserts a horizontal or vertical line into your report template.
- Page Break: Inserts a page break into your report template.
- Page Header: Add a header to your report template.
Qtip: This option is available in the Insert menu from the toolbar only.
- Page Footer: Add a footer to your report template.
Qtip: This option is available in the Insert menu from the toolbar only.
Visualizations
The bulk of your report template will be made of data visualizations. You can choose to either insert a specific visualization type and then choose what data is displayed, or choose what data to display, and then pick a fitting visualization.
For more information about visualizations, read the Visualizations Overview. For information on any given visualization, check our our List of Report Template Visualizations.
Text
After selecting Text, you can choose to insert either a Text Area or a Filter Summary.
Text Area
Once a Text Area is added to your report template, double click it to start editing.
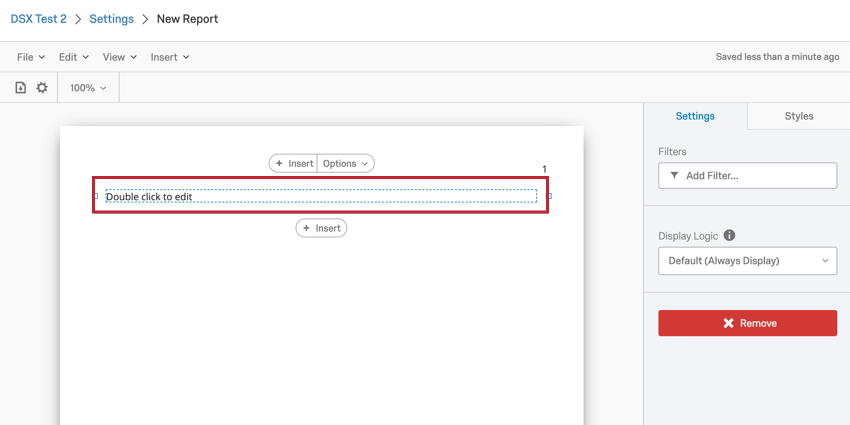
While editing your Text Area, a Rich Content Editor will be added to your report template. Here, you can design the text that goes in your Text Area.
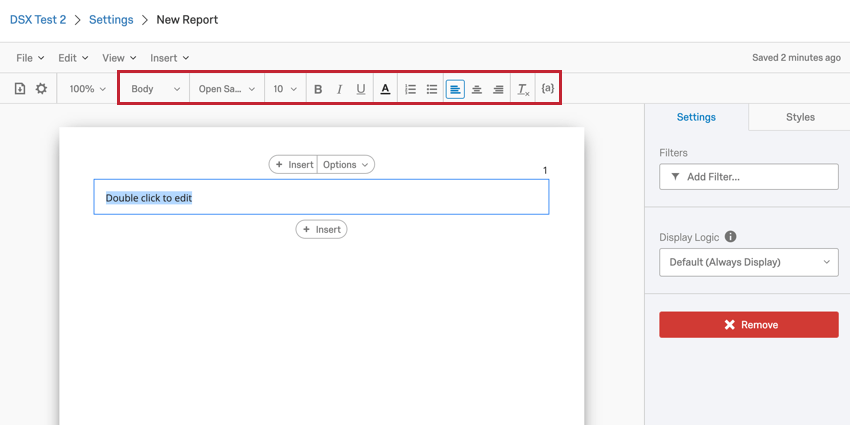
Using the Rich Content Editor, you can do the following:
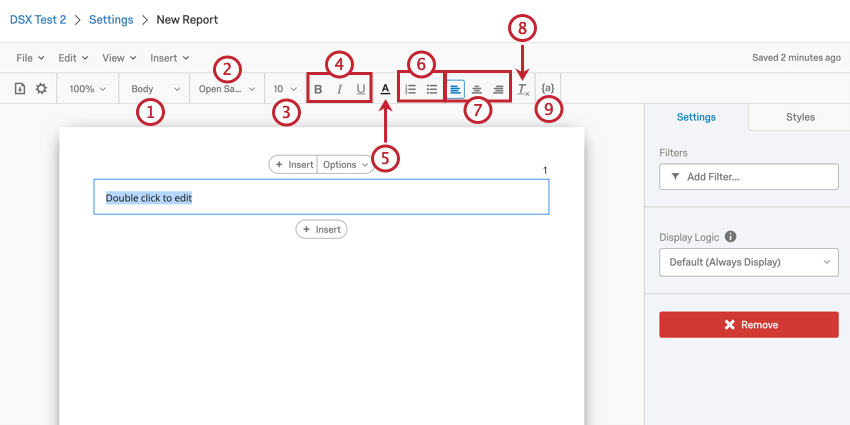
- Choose the style of the text. You can save styles in this menu for easy formatting in future reports.
- Choose your font.
- Select the font size.
- Apply bolding, italics, and underlines to text.
- Choose the text color.
- Add numbered and bulleted lists.
- Select the text alignment.
- This option will strip the formatting of any selected text.
- The {a} icon is used to insert Piped Text.
Filter Summary
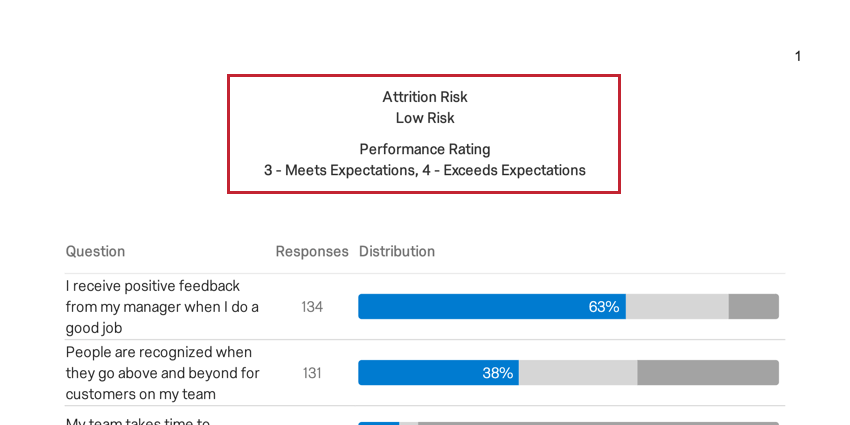
The Filter Summary option will add a text box into your report template that you cannot edit or modify.
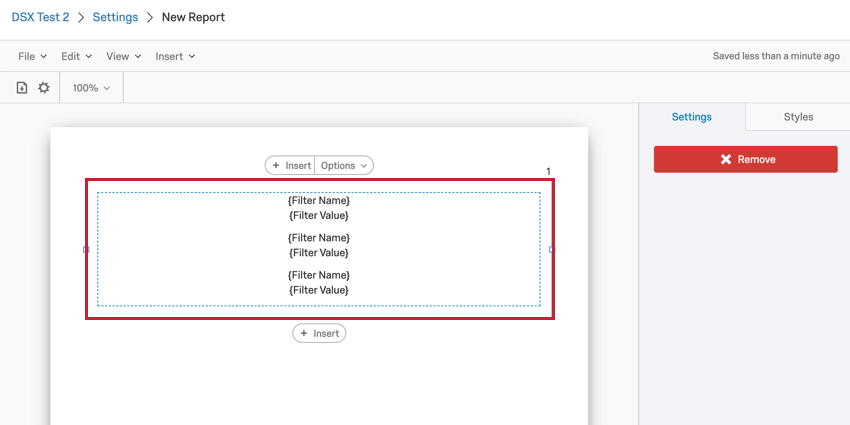
When you export your report, this text box will display the dashboard filters that are applied to your dashboard. This does not include the dashboard org hierarchy filter. If you’d like to show org hierarchy information, add a text area and insert piped text for the hierarchy name and/or unit.
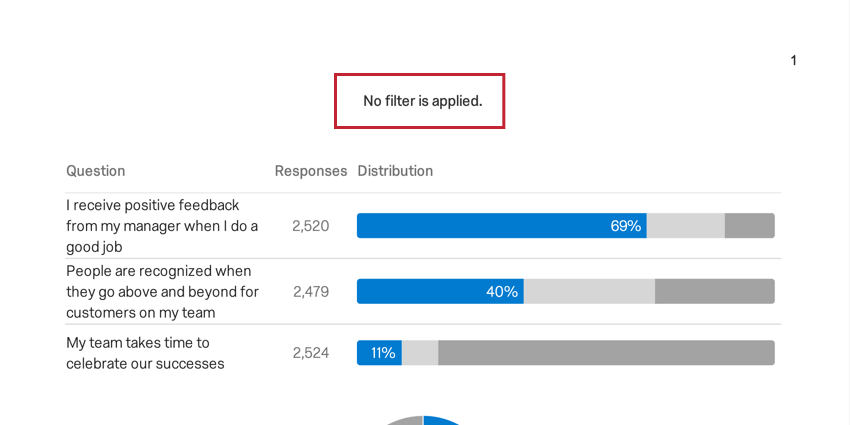
If no filters are applied when the template is exported, the filter summary will say No filter is applied.
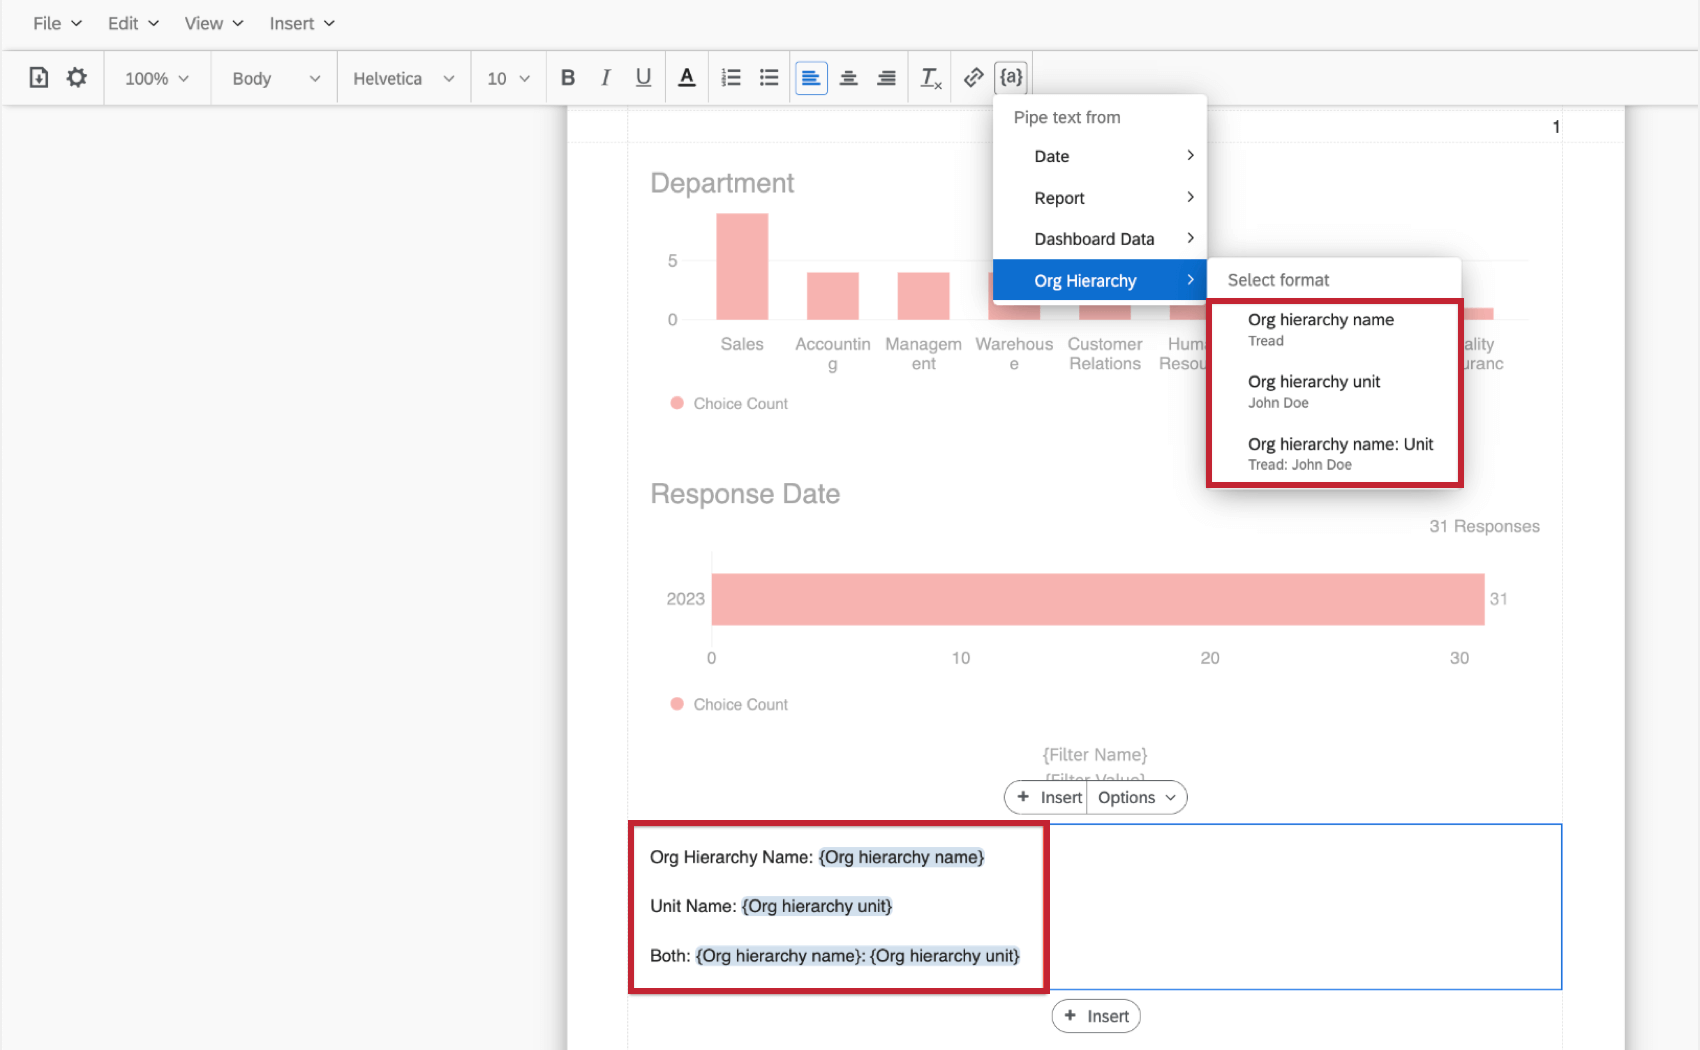
Piped Text
The following types of piped text are available in EX reports templates.
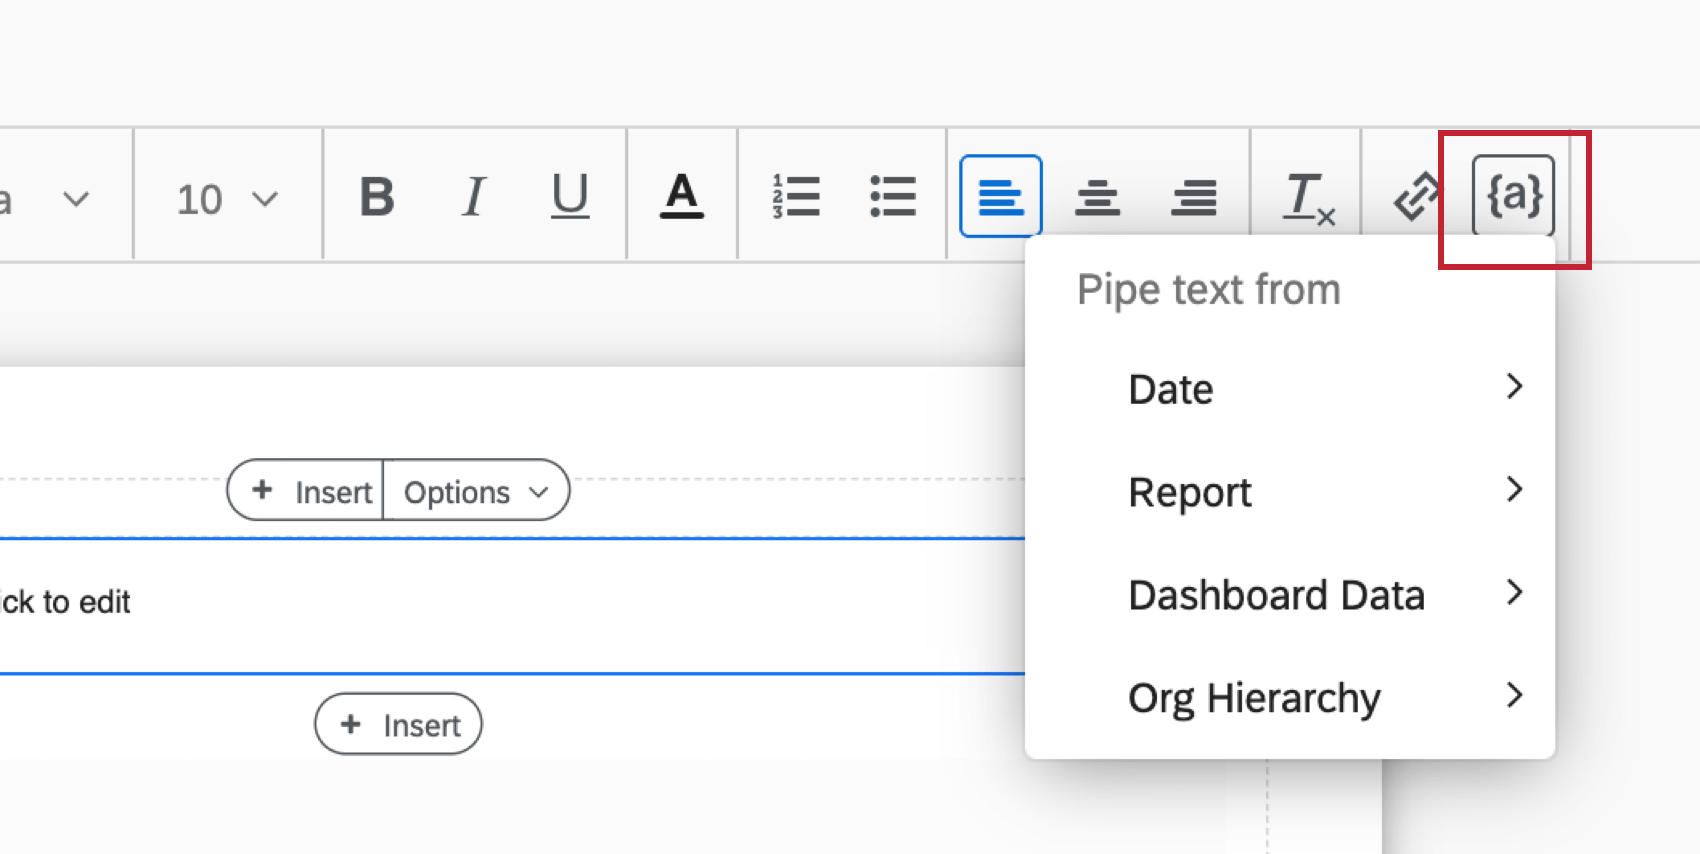
- Date: Displays the date that the report is exported in several optional formats.
- Report: Displays the name of the report template. This name is set when the report template is created.
- Dashboard Data: Displays information from the dashboard, such as name, total responses, questions from the survey, and more.
- Org Hierarchy: Displays the org hierarchy name and/or unit that the user is part of.
Image
You can insert an image into your report template. To get started, select Image in the Insert menu. After inserting the image placeholder into your report template, click on it to configure your image.
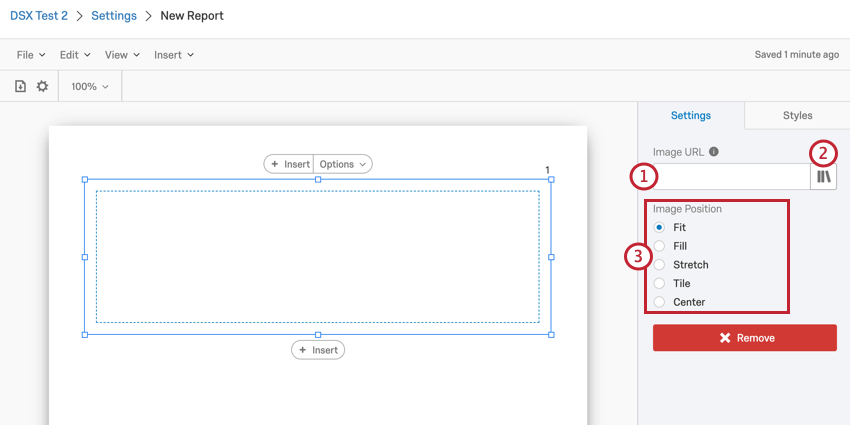
To select and format your image:
- If your image is hosted on a website, paste the URL in the Image URL box.
- If your image is in your Library, or you’d like to upload an image to your Library to use in your template, click the library icon.
- Choose the Image Position. You can choose one of the following:
- Fit: The image reverts to its natural dimensions within the margins. If you need to resize an image without stretching it, this is the best option.
- Fill: The image fills the margins without distorting it.
- Stretch: The image will stretch to fit the margins
- Tile: The image will repeat until it fits the page dimensions. This option looks especially nice for minimalist images or patterns. If the image is larger than the space you’re trying to fit it into, the image will not repeat.
- Center: This option will center your image in the image box.
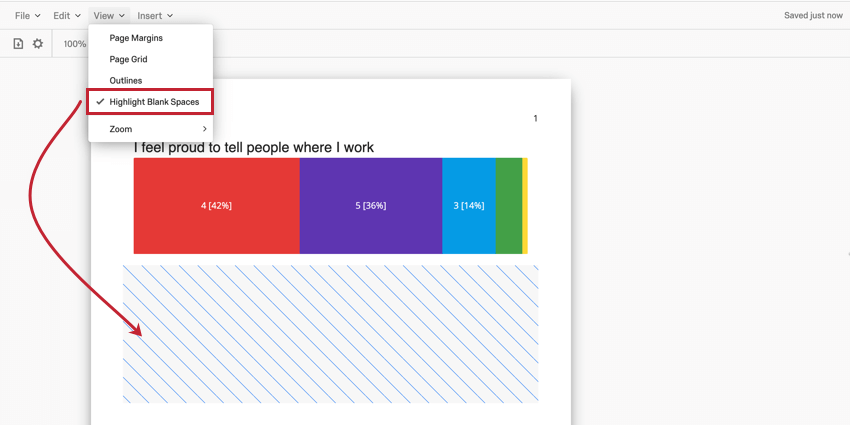
Blank Space
The Blank Space option will insert an empty placeholder into your report template. No data or other content can go in a blank space.
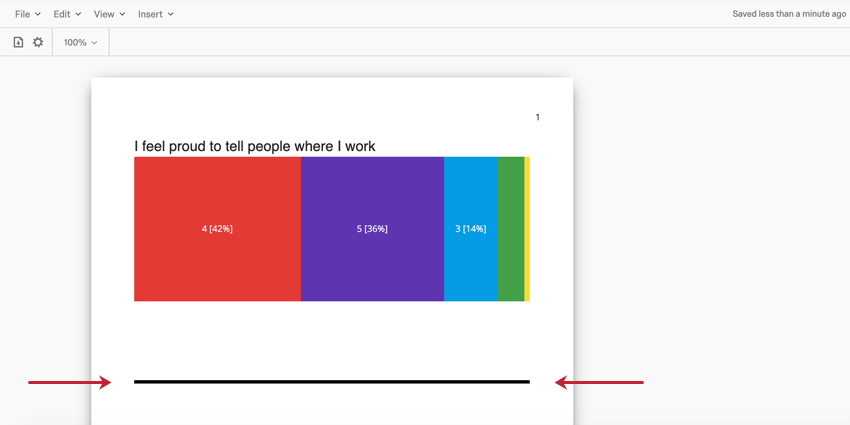
Divider
The Divider option will insert a line into your report to be used as a physical division between other pieces of content in your report.
Once inserted, you can edit the following aspects of the divider:
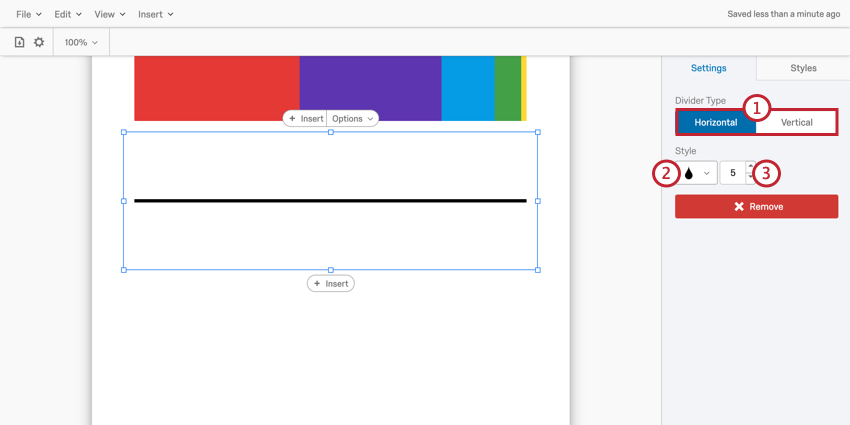
- Choose the Divider Type which will determine the divider’s orientation.
- Select a color for the divider.
- Enter a width (in pixels) for the divider. The maximum is 10 and the minimum is 1.
Page Breaks & Deleting Pages
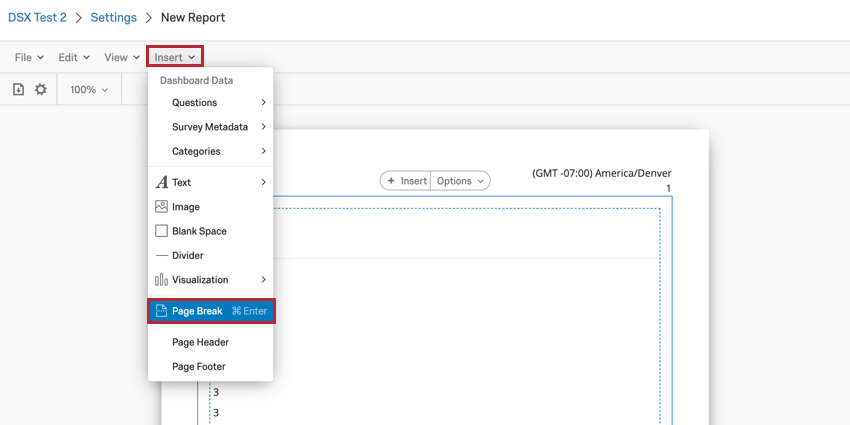
Pages are created automatically when you add visualizations and insert other content. Once a page runs out of room, a new one is automatically created. However, you can also manually insert pages. Inserting a Page Break will move all content below the page break to a new page.
To insert a page break, select Insert and then Page Break.
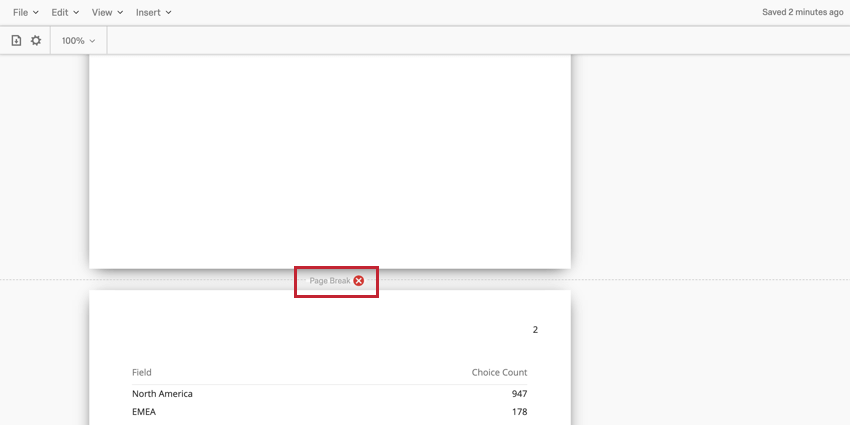
After a page break has been added to your report template, it’ll be found in between your pages in the report template editor. Hover your mouse over the page break and click the red X to remove the page break.
Page Header & Footer
Clicking Page Header or Page Footer will open the report editor for your header or footer. You can configure the following options:
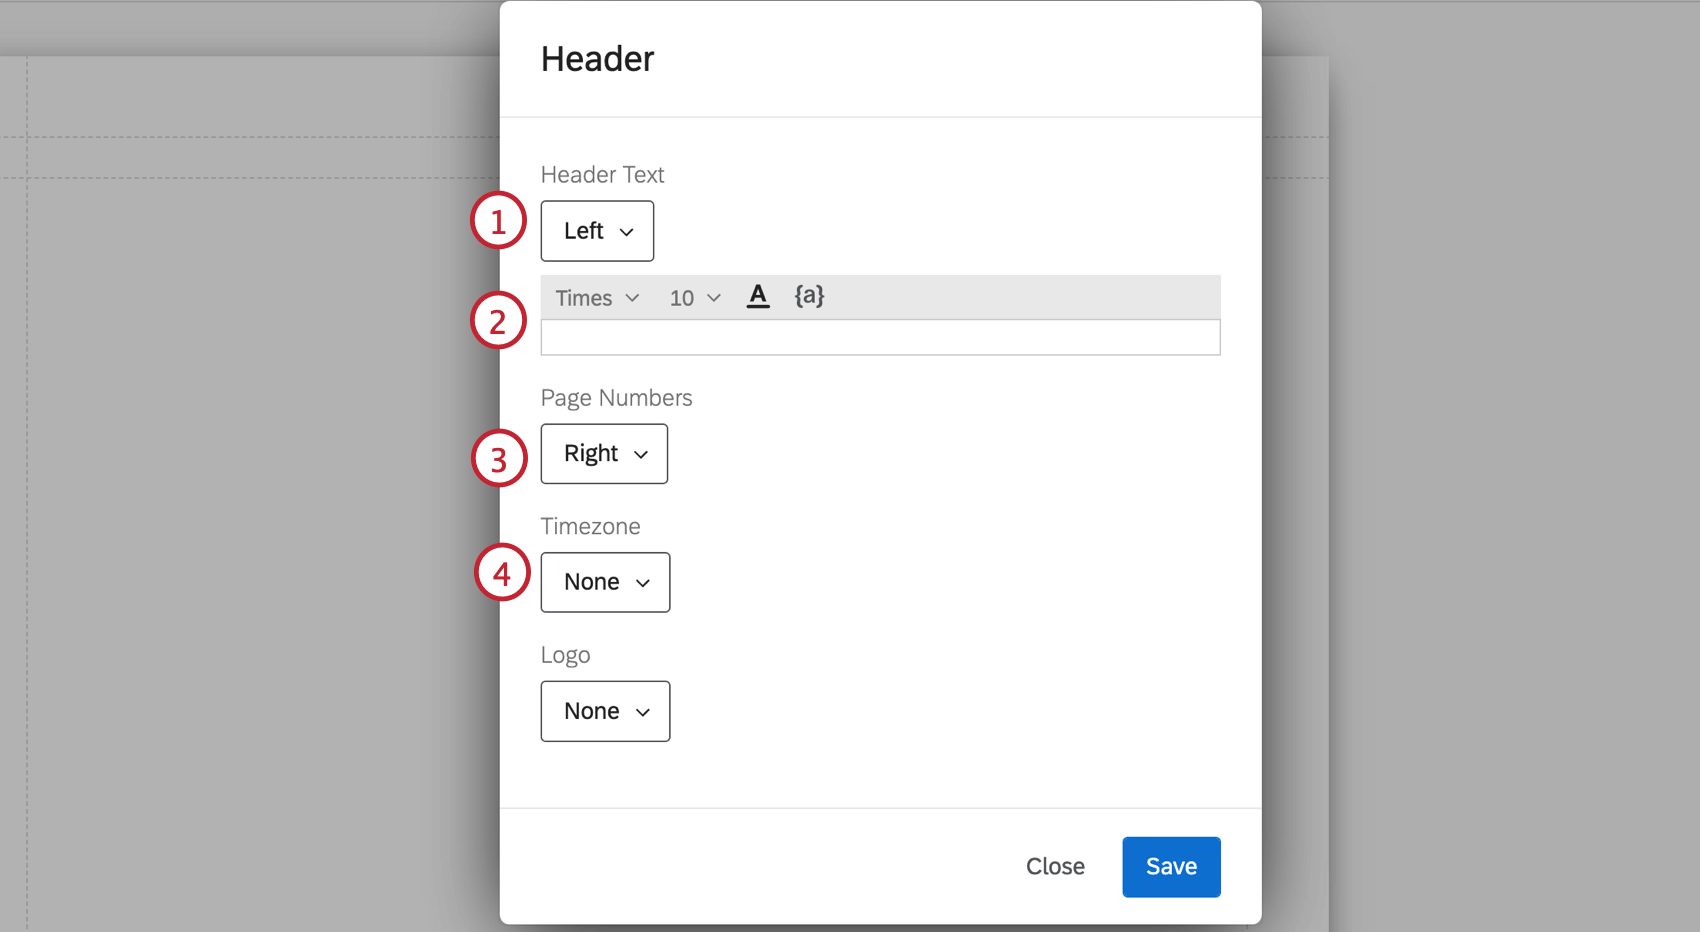
- The alignment of the header/footer text.
- The header/footer text itself. Type the text in the box. Use the options at the top of the box to choose the font type, size, and color. To insert piped text, click the ( {a} ) button.
- The alignment of page numbers, or no page numbers at all.
- The alignment of the time zone, or no time zone at all.
- The report logo alignment. If an option other than None is selected, the following additional options will appear.
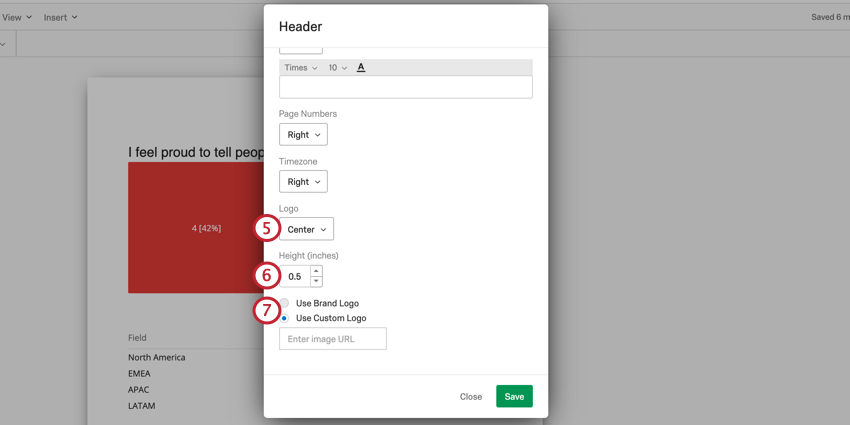
- The logo height in inches.
- Choose either Use Brand Logo to use your brand’s logo or Use Custom Logo to use a different logo. If using a custom logo, the logo must have an associated URL which you will paste in the box that reads Enter image URL.
Qtip: If the Use Brand Logo option is grayed out for you, then your brand does not have a logo. Reach out to Account Executive about getting one.Qtip: If the image you want to use as a logo is saved in your Library, you can copy the image’s URL and use it here.