-

Qualtrics Platform -

Customer Journey Optimizer -

XM Discover -

Qualtrics Social Connect
iQ Anomaly Event
About iQ Anomaly Events
iQ anomaly events let you begin a workflow when there are unexpected spikes or drops in the response count of your surveys and distributions. Instead of seeing unexpected response counts after your study is completed, iQ anomaly events can be used to notify your survey builder in real-time whenever the response count changes atypically.
Meeting the Conditions of an iQ Anomaly Event
In order to trigger an iQ anomaly event, a few conditions need to be met.
- Only survey projects can trigger this event. No other projects, such as Employee Experience, are included.
- Only active surveys trigger this event. That way, you don’t get notifications about closed surveys not receiving responses, since this behavior is expected.
- Only statistical significant increases and decreases will trigger the event, as opposed to ordinary variations in trends.
An anomaly is measured based on 90 days of historical trends. This does not mean having to wait 90 days for a workflow to trigger; the workflow will look at the historical performance of your surveys over 90 days.
Qtip: These conditions are the minimum that must be met to trigger this event. You can also add more conditions during the setup. You can learn how to create these in the next section.
Setting Up an iQ Anomaly Event
- Click the navigation menu in the top left-hand corner.
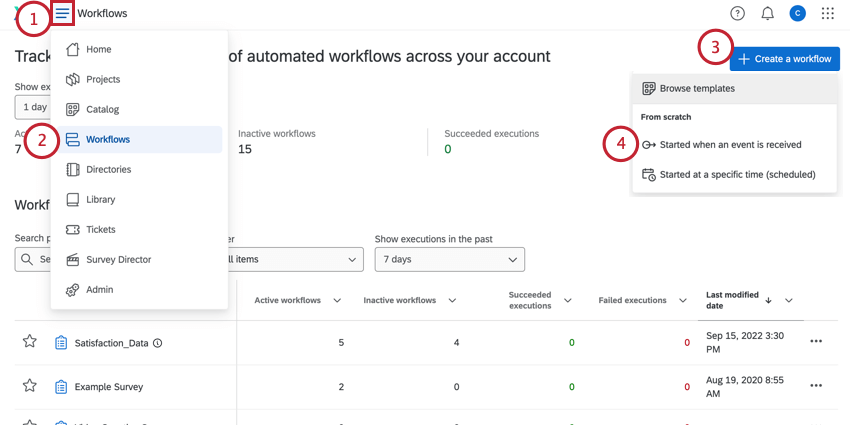
- Select Workflows.
- Click Create a workflow.
- Select Started when an event is received.
- Name your workflow.
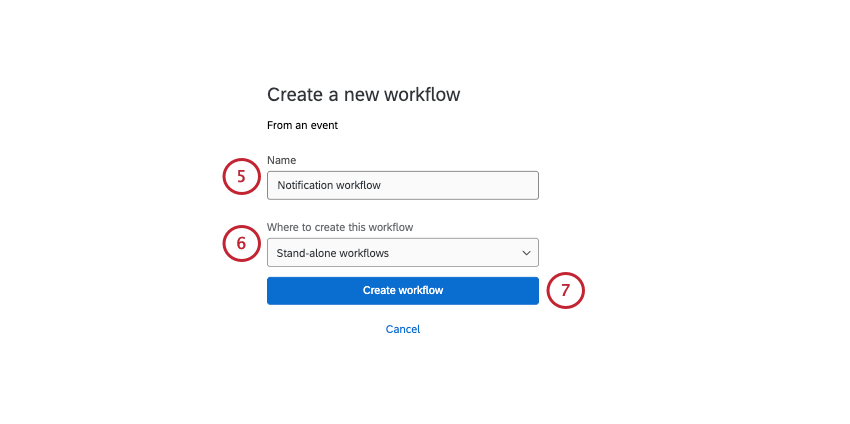
- Select Stand-alone workflows. Other locations do not have this event type.
- Click Create workflow.
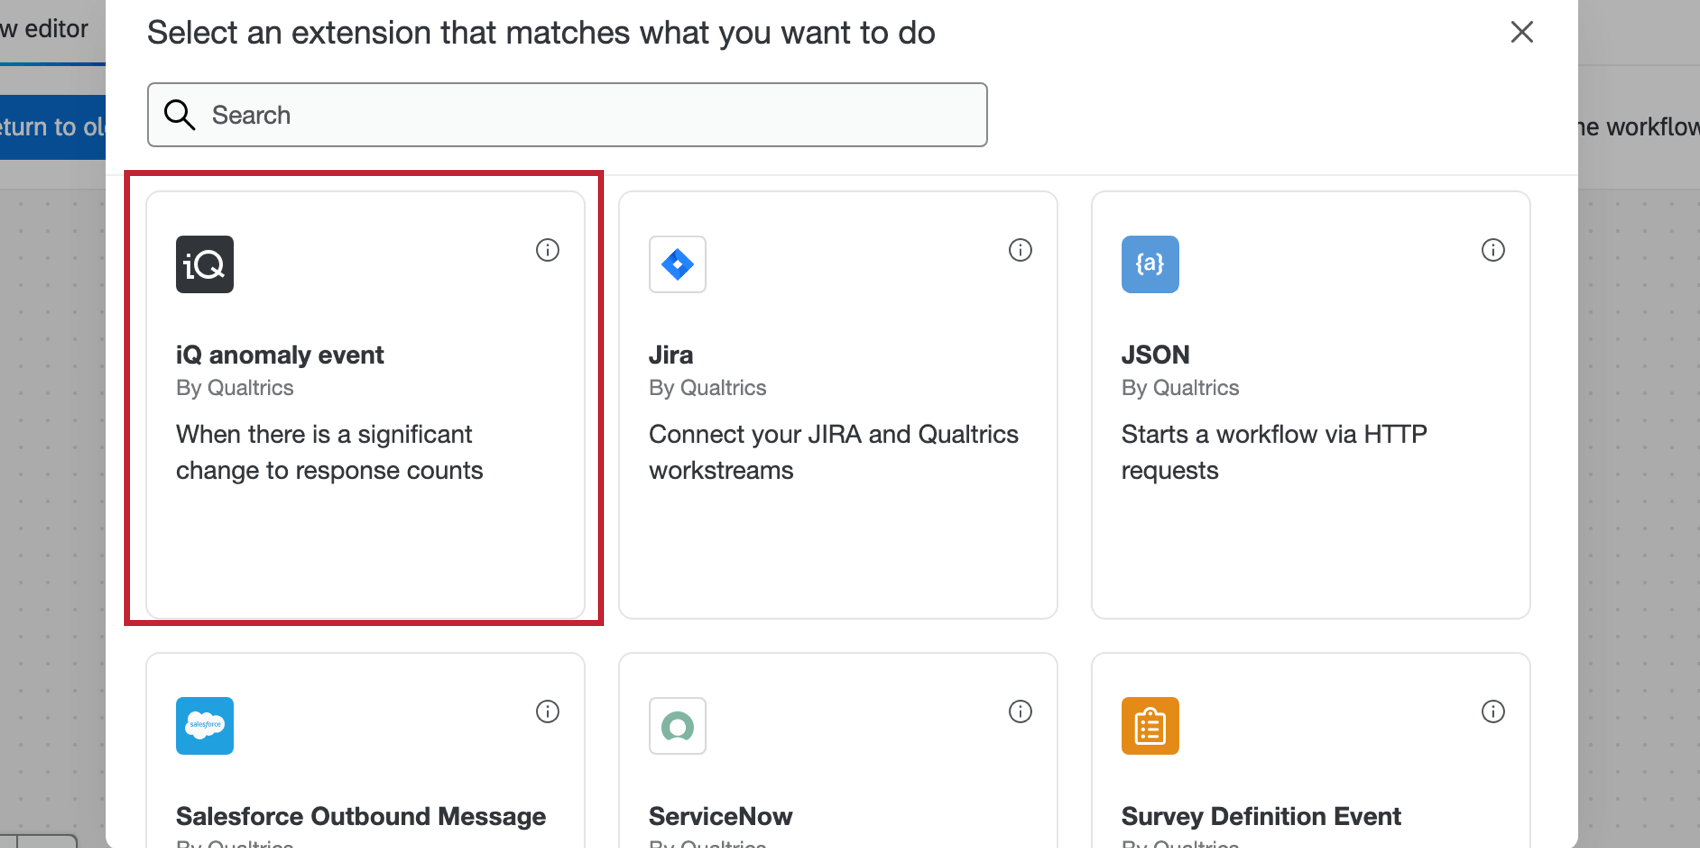
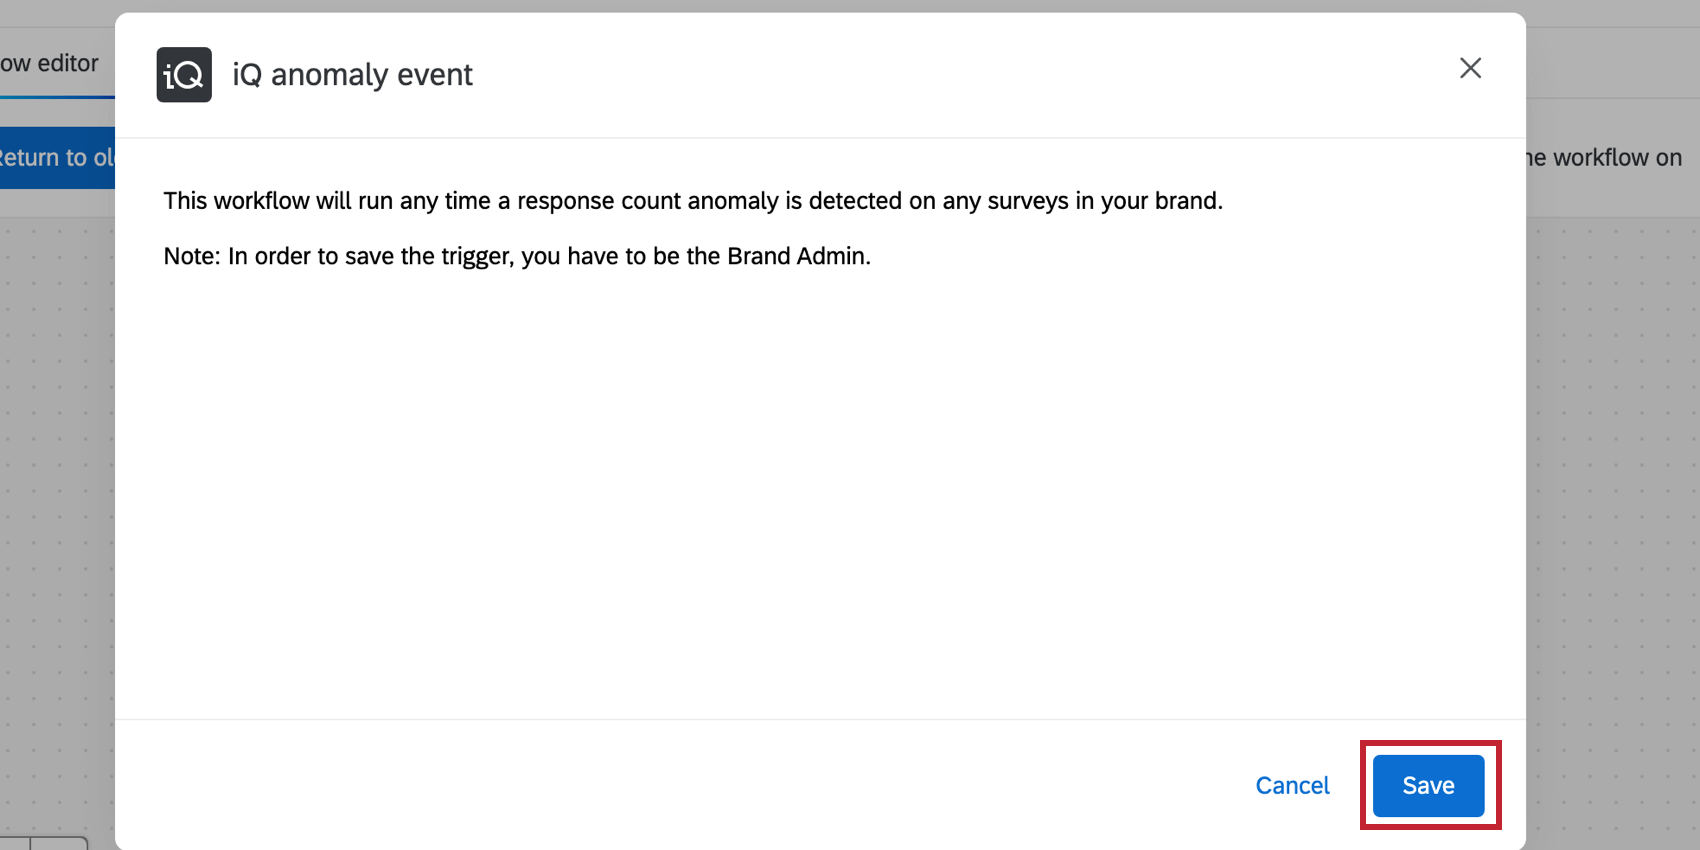
- Choose the iQ anomaly event.
- Click Save.
- You can add conditions to your workflow by clicking the plus sign ( + ). Conditions determine when a workflow runs. You can build conditions based on the following values:
- Anomaly type: The type of detected anomaly, either a spike or a drop.
- Lower bound of expected range value: The minimum expected response count for your survey. This figure should be entered as a decimal.
- Upper bound of expected range value: The maximum expected response count. This figure should be entered as a decimal.
Qtip: Use lower and upper bound range values to indicate what you would expect to see. This could be helpful in setting up notifications that flag events that are outside of this range. For example, if your expected response count is within the range of 100-200 and you receive a response count of 50.
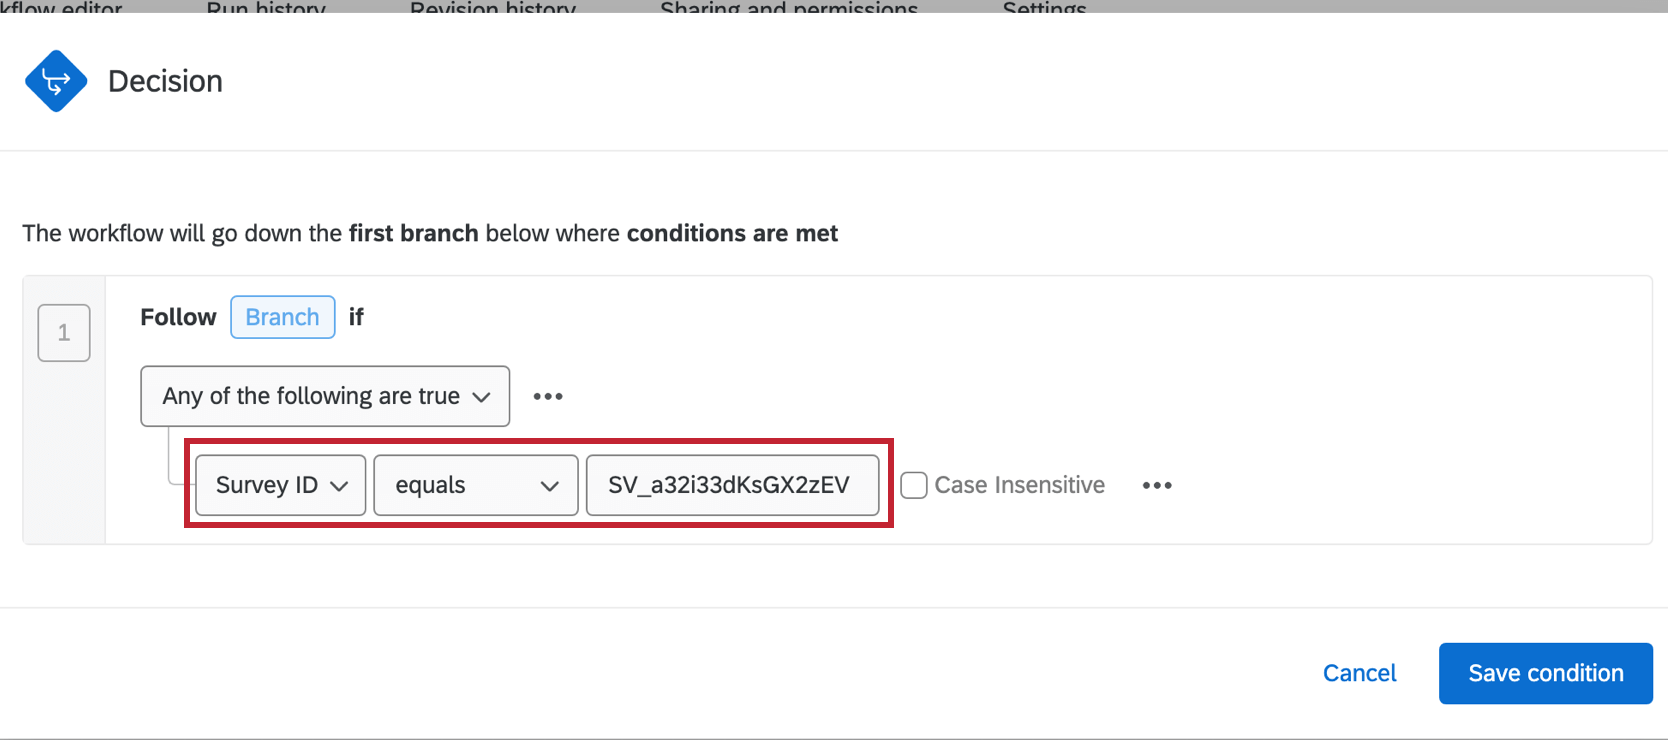
- Survey ID: ID of the survey for which the anomaly has been detected.
- Survey name: Name of the survey for which the anomaly has been detected.
- Time of detection: The time when the anomaly has been detected.
- Value that caused the anomaly: The anomalous value.
Example: Let’s say you want to send an email to your data team every time an anomaly is detected in one specific survey. You can create a condition for “Survey ID equals (your survey ID)”. This way, your data team will only receive notifications for anomalies detected in that survey.
- You can define the tasks for your workflow by clicking the plus sign ( + ). Tasks are what you want to happen as a result of the workflow.